Food Preservative Market by Product (Synthetic Preservative and Natural Preservative), by Function (Antioxidants, Antimicrobials, Acidulants, and Other Functions), by Application (Handling, Assembling & Disassembling, Welding & Soldering, Dispensing, Processing, Others), by Industry Vertical (Bakery and Confectionery, Meat and Poultry, Seafood, Ready Meals, Sweet and Savory Snacks, Sauces and Dressings, and Edible Oils) – Global Opportunity Analysis and Industry Forecast, 2024–2030
Industry: Retail and Consumer | Lastest Edition: January 30, 2026 | No of Pages: 410 | No. of Tables: 268 | No. of Figures: 233 | Format: PDF | Report Code : RC485
Market Overview
The Food Preservative Market size was valued at USD 3.10 billion in 2023, and is expected to reach USD 4.10 billion by 2030, with a CAGR of 4.1% from 2024 to 2030. The food Preservative market encompasses the global industry involved in the manufacturing, distribution, and sale of substances designed to prolong the shelf life of food products. These Preservative are essential in preventing the degradation of food caused by microbial growth, oxidation, and enzymatic activities. The market is characterized by a diverse array of Preservative, both natural and artificial. Preservative are integral in processed and packaged foods, such as canned goods, dairy products, baked goods, and snacks, where they play a crucial role in extending shelf life and preventing spoilage.
The Rising Demand for Processed Foods Boosts Market Expansion
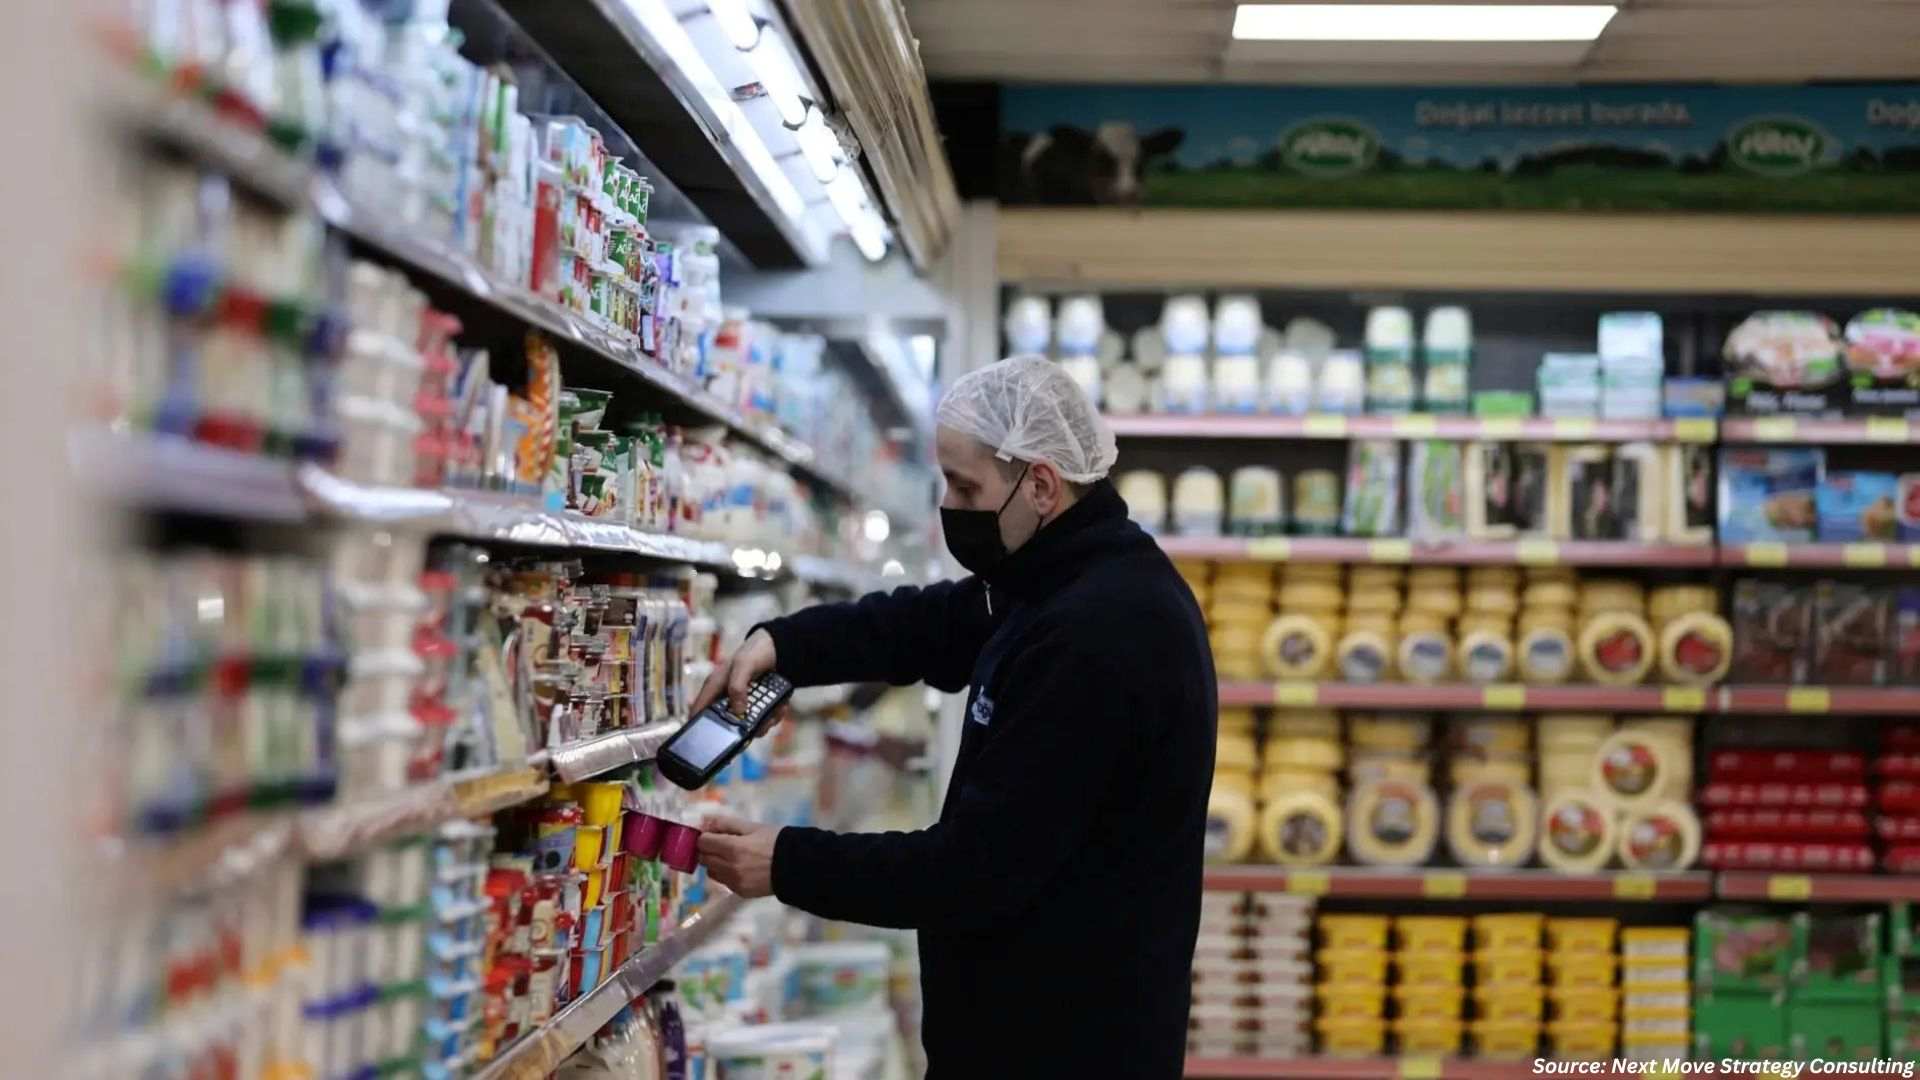
The market for food Preservative is significantly boosted by the global increase in demand for processed and packaged foods, driven by urbanization, busy lifestyles, and a preference for convenience. The shift towards urban living is a major factor in this trend. In 2012, 52.5% of people lived in urban areas, and by 2022, this number increased to 56.9%. Urban environments typically lead to a greater reliance on processed foods due to their convenience and longer shelf life, fueling the need for Preservative.
This trend is more pronounced in developed regions, where urbanization reached 79.7% by 2022. Here, the combination of faster-paced lives and higher disposable incomes has resulted in an increased consumption of processed foods. This has led to a heightened demand for food Preservative to maintain product quality and safety over time.
Role of Stringent Regulations in Boosting the Food Preservative Market
Regulations and safety standards for food Preservative have become a significant factor in boosting the market for these substances. These stringent regulations ensure that Preservative are used safely and effectively, which in turn helps build consumer trust in processed foods, thereby supporting the market growth for Preservative.
An illustrative example of this is the use of sorbate as a food preservative. Sorbate is considered effective and safe when used in a clean environment and in products manufactured under good manufacturing practices. This has been recognized by various regulatory agencies, such as the Food and Drug Administration (FDA), the Food and Agriculture Organization (FAO), and the European Food Safety Authority (EFSA). These agencies have categorized substances like potassium sorbate as "generally regarded as safe" (GRAS). As consumers become more aware and concerned about the ingredients in their food, the assurance provided by these regulatory endorsements is vital in sustaining and growing the market for food Preservative.
Increasing Global Trade and International Supply Chains Fuels the Demand for Food Preservative
The globalization of food supply chains and the growth of international trade are key factors boosting the market for food Preservative. With the expansion of global trade, there's an increasing need for effective Preservative that help maintain the quality and safety of food products during transportation and storage. These Preservative extend the shelf life of foods, making it feasible to transport them across the globe without compromising their quality or safety.
For instance, according to the Agricultural & Processed Food Products Export Development Authority (APEDA) data, India's exports of Processed Food amounted to USD 7,408.64 million in the fiscal year 2022-23. Such substantial trade volumes underscore the vital role of food Preservative in facilitating the international movement of food products. This trend of global food trade not only boosts the demand for traditional Preservative but also spurs innovation in the development of new, more efficient, and safer preservation techniques. As a result, the food preservative industry is witnessing growth and diversification, driven by the need to meet the demands of a globalized food market.
High-Cost Acts as a Barrier to Market Growth in the Food Preservative Industry
The escalating costs of natural Preservative are a major factor hindering the expansion of the food Preservative market. In recent times, there has been a notable shift in consumer preferences towards natural and organic food products, including Preservative. However, the production, extraction, and sourcing of natural Preservative are generally more costly than their synthetic counterparts. The higher costs stem from several factors, such as the need for specialized cultivation practices for natural ingredients, more complex extraction processes, and often lower yields compared to synthetic production. This challenge can limit their widespread adoption and act as a restraint on the overall growth of the food Preservative market, particularly in markets where cost considerations are paramount.
Innovation of New Natural Preservative Creates Market Opportunities
Innovations in preservative technologies are a key factor creating ample opportunities for the future growth of the food Preservative market. The field of food preservation is witnessing significant research and development efforts, leading to the discovery and introduction of new, more effective, and safer Preservative. These innovations are crucial in addressing current health and safety concerns associated with traditional Preservative and are setting the stage for the next generation of food preservation solutions.
These natural alternatives are expected to gain traction as they align with the growing consumer demand for clean label and natural products. For instance, the development and introduction of p-Coumaric Acid (PCA), a natural preservative derived through fermentation processes, represents a significant advancement in this space. Additionally, the launch of new plant-based antibacterial products like PlantGuard AM exemplifies the industry's commitment to innovation and safety. These ongoing innovations in preservative technologies, especially in natural and plant-based solutions, are opening new avenues in the food Preservative market.
North America holds the dominant market share in the global market
The high consumption of processed foods in North America, particularly in the United States, is a significant factor boosting the growth of the food Preservative market. The region is known for one of the highest global rates of consumption of processed and packaged foods. This trend is largely attributed to the busy lifestyle of the average consumer, which inclines them towards convenience foods. Processed foods, being quick and easy to prepare, align well with the fast-paced, time-constrained lives of many North Americans.
Recent research from Northeastern University’s Network Science Institute underscores this trend, revealing that a staggering 73 percent of the United States food supply is ultra-processed. This high percentage of ultra-processed foods in the American diet further amplifies the need for effective food preservation methods.
Moreover, Technological advancements in food preservation significantly contribute to the growth of the food Preservative market, particularly in North America, which is a hub of technological innovation in the food industry. These advancements include the creation of new preservative compounds that are more efficient in small quantities, minimizing their impact on the taste and nutritional value of food. Additionally, there is a growing focus on developing natural and clean-label Preservative, aligning with consumer preferences for healthier and more transparent food options.
Asia Pacific is expected to show steady growth in the global market
The expansion and modernization of the food retail sector in the Asia Pacific region is a crucial factor boosting the growth of the food Preservative market. This region is witnessing a rapid increase in supermarkets and convenience stores, transforming the way consumers shop for and consume food. This expansion of the retail sector is not just a reflection of economic growth, but also a driver of changes in consumer behavior and food consumption patterns. This trend significantly supports the growth of the processed food market in the region.
Additionally, the increasing export opportunities for food products from the Asia Pacific region are a significant factor boosting the growth of the food Preservative market. Many countries in this region, notably China, India, Thailand, and Australia, are major players in the global food export market. In countries including China and India, which have large agricultural sectors, the export of processed and semi-processed food items is a key component of the economy. The role of Preservative in this context is vital for maintaining the quality and safety of food products during long-distance international trade.
Competitive Landscape
Several market players operating in the food Preservative market include Cargill, Inc., Kemin Industries, Inc., ADM, Koninklijke DSM N.V., Tate & Lyle, IFF Nutrition & Biosciences, Kerry Group Plc, DuPont, BASF SE, and Celanese Corporation, among others. These market players are adopting strategies, such as product launches, across various regions, to maintain their dominance in the Food Preservative market.
For instance, July 2022, Kemin Industries Inc. introduced a novel food preservative, RUBINITE GC Dry. This product serves as an alternative to traditional sodium nitrite Preservative and is formulated using natural ingredients.Moreover, in March 2022, DSM launched DelvoGuardcultures, a new product designed for dairy producers seeking clean-label solutions. This product provides an opportunity to extend the shelf life of dairy products such as yogurt, fresh cheese, and sour cream.
Key Market Segments
By Product
-
Synthetic Preservative
-
Propionates
-
Sorbates
-
Benzoates
-
Others
-
-
Natural Preservative
-
Edible Oil
-
Rosemary Extracts
-
Natamycin
-
Vinegar
-
Chitosan
-
Others
-
By Function
-
Antioxidants
-
Antimicrobials
-
Acidulants
-
Other Functions
By Application
-
Handling
-
Assembling & Disassembling
-
Welding & Soldering
-
Dispensing
-
Processing
-
Others
By Industry Vertical
-
Bakery and Confectionery
-
Meat and Poultry
-
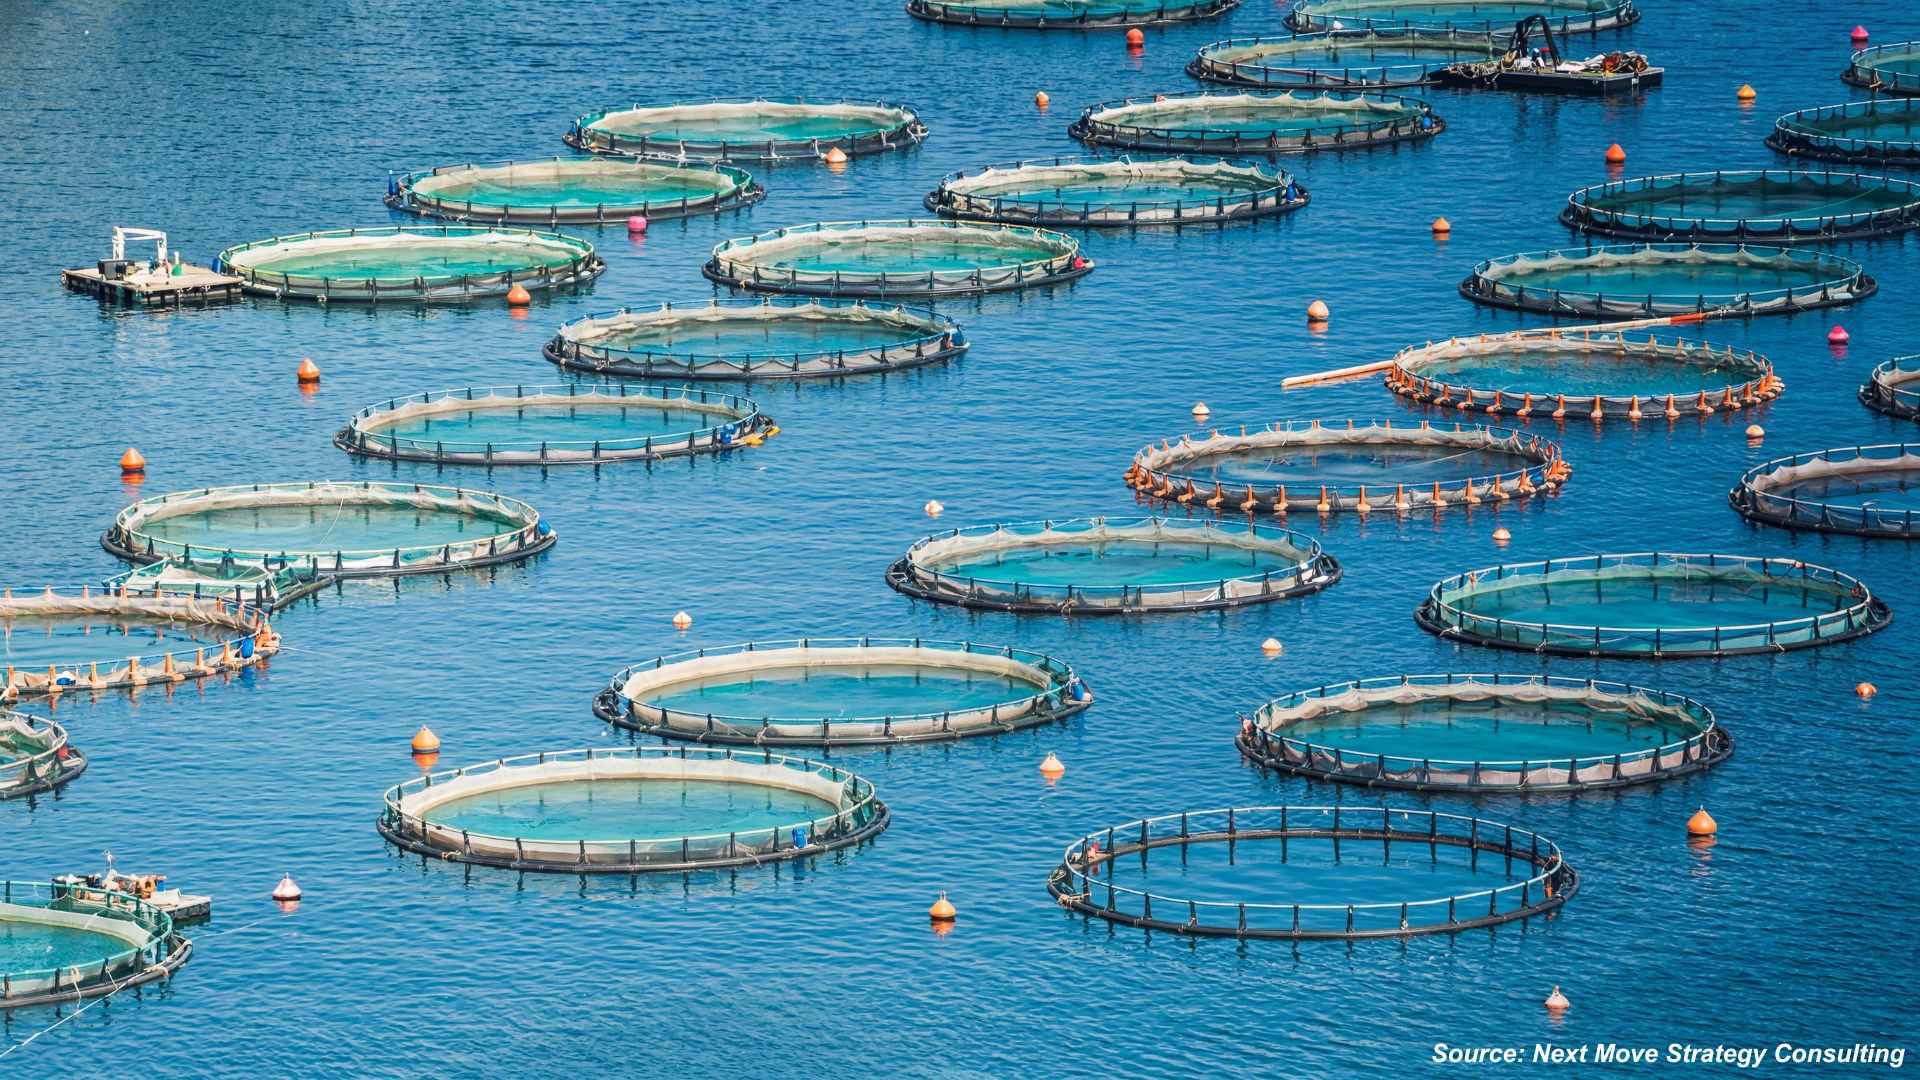
Seafood
-
Ready Meals
-
Sweet and Savory Snacks
-
Sauces and Dressings
-
Edible Oils
By Region
-
North America
-
The U.S.
-
Canada
-
Mexico
-
-
Europe
-
The UK
-
Germany
-
France
-
Italy
-
Spain
-
Netherlands
-
Rest of Europe
-
-
Asia Pacific
-
China
-
Japan
-
India
-
South Korea
-
Australia
-
Singapore
-
Indonesia
-
Rest of Asia Pacific
-
-
RoW
-
Brazil
-
South Africa
-
Nigeria
-
Isreal
-
Kingdom of Saudi Arabia (KSA)
-
REPORT SCOPE AND SEGMENTATION:
|
Parameters |
Details |
|
Market Size in 2023 |
USD 3.10 Billion |
|
Revenue Forecast in 2030 |
USD 4.10 Billion |
|
Growth Rate |
CAGR of 4.1% from 2024 to 2030 |
|
Analysis Period |
2023–2030 |
|
Base Year Considered |
2023 |
|
Forecast Period |
2024–2030 |
|
Market Size Estimation |
Billion (USD) |
|
Growth Factors |
The rising demand for processed foods boosts market expansion |
|
Countries Covered |
24 |
|
Companies Profiled |
10 |
|
Market Share |
Available for 10 companies |
|
Customization Scope |
Free customization (equivalent up to 80 working hours of analysts) after purchase. Addition or alteration to country, regional, and segment scope. |
|
Pricing and Purchase Options |
Avail customized purchase options to meet your exact research needs. |
Key Players
-
Cargill, Inc.
-
Kemin Industries, Inc.
-
ADM
-
Koninklijke DSM N.V.
-
Tate & Lyle
-
IFF Nutrition & Biosciences
-
Kerry Group Plc
-
DuPont
-
BASF SE
-
Celanese Corporation
")


About the Author
 Sikha Haritwal is an assistant manager with strong expertise in market research, data analysis, and cross-functional coordination. She plays a key role in leading complex research initiatives, strengthening analytical rigor, and enabling data-driven decision-making across teams. Known for her leadership mindset and structured problem-solving approach, she supports process improvement, enhances operational efficiency, and contributes to building scalable frameworks that drive long-term strategic outcomes and organizational effectiveness.
About the Reviewer
 Supradip Baul is an accomplished business consultant and strategist with over a decade of rich experience in market intelligence, strategy, technology, and business transformation. His work has included rigorous qualitative and quantitative analysis across multiple industries, helping clients shape investment decisions and long-term roadmaps. Earlier in his career, he was associated with Gartner, where he contributed to industry-leading reports and market share analyses. He has worked with leading global companies and holds an MBA with a dual specialization in Marketing and Finance.
At Next Move Strategy Consulting, we understand that insightful market research is the cornerstone of successful business decisions. That's why we employ a robust and multifaceted approach, combining various methodologies to deliver the most accurate and actionable data for our clients.

Research Landscape
We navigate the world of research with two primary approaches:
Qualitative Approach
Our qualitative research methodologies involve immersive techniques such as in-depth interviews, focus groups, and observational studies. By engaging directly with individuals and stakeholders, we uncover valuable insights that quantitative data alone may overlook.

Quantitative Research
In tandem with qualitative methodologies, NMSC leverages the power of Quantitative Research to provide a robust foundation of numerical insights. Through systematic data collection and analysis, we quantify patterns, preferences, and market trends, offering a comprehensive view of the business landscape.
Our quantitative research approach employs diverse tools, including surveys, experiments, and statistical modelling. These methodologies enable us to gather data from a large and representative sample, ensuring the statistical significance of our findings. By employing structured questionnaires and standardized data collection methods, we guarantee the reliability and validity of the information we present to our clients.
Quantitative research is particularly effective in measuring the prevalence of trends, assessing market size, and gauging the impact of various factors on consumer behavior. The numerical precision attained through this approach equips our clients with actionable insights, facilitating data-driven decision-making and strategy formulation.


Our Specialized Toolbox for Industry-Specific Market Research
We deploy a specialized arsenal of techniques tailored to meet your unique requirements. Here's a glimpse into our comprehensive toolbox:

Information Procurement
The stage entails acquiring market data or relevant information through various sources and methodologies.


Market Research Approach
We utilize both top-down and bottom-up approaches in market research analysis to achieve a comprehensive understanding of the market dynamics, leveraging the broad perspective of industry trends and macroeconomic factors alongside detailed insights from specific segments and individual companies.

Porters Five Forces Analysis
We conduct Porter's Five Forces analysis to evaluate the competitive landscape of an industry, providing us with insights into factors that affect profitability and strategic positioning.

SWOT Analysis

Forecasting
We utilize a forecasting model to predict future consumption by considering parameters like population, economics, regulations, market competition, drivers, constraints, technology, and pricing. We also employ statistical techniques such as multilinear regression, exponential smoothing, moving average, ARIMA, and Monte Carlo simulations for accurate predictions. In econometric forecasting, we analyzed short-term and long-term event impacts, attributing values based on regulatory frameworks, economic factors, and market events.


 Speak to Our Analyst