Granular Fertilizers Market Global Industry Analysis and Forecast (2026-2035)

Granular Fertilizers Market size is estimated at USD 115.15 billion in 2026, projected to reach USD 188.76 billion by 2035, growing at a CAGR of 5.65% from 2026 to 2035. Key drivers include rising global food demand, and increasing precision agriculture use, with Asia-Pacific leading the market and Middle East & Africa registering the fastest growth.

Download Free Sample PDF
Base Year (2025)
$106.97 Billion
Forecast (2035)
$188.76 Billion
CAGR (2026-2035)
5.7%
Top Region
Asia-Pacific

What Is the Granular Fertilizers Market Size?
The global granular fertilizers market size was valued at USD 106.97 Billion in 2025 and is estimated to grow from USD 115.15 Billion in 2026 to USD 188.76 Billion by 2035, expanding at a CAGR of 5.65% between 2026 and 2035. Asia-Pacific led the granular fertilizers market with an approximate 38% revenue share in 2025, while Nitrogenous Fertilizers remained the dominant nutrient-type segment with an approximate 38% share of global revenue.

We observed that the granular fertilizers market's momentum is best captured through a concise set of indicators before deeper analysis follows.

Granular Fertilizers Market Global Industry Analysis and Forecast (2026-2035) Revenue Forecast
Values in USD Billion

2025 $106.97 Billion
2025
2026 $113.01 Billion
2026
2027 $119.40 Billion
2027
2028 $126.15 Billion
2028
2029 $133.27 Billion
2029
2030 $140.80 Billion
2030
2031 $148.76 Billion
2031
2032 $157.16 Billion
2032
2033 $166.04 Billion
2033
2034 $175.42 Billion
2034
2035 $188.76 Billion
2035

Key Takeaways

By Nutrient Type: Nitrogenous Fertilizers held the largest share at approximately USD 40.65 billion in 2025 and are projected to reach USD 64.18 billion by 2035; Secondary and Micronutrient Fertilizers are the fastest-growing sub-segment at 10.91% CAGR from 2026–2035.

By Formulation Technology: Conventional Granular held the largest share at approximately USD 72.74 billion in 2025 and is projected to reach USD 105.71 billion by 2035; Slow-Release Granular is the fastest-growing sub-segment at 9.47% CAGR from 2026–2035.

By Crop Application: Cereals and Grains held the largest share at approximately USD 51.35 billion in 2025 and are projected to reach USD 79.28 billion by 2035; Fruits and Vegetables are the fastest-growing sub-segment at 8.20% CAGR from 2026–2035.

Dominant Region: Asia-Pacific dominated with approximately USD 40.65 billion in 2025 and is projected to reach USD 67.95 billion by 2035.

Fastest-Growing Region: Middle East & Africa is expected to register the highest CAGR of 8.27% during 2026–2035.

Dominant Country: China led as the largest single national contributor within the Asia-Pacific region in 2025.

Fastest-Growing Country: Saudi Arabia is expected to register the fastest growth, with its CAGR exceeding the Middle East & Africa regional average during 2026–2035.

Market Opportunity: The granular fertilizers market is projected to generate an incremental revenue opportunity of approximately USD 73.61 Billion between 2026 and 2035, reflecting the absolute dollar gap between the 2035 forecast and the 2026 base value a signal of sustained investment in coated and controlled-release granular formulations.

According to NMSC analysis, slow-release and coated granular formulations are gaining share fastest in regions with strict nutrient runoff regulation, a dynamic that is reshaping formulation technology investment beyond what aggregate nutrient-type revenue figures alone convey.

What does the Granular Fertilizers Market Encompass?
The granular fertilizers market encompasses solid, granule-form nitrogenous, phosphatic, potassic, and complex NPK fertilizer products applied to agricultural soil to supply essential crop nutrients. Our assessment indicates that the market's scope spans conventional granular products alongside coated and controlled-release formulations designed to improve nutrient use efficiency, distinct from liquid fertilizer products applied through fertigation or foliar spray systems.

Structurally, the market has evolved from single-nutrient conventional granular products toward coated and controlled-release formulations that reduce nutrient runoff and improve per-application efficiency. We found that regulatory environments administered by agricultural and environmental authorities continue to tighten nutrient runoff and water-quality standards shaping formulation technology adoption, while technology adoption trends in precision application equipment are reshaping how granular fertilizer application rates are calibrated across large-scale commercial farming operations.

Ecosystem Analysis of the Granular Fertilizers Market
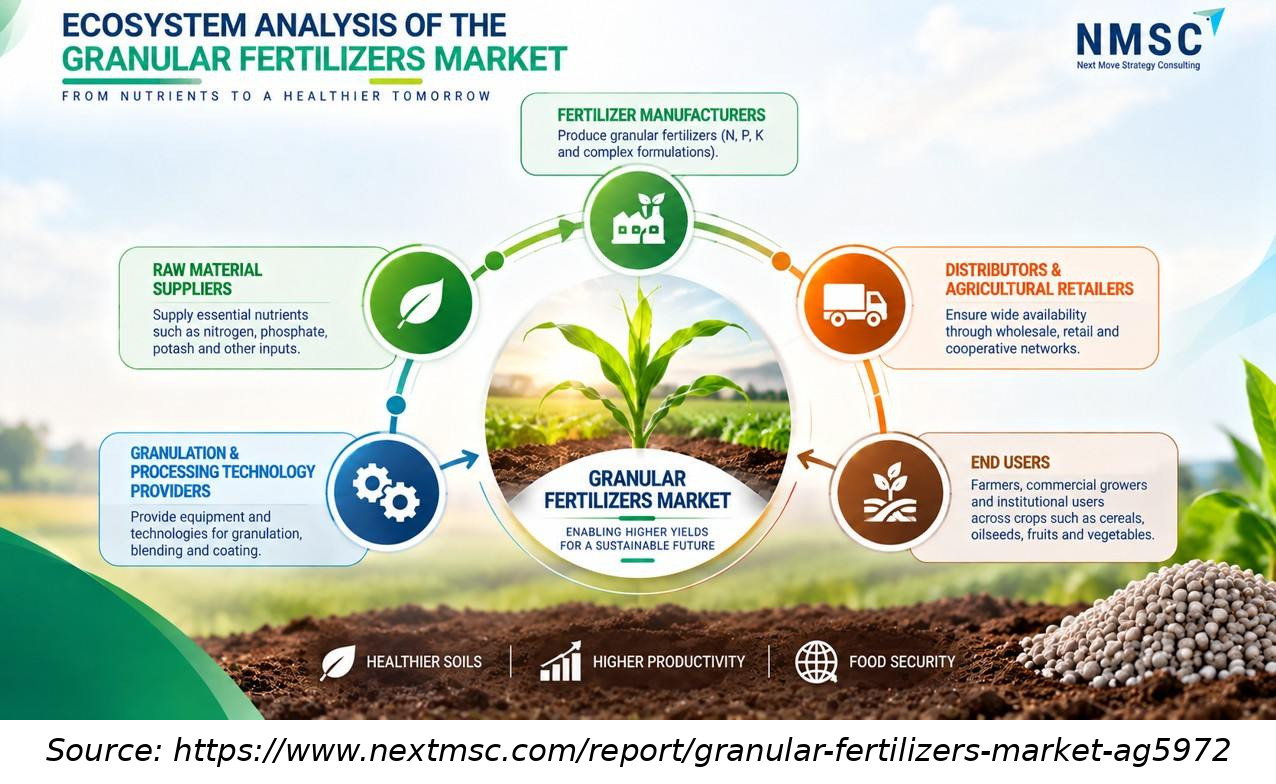
The infographic presents the Ecosystem Analysis of the Granular Fertilizers Market, illustrating the key participants across the value chain. It highlights raw material suppliers, fertilizer manufacturers, granulation and processing technology providers, distributors and agricultural retailers, and end users. The interconnected structure shows how these stakeholders support fertilizer production, distribution, agricultural productivity, healthier soils, and food security across the market.

Market Drivers & Dynamics

Interactive Dataset
Rising global food demand requiring yield-focused fertilizer application driver +1.6% Global 2026–2035
Expanding controlled-release and coated formulation adoption driver +1.2% North America, Europe 2026–2033
Growing government subsidy support for domestic fertilizer production driver +0.9% Asia-Pacific, Middle East & Africa 2026–2032
Rising precision agriculture equipment adoption improving application efficiency driver +0.7% North America, Europe 2027–2035
Expanding arable land under commercial cultivation in emerging markets driver +0.6% Latin America, Middle East & Africa 2026–2035
Volatile natural gas and mineral feedstock pricing restraint −0.8% Global 2026–2032
Tightening nutrient runoff and water-quality regulation restraint −0.5% North America, Europe 2026–2032
Farmer adoption barriers to higher-cost coated formulations restraint −0.4% Asia-Pacific, Latin America 2026–2030
Source: Next Move Strategy Consulting

Growth Drivers

What Is the Primary Growth Driver for the Granular Fertilizers Market?

Rising global food demand requiring yield-focused fertilizer application is the primary growth driver, sustaining consistent grower investment in nitrogenous, phosphatic, and potassic products. The United Nations Food and Agriculture Organization projects that global agricultural production must continue expanding to meet population-driven food demand through the coming decade, underscoring the scale of the addressable cultivated land base from which granular fertilizer demand continues to expand.

How Is Controlled-Release Technology Driving the Market Growth?

Controlled-release and coated formulation technology is driving growth by commanding premium per-unit pricing relative to conventional granular products while addressing nutrient runoff regulatory pressure. Company analysis indicates that producers with established coating technology capability are capturing incremental margin from growers seeking regulatory-compliant, higher-efficiency products. Based on research conducted by NMSC, we found that this shift is most pronounced across North American and European commercial farming operations.

Growth Inhibitors

What Is Restraining the Granular Fertilizers Market?

Volatile natural gas and mineral feedstock pricing is restraining margin stability, as nitrogenous fertilizer production costs are directly tied to natural gas prices used in ammonia synthesis. We observed that this restraint is most pronounced for nitrogen fertilizer producers lacking captive natural gas supply agreements, exposing production costs to periodic energy market volatility that compresses margins even as end-market demand remains stable.

Segmentation Analysis

2025 (USD Billion)
2035 (USD Billion)
Nitrogenous Fertilizers 2025: $40.65 Billion | 2035: $64.18 Billion
Nitrogenous
Phosphatic Fertilizers 2025: $23.53 Billion | 2035: $39.64 Billion
Phosphatic F
Potassic Fertilizers 2025: $19.25 Billion | 2035: $32.09 Billion
Potassic Fer
NPK Complex Fertilizers 2025: $18.19 Billion | 2035: $37.75 Billion
NPK Complex
Secondary and Micronutrient Fertilizers 2025: $5.35 Billion | 2035: $15.10 Billion
Secondary an
Nitrogenous Fertilizers $40.65 Billion $64.18 Billion 4.68%
Phosphatic Fertilizers $23.53 Billion $39.64 Billion 5.36%
Potassic Fertilizers $19.25 Billion $32.09 Billion 5.25%
NPK Complex Fertilizers $18.19 Billion $37.75 Billion 7.47%
Secondary and Micronutrient Fertilizers $5.35 Billion $15.10 Billion 10.91%

Which Nutrient Type Dominates the Granular Fertilizers Market?

Nitrogenous Fertilizers dominate nutrient-type segmentation with an estimated USD 40.65 Billion in 2025, rising to USD 64.18 Billion by 2035, reflecting nitrogen's role as the most widely applied and yield-critical crop nutrient globally, closely tracked by the urea segment within it. Secondary and Micronutrient Fertilizers are the fastest-growing category at a 10.91% CAGR, reflecting rising soil deficiency correction demand among intensively cultivated fruit and vegetable growers.

2025 (USD Billion)
2035 (USD Billion)
Conventional
Coated and c
Slow-release
Segment Item 2025 (USD Billion) 2035 (USD Billion) CAGR
Conventional granular $10.0 USD Billion $40.0 USD Billion 19.0%
Coated and controlled-release granular $17.1 USD Billion $51.1 USD Billion 25.0%
Slow-release granular $24.2 USD Billion $62.2 USD Billion 19.0%

Segment-wise data is locked

Unlock complete segment-wise numbers for By Formulation Technology.

Unlock Full Data

Which Formulation Technology Is Gaining the Most Ground?

Conventional Granular formulations lead with USD 72.74 Billion in 2025 revenue, reflecting continued cost-driven preference among price-sensitive commodity crop growers. Slow-Release Granular is the fastest-growing formulation technology at a 9.47% CAGR, driven by rising adoption among high-value crop growers seeking extended nutrient availability and reduced application frequency.

2025 (USD Billion)
2035 (USD Billion)
Cereals and
Oilseeds and
Fruits and v
Turf and orn
Other crops
Segment Item 2025 (USD Billion) 2035 (USD Billion) CAGR
Cereals and grains $10.0 USD Billion $40.0 USD Billion 11.0%
Oilseeds and pulses $17.1 USD Billion $51.1 USD Billion 13.0%
Fruits and vegetables $24.2 USD Billion $62.2 USD Billion 15.0%
Turf and ornamental $31.3 USD Billion $73.3 USD Billion 17.0%
Other crops $38.4 USD Billion $84.4 USD Billion 18.0%

Segment-wise data is locked

Unlock complete segment-wise numbers for By Crop Application.

Unlock Full Data

Which Crop Application Segment Is Growing Fastest?

Cereals and Grains lead crop-application segmentation with USD 51.35 Billion in 2025 revenue, reflecting the scale of global cereal cultivation acreage relative to other crop categories. Fruits and Vegetables is the fastest-growing application at a 8.20% CAGR, driven by rising adoption of premium coated and micronutrient-fortified formulations among high-value horticultural growers.

2025 (USD Billion)
2035 (USD Billion)
Cooperative
Retail and d
Online
Segment Item 2025 (USD Billion) 2035 (USD Billion) CAGR
Cooperative and direct sales $10.0 USD Billion $40.0 USD Billion 25.0%
Retail and dealer $17.1 USD Billion $51.1 USD Billion 19.0%
Online $24.2 USD Billion $62.2 USD Billion 25.0%

Segment-wise data is locked

Unlock complete segment-wise numbers for By Distribution Channel.

Unlock Full Data

Growth Opportunities

Beyond current demand drivers, three whitespace opportunities stand out as forward-looking mechanisms for revenue expansion through 2035.

Can Affordable Coated Formulations Unlock Emerging-Market Adoption?

Lower-cost coated and controlled-release formulations tailored to price-sensitive emerging-market growers can unlock adoption currently concentrated among North American and European commercial farms. This mechanism primarily benefits producers with scaled coating technology manufacturing capable of reaching cost parity with conventional granular products.

Will Precision-Calibrated Micronutrient Blends Expand Specialty Crop Demand?

Precision-calibrated micronutrient blends tailored to specific crop and soil deficiency profiles offer a mechanism to expand demand among specialty and horticultural growers beyond generic NPK formulations. Producers with established agronomic testing and biostimulant co-formulation capability are best positioned to capture this growing specialty-crop opportunity.

Can Domestic Capacity Expansion Reduce Import Dependency Risk Premiums?

Domestic granular fertilizer production capacity expansion in historically import-dependent markets offers a mechanism to reduce supply-risk premiums currently embedded in landed product pricing. Producers investing in regional manufacturing capacity are best positioned to capture government-backed capacity expansion incentives tied to national food-security priorities.

Regulatory Framework Impacting the Granular Fertilizers Market
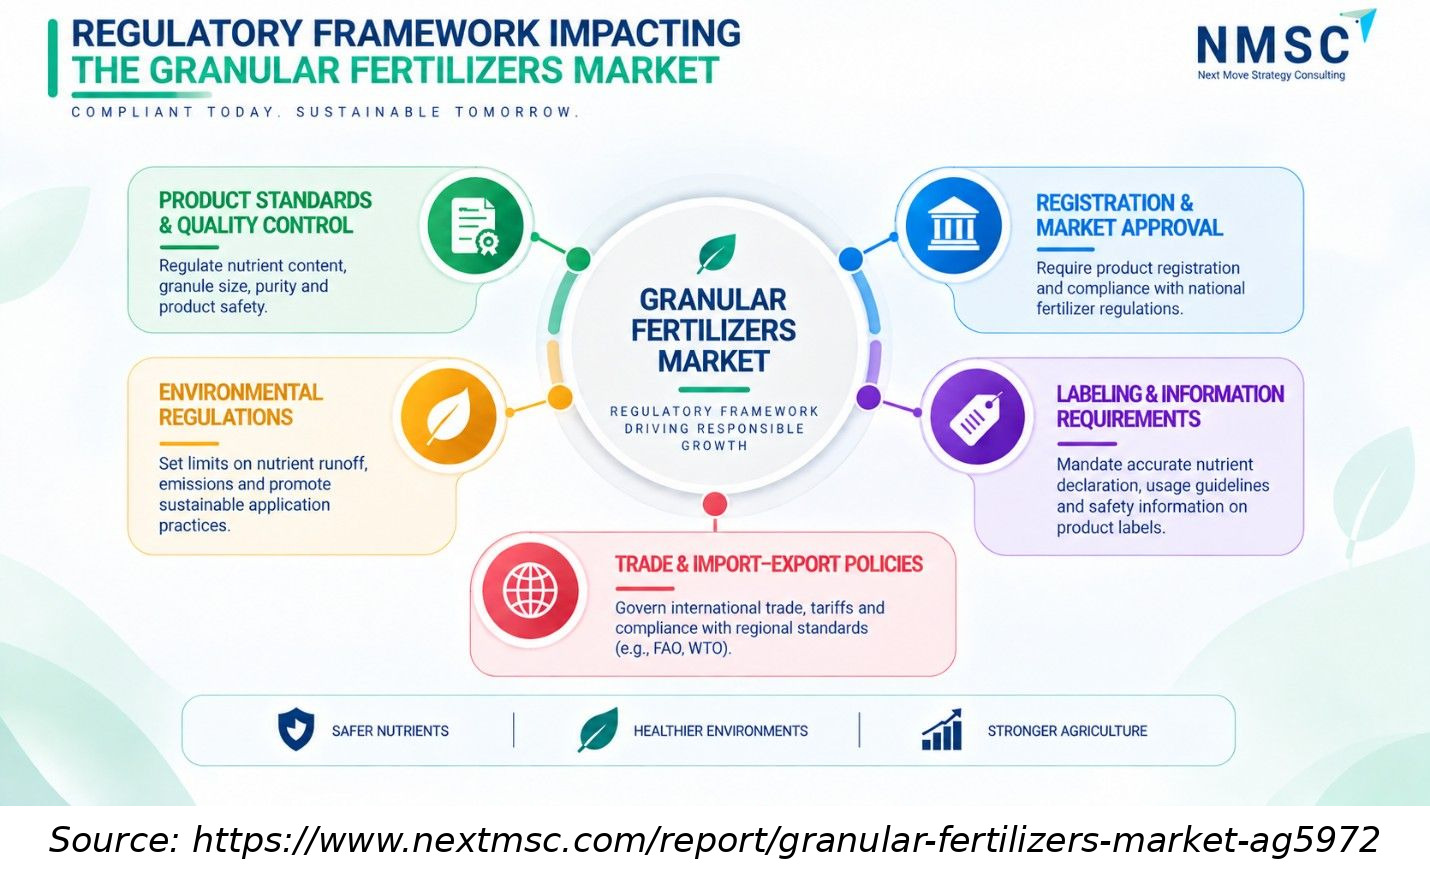
The infographic presents the Regulatory Framework Impacting the Granular Fertilizers Market through a clean, minimal circular layout centered on responsible fertilizer use, with NMSC branding and simple regulatory icons. It highlights product standards and quality control, registration and market approval, environmental regulations, labeling and information requirements, and trade and import-export policies, showing their role in supporting safer nutrients, healthier environments, and stronger agriculture.
Regional Outlook

2025 (USD Billion)
2035 (USD Billion)
North Americ
Europe
Asia-Pacific
Middle East
Latin Americ
Region 2025 (USD Billion) 2035 (USD Billion) CAGR (%)
North America $10.0 USD Billion $40.0 USD Billion 9.0%
Europe $17.1 USD Billion $51.1 USD Billion 27.0%
Asia-Pacific $24.2 USD Billion $62.2 USD Billion 25.0%
Middle East & Africa $31.3 USD Billion $73.3 USD Billion 23.0%
Latin America $38.4 USD Billion $84.4 USD Billion 12.0%

Regional data is locked

Unlock complete regional numbers for this market.

Unlock Full Data

Competitive Landscape

Our findings suggest that the competitive landscape spans vertically integrated global fertilizer majors and regional production cooperatives, each pursuing distinct differentiation strategies across the granular fertilizer value chain.

Dimension Description
Dimension Assessment
Market Structure Moderately consolidated; vertically integrated majors hold significant nitrogen and phosphate capacity share while regional producers and cooperatives compete on domestic market proximity
Innovation Focus Controlled-release coating technology, micronutrient fortification, precision application-compatible formulations
M&A Activity Selective; producers pursue capacity-expanding acquisitions and long-term feedstock supply agreements

How Do Companies Compete in the Granular Fertilizers Market?

Companies compete primarily on production capacity scale, feedstock cost advantage, and breadth of coated and controlled-release formulation capability. Our analysis shows that vertically integrated producers with captive natural gas or mineral resource access sustain more stable margins than competitors reliant on merchant feedstock purchases, particularly during periods of energy price volatility.

Which Competitive Archetypes Dominate the Granular Fertilizers Market?

Two archetypes dominate: vertically integrated global majors controlling nitrogen, phosphate, or potash production capacity at scale, and regional producers and cooperatives serving domestic grower networks with proximity-based distribution advantages. We observed that the differentiation between these archetypes is narrowing as global majors expand regional production and distribution footprints.

What Innovation and Differentiation Strategies Are Companies Pursuing?

Company analysis indicates that leading firms are differentiating through proprietary controlled-release coating technology, micronutrient fortification capability, and digital agronomy tools supporting precision application. Investment in domestic production capacity expansion continues, alongside long-term feedstock supply agreements designed to insulate margins from natural gas and mineral price volatility.

How Active Is M&A in the Granular Fertilizers Industry?

M&A activity remains selective as producers pursue capacity-expanding acquisitions and long-term feedstock supply agreements rather than broad portfolio diversification. Based on research conducted by NMSC, we found that acquisition interest is concentrated on coating technology developers and regional production assets, reflecting strategic pivots toward the fastest-growing formulation and geographic categories.

Key Market Players

Our assessment indicates that the following companies represent the validated set of key players shaping competitive dynamics across nitrogenous, phosphatic, potassic, and complex NPK granular fertilizer production within the granular fertilizers market.

Nutrien Ltd. Yara International ASA CF Industries Holdings, Inc. The Mosaic Company EuroChem Group AG PhosAgro PJSC OCP Group S.A. ICL Group Ltd. K+S Aktiengesellschaft Coromandel International Limited SQM S.A. Uralkali PJSC Koch Industries, Inc. Indian Farmers Fertiliser Cooperative Limited Sinochem Holdings Corporation Ltd. Wengfu Group Co., Ltd. Haifa Group Compass Minerals International, Inc. Belaruskali OAO Saudi Arabian Mining Company (Ma’aden)

Latest Developments

We observed that recent developments across the industry reflect continued investment in domestic production capacity and controlled-release formulation technology.

Date Event
June, 2026 Yara highlighted continued commercial deployment of its PROCOTE coating technology, which applies micronutrients or biostimulants to granular fertilizers. The technology is now used across Brazil, North America, Latin America, Africa, and parts of Asia, extending the functionality of conventional granular fertilizer products without changing their core nutrient base.
November, 2025 PhosAgro reported pilot production at Balakovo under the third development phase, introducing flexible MAP, DAP, NPK, and NPS fertilizer production. Once fully commissioned, the modernization is expected to add nearly 1 million tonnes of annual fertilizer capacity, lifting Balakovo output to approximately 3.5 million tonnes.

Expert Insights

Alzbeta Klein

Alzbeta Klein

CEO & Director General | International Fertilizer Association (IFA)

"Fertilizers are not merely an agricultural input. They are a strategic resource, a key part of the food system that supports billions of people."

Analyst Interpretation

The statement highlights fertilizers as a strategic component of global food security rather than simply an agricultural input. For the granular fertilizers market, this underscores the importance of maintaining reliable supplies of nitrogen, phosphate, potash, and compound fertilizers to support crop productivity. Rising emphasis on fertilizer security is also encouraging supply-chain diversification, regional production capacity, and investment in efficient and sustainable fertilizer solutions.

Investment Opportunities

Where Is Capital Flowing Within the Granular Fertilizers Market?

Capital inflows are concentrated in domestic production capacity expansion and controlled-release coating technology development among vertically integrated global producers. We found that government-backed capacity investment is also flowing into historically import-dependent markets seeking to reduce supply-risk exposure tied to global nitrogen and phosphate trade flows.

How Significant Is Infrastructure Investment in This Market?

Infrastructure investment is substantial, with producers expanding ammonia synthesis and phosphate processing capacity to meet rising domestic and export demand. Our assessment indicates that continued investment in coating and granulation technology infrastructure is becoming a prerequisite for competing in the fastest-growing controlled-release formulation categories.

What ESG Considerations Are Relevant to This Market?

ESG considerations center on nutrient runoff and water-quality impact, greenhouse gas emissions tied to ammonia synthesis, and responsible sourcing of phosphate and potash mineral reserves. We observed that producers increasingly disclose emissions-reduction and nutrient-efficiency commitments in annual sustainability reporting relevant to grower and regulatory expectations.

Key Benefits for Stakeholders

How Does This Report Benefit Industry Leaders?

Industry and enterprise leaders gain a structured view of nutrient-type, formulation, and regional revenue distribution, supporting prioritization decisions across production capacity investment and formulation technology strategy. Our analysis shows that this structured segmentation clarifies where competitive intensity is rising fastest ahead of resource-allocation decisions.

How Does This Report Benefit Investors and Financial Analysts?

Investors and financial analysts gain reconciled market-size, CAGR, and regional-growth data supporting valuation and portfolio-allocation decisions. Company analysis indicates that segment-level growth differentials, particularly around controlled-release and micronutrient categories, are material inputs for evaluating producer growth durability.

How Does This Report Benefit Technology Vendors and Product Teams?

Technology vendors and product teams gain visibility into formulation and crop-application trends shaping coating technology and precision application infrastructure demand. We found that this analysis supports prioritization of engineering investment toward the fastest-growing product categories identified across the forecast period.

Key Market Segments Evaluated

By Nutrient Type

  • Nitrogenous Fertilizers
  • Phosphatic Fertilizers
  • Potassic Fertilizers
  • NPK Complex Fertilizers
  • Secondary and Micronutrient Fertilizers

By Formulation Technology

  • Conventional Granular
  • Coated and Controlled-Release Granular
  • Slow-Release Granular

By Crop Application

  • Cereals and Grains
  • Oilseeds and Pulses
  • Fruits and Vegetables
  • Turf and Ornamental
  • Other Crops

By Distribution Channel

  • Cooperative and direct sales
  • Retail and dealer
  • Online

Conclusion & Recommendations

The long-term outlook remains steadily expansionary, with revenue projected to grow from USD 115.15 Billion in 2026 to USD 188.76 Billion by 2035 at a 5.65% CAGR. Our analysis shows that this trajectory is underpinned by structural food-demand growth and rising controlled-release formulation adoption rather than cyclical commodity price movements alone.

What Strategic Positioning Should Companies Pursue?

Companies should prioritize controlled-release coating technology and micronutrient fortification capability over conventional single-nutrient product lines alone. We found that producers combining feedstock cost advantage with formulation technology differentiation sustain more resilient margins than competitors reliant on commodity granular products alone.

How Attractive Is the Market for Investment?

Investment attractiveness is high given double-digit growth in secondary and micronutrient categories alongside a large, stable base of nitrogenous and phosphatic demand in mature markets. Our assessment indicates that capital allocators should weight exposure toward producers with proven controlled-release technology and domestic capacity expansion over commodity-only competitors facing feedstock price exposure.

What Market Shifts and Key Risks Should Stakeholders Monitor?

Key risks include volatile natural gas and mineral feedstock pricing, tightening nutrient runoff regulation, and farmer adoption barriers to higher-cost coated formulations. We observed that feedstock price volatility poses the most immediate risk to nitrogenous fertilizer producer margins given the direct link between natural gas costs and ammonia synthesis economics.

What Are the Primary Growth Pathways Through 2035?

Primary growth pathways include affordable coated formulations for emerging-market adoption, precision-calibrated micronutrient blends for specialty crops, and domestic capacity expansion reducing import dependency risk. Our findings suggest that companies combining all three pathways will outpace single-lever competitors through the forecast period.

FAQs

About the Author

Liza Phukan

Liza Phukan

Liza Phukan is Research Associate at Next Move Strategy Consulting, where she has covered emerging industries and market research across sectors for 3.5 years. Her work includes analyzing industry developments, validating market data, and developing structured business content from research findings. She uses secondary research and data-validation practices to turn complex market information into clear decision-useful market analysis for business audiences and support report development and B2B.

About the Reviewer

Supradip Baul

Supradip Baul

Supradip Baul is an accomplished business consultant and strategist with over a decade of rich experience in market intelligence, strategy, technology, and business transformation. His work has included rigorous qualitative and quantitative analysis across multiple industries, helping clients shape investment decisions and long-term roadmaps. Earlier in his career, he was associated with Gartner, where he contributed to industry-leading reports and market share analyses. He has worked with leading global companies and holds an MBA with a dual specialization in Marketing and Finance.

Download Free Sample

Pratyush Kumar Das

PRATYUSH KUMAR DAS

Assistant Manager

Polycab India Limited

We would like to express our appreciation for the data and insights provided by nextmsc. We are very pleased with the quality and depth of the information, which has proven to be highly valuable and beneficial for our business decision-making.

Henri Knyphausen

HENRI KNYPHAUSEN

Partner at Singulier [Ex-BCG]

Singulier

I recently engaged NEXTMSC.com for a commercial due diligence project within the intralogistics sector, and I am pleased to provide a reference based on my experience. In utilizing NEXTMSC.com's services, I found their report to offer valuable insights into market dynamics and key industry players. The initial report provided a solid foundation for our analysis. However, as we were investigating a smaller target in the market, and I had specific customization requests requiring additional research. These requests included detailed information on product portfolios of various players and sub-market sizes, both inclusive and exclusive of certain product categories. NEXTMSC.com demonstrated commendable responsiveness and agility in accommodating these customization requests. Within a timeframe of 1-2 weeks, they delivered a revised report that met our specific needs. Furthermore, they were receptive to my follow-up inquiries, ensuring clarity and understanding of the data provided. The final deliverable significantly contributed to our due diligence efforts. One of NEXTMSC.com's notable strengths lies in their qualitative research capabilities. However, for future engagements, I would recommend the inclusion of a quantified market model in Excel format. Such a model would offer the ability to conduct in-depth analyses and explore various market segments, including country-specific data and subcomponent breakdowns. Based on my positive experience, I would not hesitate to work with NEXTMSC.com again. Their responsiveness, willingness to accommodate customization requests, and commitment to delivering actionable insights make them a reliable partner for commercial research projects.

Semih Kavaklioglu

SEMIH KAVAKLIOGLU

Co-Founder & Sales Manager

Decortie

I work a lot in the marketing industry and I know that research is an essential part of any campaign. I have used Market research reports for my own products and I found them to be very informative and well-researched. The team here produces insightful reports for a good price

Kevin Coker

KEVIN COKER

Founder, CEO and Board Diector

Proxima Clinical Research

I have been using Next MSC reports for product positioning in a new geography for a long time. They have by far the best reports I have found and the price is reasonable too!

Nishant Awate

NISHANT AWATE

Business Development Global Sales

Zehnder Group Deutschland GmbH

Our experience working with Next Move Strategy Consulting was positive. The team was responsive, professional, and open to incorporating our specific requirements throughout the project. The India AHU market study was comprehensive and well structured, covering market value and volume forecasts, product and application segments, and key industry trends. The inclusion of both AHU and residential MVHR market insights made the study particularly relevant for our strategic market assessment. Overall, the report provides a solid foundation for evaluating market potential, identifying priority segments, and supporting business-development decisions in India.

Custom Market Research Services

We will customize the research for you if the listed report does not fully match your requirements.

Get 30% Free Customization

Select License

This website uses cookies to ensure you get the best experience on our website. Learn more

✖