Graph Analytics for CX Market

Graph analytics for CX market size was USD 1.18 bn in 2025, projected to reach USD 6.85 bn by 2035 at a 19.1% CAGR from 2026 to 2035, per this market report.

Download Free Sample PDF
Base Year (2025)
$1.18 Billion
Forecast (2035)
$6.85 Billion
CAGR (2026-2035)
19.1%
Top Region
North America

What Is the Graph Analytics for CX Market Size?

The global Graph Analytics for CX Market size was valued at USD 1.18 billion in 2025 and is estimated at USD 1.42 billion in 2026, forecast to reach USD 6.85 billion by 2035, expanding at a 19.1% CAGR between 2026 and 2035. North America leads with approximately 46% share, while Customer 360 and Journey Mapping dominate all other applications with approximately 32% share.

We observed that the growth is broad-based across every segmentation axis, with personalization engine adoption and small and medium enterprise uptake driving the dominant structural shifts through 2035.

Graph Analytics for CX Market Revenue Forecast

Values in USD Billion

2025 $1.18 Billion
2025
2026 $1.41 Billion
2026
2027 $1.67 Billion
2027
2028 $1.99 Billion
2028
2029 $2.37 Billion
2029
2030 $2.83 Billion
2030
2031 $3.37 Billion
2031
2032 $4.01 Billion
2032
2033 $4.78 Billion
2033
2034 $5.69 Billion
2034
2035 $6.85 Billion
2035

Key Takeaways

By Application: Customer 360 and Journey Mapping held the largest share of approximately 32% (USD 0.38 billion) in 2025; Personalization and Recommendation Engines is the fastest-growing sub-segment at 20.1% CAGR from 2026-2035.

By End User Industry: BFSI held the largest share of approximately 28% (USD 0.33 billion) in 2025; Media and Entertainment is the fastest-growing sub-segment at 21.2% CAGR from 2026-2035.

By Organization Size: Large Enterprises held the largest share of approximately 74% (USD 0.87 billion) in 2025; Small and Medium Enterprises is the fastest-growing sub-segment at 23.9% CAGR from 2026-2035.

Dominant Region: North America dominated with approximately 46% revenue share (USD 0.54 billion) in 2025.

Fastest-Growing Region: Asia-Pacific is expected to register the highest CAGR of 24.1% during 2026-2035.

Dominant Country: U.S. led with approximately USD 0.45 billion in 2025.

Fastest-Growing Country: India is the fastest-growing country at approximately 31.0% CAGR from 2026-2035.

Market Opportunity: The graph analytics for CX market is expected to create an absolute dollar opportunity of USD 5.43 billion between 2026 and 2035, presenting significant investment potential across the customer graph and real-time personalization value chain.

According to Next Move Strategy Consulting analysis, enterprises are increasingly bridging graph databases with generative AI retrieval pipelines to ground large language model outputs in verified customer relationship data, a shift that favors vendors with mature knowledge-graph tooling over generalist analytics platforms as organizations seek more accurate, explainable AI-driven customer experience recommendations through 2035.

What Does the Graph Analytics for CX Market Encompass?

The graph analytics for CX market encompasses graph database platforms, analytics tools, and services that model and query customer relationships as interconnected networks rather than isolated records. Our assessment indicates that the scope spans customer 360 and journey mapping, personalization and recommendation engines, churn prediction, and CX-focused fraud detection, distributed to BFSI, retail, telecom, and media buyers of varying organization size. The category has evolved from niche relationship-mapping technology into core infrastructure for real-time personalization, closely intersecting with the broader customer journey analytics software ecosystem worldwide.
Regulatory frameworks such as the European Union's General Data Protection Regulation and sector-specific data-privacy requirements shape customer graph architecture, while generative AI adoption increasingly influences technology sourcing decisions. We observed that technology adoption is shifting toward customer graphs that unify people, products, support tickets, and behavioral data into a single queryable model. Next Move Strategy Consulting's analysis indicates that this structural shift, combined with rising demand for explainable AI-driven personalization, is redefining sourcing criteria across the market.

CONSUMER BEHAVIOR ANALYSIS OF THE GRAPH ANALYTICS FOR CX MARKET

CONSUMER BEHAVIOR ANALYSIS OF THE GRAPH ANALYTICS FOR CX MARKET

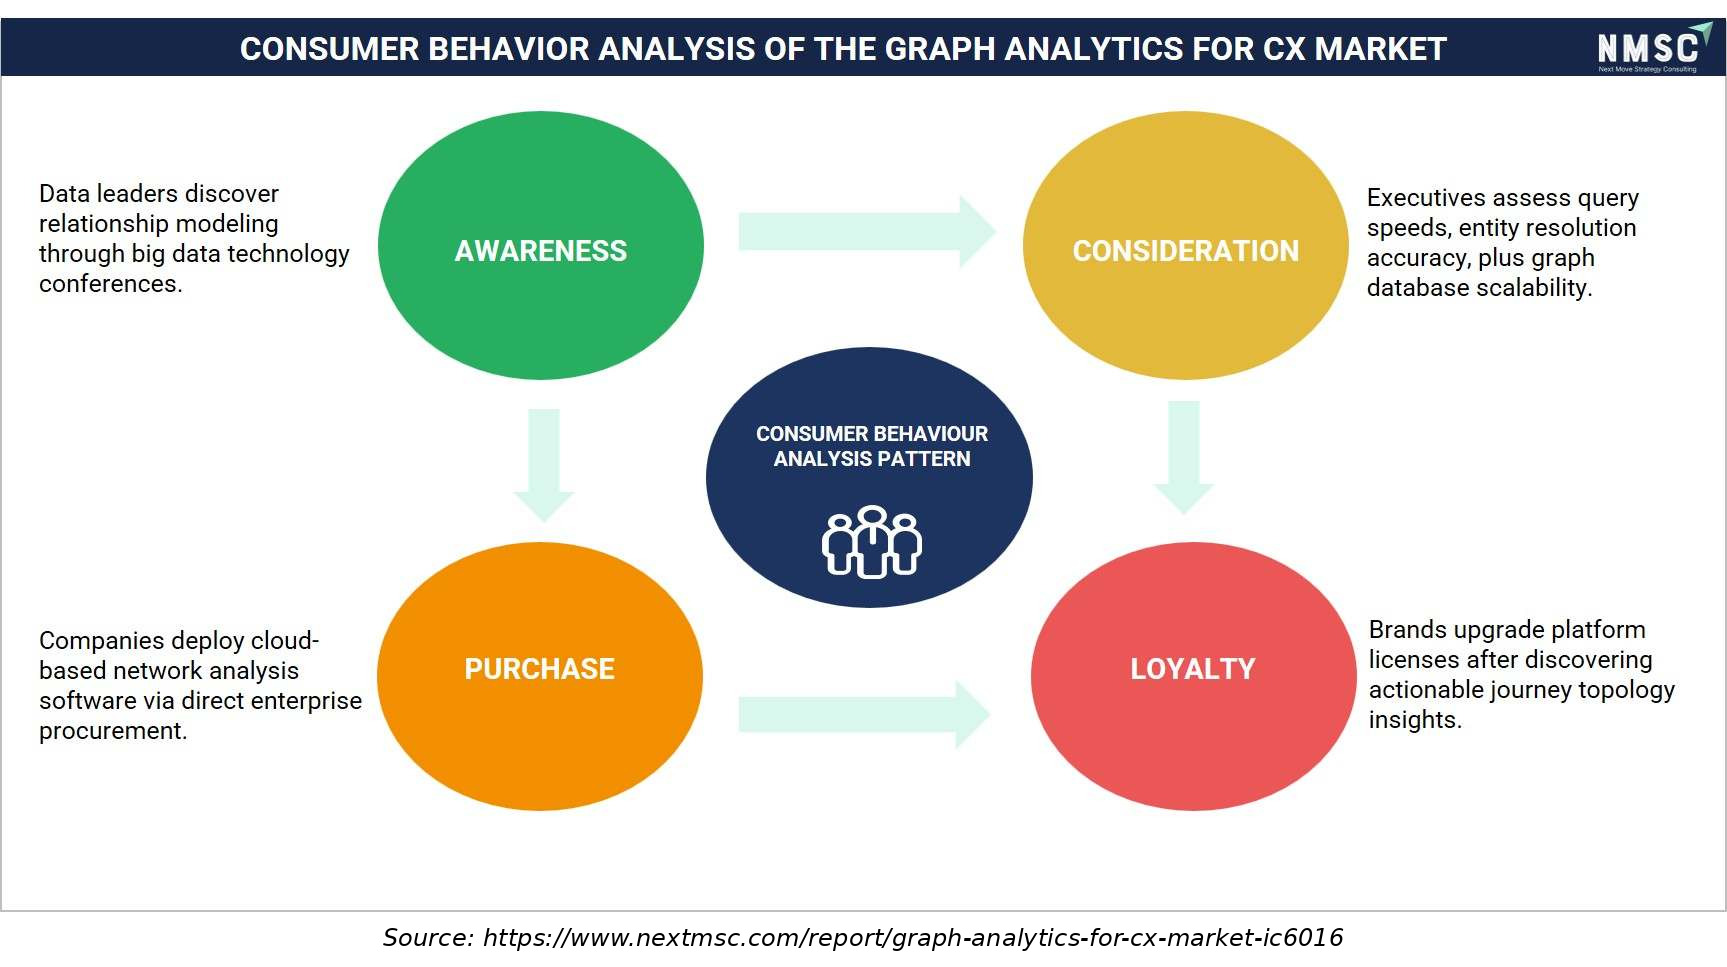
This consumer behavior analysis illustrates the purchase journey for the market, progressing from awareness to consideration, purchase, and loyalty. Data leaders initially discover relationship modeling through technology conferences, while executives evaluate query performance, entity resolution, and scalability. Companies then adopt cloud-based graph analytics through enterprise procurement, with successful deployments encouraging platform upgrades as organizations identify actionable customer journey and relationship insights.

Market Drivers & Dynamics

Interactive Dataset
Rising enterprise demand for real-time personalization driver +3.8% Global 2026-2035
Expanding generative AI and GraphRAG adoption driver +3.2% North America, Europe 2026-2035
Growing fraud detection requirements in digital CX driver +2.4% Global 2026-2035
Increasing customer data platform modernization investment driver +1.7% Global 2026-2032
Rising churn-prevention priority amid competitive markets driver +1.2% Global 2026-2035
Data-privacy regulation complexity for connected customer data restraint -1.3% Europe, North America 2026-2032
Specialized graph query skills shortage among enterprise teams restraint -1.0% Global 2026-2032
Migration complexity from legacy relational CX systems restraint -0.7% Global 2026-2030
Source: Next Move Strategy Consulting

Growth Drivers

What Is the Primary Growth Driver of the Graph Analytics for CX Market?

Rising enterprise demand for real-time personalization is the primary driver of the market. The U.S. Federal Trade Commission continues to monitor data-driven personalization practices, reflecting the scale of enterprise investment in connected customer data infrastructure nationwide. We observed that this personalization demand, reinforced by expanding generative AI adoption, continues to anchor baseline consumption of customer graph and journey-mapping platforms across developed and emerging economies alike.

How Is Generative AI Adoption Driving Market Growth?

Expanding generative AI and GraphRAG adoption is accelerating market growth toward graph-grounded retrieval architectures. The U.S. National Institute of Standards and Technology continue to publish AI risk management guidance emphasizing the need for verifiable, explainable AI outputs in customer-facing applications. Our assessment indicates that this guidance, combined with rising enterprise AI deployment, is compressing adoption timelines for graph-based retrieval infrastructure among organizations building AI-driven customer experience tools.

Growth Inhibitors

What Is Restraining Graph Analytics for CX Market Expansion?

Data-privacy regulation complexity restrains cross-border scalability across the graph analytics for CX supply chain. The European Commission continues to enforce General Data Protection Regulation requirements governing connected personal data processing, which compresses vendors' ability to deploy uniform customer graph architectures across jurisdictions. We found that smaller regional vendors face particular exposure, as limited compliance resources reduce their ability to navigate multi-jurisdiction privacy requirements compared with larger, globally compliant platform operators.

What Are the Growth Opportunities?

How Can GraphRAG Platforms Unlock Value for Enterprise AI Teams?

GraphRAG-native platforms present a whitespace opportunity for vendors seeking to address generative AI accuracy concerns in customer-facing applications. Vendors that commercialize validated, low-hallucination retrieval architectures stand to capture recurring platform-license revenue as enterprises across retail and BFSI sectors shift toward AI-augmented, explainable customer interaction systems.

Where Does Managed Cloud Graph Service Create New Demand?

Managed cloud graph database services represent an underpenetrated opportunity for vendors engineered to serve small and medium enterprise buyers priced out of self-managed infrastructure. Providers that develop validated, low-maintenance managed offerings can secure long-term subscription contracts, benefiting from recurring revenue tied to expanding small and medium enterprise adoption of connected customer data platforms.

How Can Fraud-CX Convergence Benefit Financial Services Buyers?

Financial institutions seeking to balance fraud prevention with customer experience friction create an opportunity for vendors combining real-time graph traversal with customer experience management capability. Early movers that unify fraud detection and personalization on a single graph platform can differentiate with BFSI buyers pursuing reduced false-positive rates without compromising security.

Segmentation Analysis

2025 (USD Billion)
2035 (USD Billion)
Customer 360 and Journey Mapping 2025: $0.38 Billion | 2035: $1.99 Billion
Customer 360
Personalization and Recommendation Engines 2025: $0.31 Billion | 2035: $1.92 Billion
Personalizat
Churn Prediction and Retention Analytics 2025: $0.19 Billion | 2035: $1.17 Billion
Churn Predic
Fraud and Anomaly Detection in CX 2025: $0.18 Billion | 2035: $1.10 Billion
Fraud and An
Sentiment and Social Network Analysis 2025: $0.13 Billion | 2035: $0.69 Billion
Sentiment an
Customer 360 and Journey Mapping $0.38 Billion $1.99 Billion 17.8%
Personalization and Recommendation Engines $0.31 Billion $1.92 Billion 20.1%
Churn Prediction and Retention Analytics $0.19 Billion $1.17 Billion 19.9%
Fraud and Anomaly Detection in CX $0.18 Billion $1.10 Billion 20.0%
Sentiment and Social Network Analysis $0.13 Billion $0.69 Billion 17.9%

Which Application Segment Dominates the Graph Analytics for CX Market?

Customer 360 and Journey Mapping led the market with USD 0.38 billion in 2025, supported by near-universal enterprise need to unify fragmented customer data sources into a single relationship model. We observed that Personalization and Recommendation Engines is the fastest-growing application, expanding at a 20.1% CAGR from 2026 to 2035, as retailers and media platforms increasingly deploy graph-powered recommendation systems to improve conversion and engagement metrics.

2025 (USD Billion)
2035 (USD Billion)
BFSI
Retail and E
Telecom
Media and En
Healthcare
Segment Item 2025 (USD Billion) 2035 (USD Billion) CAGR
BFSI $10.0 USD Billion $40.0 USD Billion 20.0%
Retail and E-commerce $17.1 USD Billion $51.1 USD Billion 26.0%
Telecom $24.2 USD Billion $62.2 USD Billion 24.0%
Media and Entertainment $31.3 USD Billion $73.3 USD Billion 26.0%
Healthcare $38.4 USD Billion $84.4 USD Billion 9.0%

Segment-wise data is locked

Unlock complete segment-wise numbers for By End User Industry.

Unlock Full Data

Which End User Industry Generates the Most Graph Analytics for CX Revenue?

BFSI remained the leading end user industry, valued at USD 0.33 billion in 2025 as financial institutions maintain sustained investment tied to fraud detection and prevention and regulatory compliance obligations. Based on research conducted by Next Move Strategy Consulting, we found that Media and Entertainment is the fastest-growing end user industry at a 21.2% CAGR from 2026 to 2035, reflecting expanding graph-powered content recommendation adoption among streaming and digital media platforms.

2025 (USD Billion)
2035 (USD Billion)
Large Enterp
Small and Me
Segment Item 2025 (USD Billion) 2035 (USD Billion) CAGR
Large Enterprises $10.0 USD Billion $40.0 USD Billion 10.0%
Small and Medium Enterprises $17.1 USD Billion $51.1 USD Billion 24.0%

Segment-wise data is locked

Unlock complete segment-wise numbers for By Organization Size.

Unlock Full Data

Which Organization Size Segment Leads Graph Analytics for CX Adoption?

Large Enterprises remained the leading organization size segment, valued at USD 0.87 billion in 2025 on sustained platform procurement tied to complex, multi-source customer data environments. Our findings suggest that Small and Medium Enterprises is the fastest-growing segment, registering a 23.9% CAGR from 2026 to 2035, as managed cloud graph database services expand access to smaller organizations previously unable to justify dedicated graph infrastructure investment.

Growth Opportunities

Our analysis shows that three forward-looking opportunities stand out for stakeholders positioning within the graph analytics for CX market over the 2026-2035 forecast period.

How Can GraphRAG Platforms Unlock Value for Enterprise AI Teams?

GraphRAG-native platforms present a whitespace opportunity for vendors seeking to address generative AI accuracy concerns in customer-facing applications. Vendors that commercialize validated, low-hallucination retrieval architectures stand to capture recurring platform-license revenue as enterprises across retail and BFSI sectors shift toward AI-augmented, explainable customer interaction systems.

Where Does Managed Cloud Graph Service Create New Demand?

Managed cloud graph database services represent an underpenetrated opportunity for vendors engineered to serve small and medium enterprise buyers priced out of self-managed infrastructure. Providers that develop validated, low-maintenance managed offerings can secure long-term subscription contracts, benefiting from recurring revenue tied to expanding small and medium enterprise adoption of connected customer data platforms.

How Can Fraud-CX Convergence Benefit Financial Services Buyers?

Financial institutions seeking to balance fraud prevention with customer experience friction create an opportunity for vendors combining real-time graph traversal with customer experience management capability. Early movers that unify fraud detection and personalization on a single graph platform can differentiate with BFSI buyers pursuing reduced false-positive rates without compromising security.

ECOSYSTEM ANALYSIS OF THE GRAPH ANALYTICS FOR CX MARKET

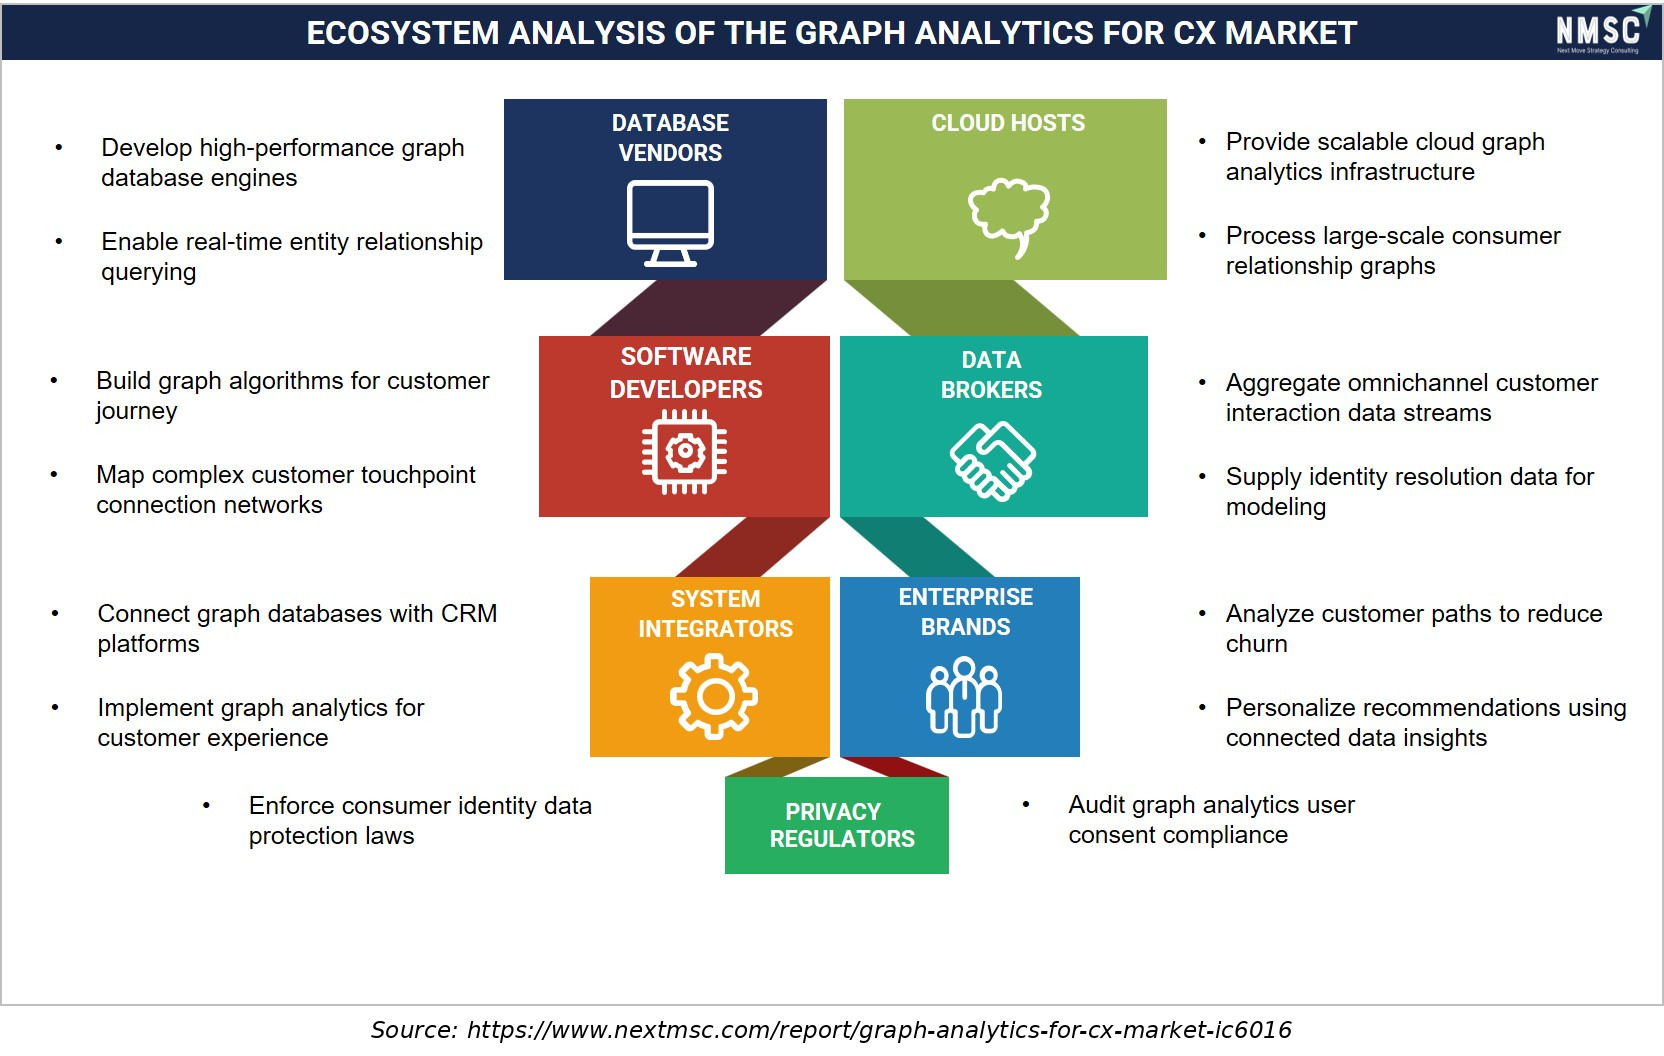
The ecosystem analysis illustrates the interconnected stakeholders supporting the market. Database vendors and cloud hosts provide core infrastructure, while software developers and data brokers enable data processing and integration. System integrators connect these technologies with enterprise brands, which deploy graph analytics for customer experience applications. Privacy regulators provide oversight, ensuring customer data usage, security, and analytics practices comply with evolving regulatory requirements.

Regional Outlook

2025 (USD Billion)
2035 (USD Billion)
North Americ
Europe
Asia-Pacific
Middle East
Latin Americ
Region 2025 (USD Billion) 2035 (USD Billion) CAGR (%)
North America $10.0 USD Billion $40.0 USD Billion 9.0%
Europe $17.1 USD Billion $51.1 USD Billion 27.0%
Asia-Pacific $24.2 USD Billion $62.2 USD Billion 25.0%
Middle East & Africa $31.3 USD Billion $73.3 USD Billion 23.0%
Latin America $38.4 USD Billion $84.4 USD Billion 12.0%

Regional data is locked

Unlock complete regional numbers for this market.

Unlock Full Data

Competitive Landscape

We observed that the graph analytics for CX market remains moderately concentrated, with dedicated graph database specialists, cloud hyperscalers, and diversified enterprise software vendors competing across overlapping segments of the value chain.

Dimension Description
Market Structure Moderately concentrated among top 10 graph database and analytics providers, with a long tail of specialized visualization and consulting vendors
Innovation Focus GraphRAG for generative AI, real-time fraud detection, and multi-hop customer relationship traversal
Strategic Partnerships & Platform Expansion Strategic partnerships bridging graph databases with cloud data platforms and AI infrastructure providers

How Do Companies Compete in the Graph Analytics for CX Market?

Companies compete primarily on query performance at scale, ecosystem maturity, and generative AI integration depth within the graph analytics for CX market. We observed that vendors with mature developer ecosystems and extensive documentation can convert new adopters more effectively than newer entrants lacking comparable tooling. Real-time traversal speed and cloud-managed service reliability increasingly differentiate bids in enterprise procurement, alongside proven customer references at scale for buyers seeking production-grade reliability.

Which Competitive Archetypes Dominate the Graph Analytics for CX Industry?

Two archetypes dominate the graph analytics for CX industry: developer-focused graph database pioneers with broad ecosystem adoption, and performance-focused enterprise analytics platforms built for massive parallel processing at scale. We found that the first group competes primarily on developer ergonomics and community size, while the second differentiates through raw query performance on large, densely connected datasets, securing recurring licensing revenue from enterprises with the most demanding real-time fraud and personalization workloads.

What Innovation and Differentiation Strategies Define Market Leaders?

Market leaders differentiate through GraphRAG capability, managed cloud service breadth, and integration with adjacent customer relationship management (CRM) platforms for buyers managing converging customer data and AI infrastructure needs. Our analysis shows that companies investing in native generative AI retrieval capability are positioning to capture premium enterprise accounts, while managed cloud deployment increasingly forms a core part of competitive bids across mid-market customer experience tenders.

How Active Is M&A in the Graph Analytics for CX Market?

M&A and strategic partnership activity remains active as graph database vendors pursue integration with cloud data platforms and AI infrastructure providers. We found that TigerGraph's continued expansion of enterprise customer relationships across BFSI and retail sectors reflects sustained competitive intensity in the category, while cloud hyperscalers deepen native graph service offerings to capture broader platform-consolidation demand from existing cloud customers.

Key Market Players

We observed that the following 16 companies represent the leading verified participants shaping the competitive structure of the graph analytics for CX market.

Neo4j, Inc. TigerGraph, Inc. Amazon.com, Inc. (Amazon Neptune) Microsoft Corporation (Azure Cosmos DB) Oracle Corporation Alphabet Inc. (Google Cloud Spanner Graph) International Business Machines Corporation (IBM) SAP SE ArangoDB GmbH Memgraph Ltd. RelationalAI, Inc. Franz Inc. Ontotext AD Stardog Union DataStax, Inc. Vesoft Inc. (NebulaGraph)

Latest Developments

Our assessment indicates that recent corporate activity reflects continued platform innovation and generative AI integration across the graph analytics for CX market.

Date Event
May 2026 Franz announced AllegroGraph 9.0 with GraphTalker, an AI agent that enables natural-language exploration, querying, reasoning, and reusable workflows over enterprise knowledge graphs. The agent iteratively examines schemas, tests queries, and refines answers, combining graph analytics with conversational AI for enterprise intelligence applications.
January 2026 AWS expanded Neptune Analytics into seven additional regions, including Seoul, Osaka, Hong Kong, Stockholm, Paris, São Paulo, and Northern California. The service supports advanced graph analytics, large-scale relationship analysis, and GraphRAG capabilities, broadening geographic access to managed graph workloads for globally distributed enterprises.
September 2025 AWS launched Neptune Analytics in the Asia Pacific (Mumbai) Region, enabling customers in India to create and manage graph analytics workloads locally. The service provides in-memory graph processing, optimized algorithms, low-latency queries, and vector search over graph data for exploratory and analytical workloads.

Investment Opportunities

Where Are Capital Inflows Concentrated in the Graph Analytics for CX Market?

Capital inflows are concentrated in GraphRAG-native platform development and real-time fraud detection capability. We observed that strategic investors and enterprise software vendors are increasingly funding graph database specialists to strengthen generative AI retrieval accuracy, reflecting growing investor confidence in graph analytics as foundational infrastructure for AI-driven customer experience rather than a narrow analytics niche.

How Significant Is Infrastructure Investment in Graph Analytics for CX Platforms?

Infrastructure investment in managed cloud graph services and large-scale parallel processing capability is accelerating as vendors compete on query performance at enterprise scale. Our findings suggest that cloud hyperscalers are expanding native graph service offerings to capture platform-consolidation demand, with several providers investing in dedicated graph-optimized infrastructure to reduce latency for real-time personalization and fraud detection workloads.

What ESG Considerations Shape Graph Analytics for CX Investment?

Environmental, social, and governance considerations increasingly shape investment decisions, with investors favoring vendors that demonstrate responsible data governance and transparent AI model behavior. We observed that customer data minimization and privacy-by-design architecture are drawing heightened institutional investor scrutiny, reflecting growing attention to responsible connected-data practices across the enterprise software value chain.

Key Benefits for Stakeholders

How Does This Report Benefit Enterprise and Industry Leaders?

Enterprise and industry leaders gain access to segment-level revenue forecasts and application-adoption trends that inform platform procurement strategy. Our analysis shows that the report's regional breakdowns support market-entry and vendor-selection decisions, helping stakeholders align investment with the fastest-growing applications and end-user industries through 2035.

How Does This Report Benefit Investors and Financial Analysts?

Investors and financial analysts benefit from consolidated market-sizing data, competitive-landscape mapping, and CAGR-level growth drivers that support valuation and due-diligence work. We found that the report's country-level forecasts help identify markets with the strongest risk-adjusted return profiles, particularly across the fastest-growing Asia-Pacific and Middle East & Africa regions.

How Does This Report Benefit Technology Vendors and Product Teams?

Technology vendors and product teams gain segmentation-level insight into application, end-user industry, and organization size preferences that inform roadmap prioritization. Our assessment indicates that the report's trend analysis highlights GraphRAG capability as a high-growth adjacency, helping product teams align development resources with the fastest-growing sub-segments identified in this market report.

Key Market Segments Evaluated

By Application

  • Customer 360 and Journey Mapping
  • Personalization and Recommendation Engines
  • Churn Prediction and Retention Analytics
  • Fraud and Anomaly Detection in CX
  • Sentiment and Social Network Analysis

By End User Industry

  • BFSI
  • Retail and E-commerce
  • Telecom
  • Media and Entertainment
  • Healthcare
  • Travel and Hospitality

By Organization Size

  • Large Enterprises
  • Small and Medium Enterprises

By Region

  • North America 
    • U.S.
    • Canada
    • Mexico
  • Europe 
    • UK
    • Germany
    • France
    • Italy
    • Spain
    • Sweden
    • Denmark
    • Finland
    • Netherlands
    • Rest of Europe
  • Asia-Pacific 
    • China
    • India
    • Japan
    • South Korea
    • Taiwan
    • Indonesia
    • Vietnam
    • Australia
    • Philippines
    • Malaysia
    • Rest of APAC
  • Middle East & Africa 
    • Saudi Arabia
    • UAE
    • Egypt
    • Israel
    • Turkey
    • Nigeria
    • South Africa
    • Rest of MEA
  • Latin America 
    • Brazil
    • Argentina
    • Chile
    • Colombia
    • Rest of LATAM

Conclusion & Recommendations

The long-term outlook remains strongly positive, with the market projected to grow nearly fivefold from USD 1.42 billion in 2026 to USD 6.85 billion by 2035. We observed that this trajectory is underpinned by structural generative AI adoption and real-time personalization demand rather than a narrow analytics niche alone, positioning graph analytics for CX as foundational customer experience infrastructure through 2035 and beyond.

What Strategic Positioning Should Stakeholders Pursue?

Stakeholders should pursue platform-consolidated positioning that combines customer graph modeling, real-time fraud detection, and GraphRAG-native AI retrieval within a single deployment model. Our analysis shows that vendors investing early in managed cloud service breadth and generative AI integration, spanning BFSI, retail, and media applications, will be best positioned to capture premium enterprise contract awards within the graph analytics for CX market.

How Attractive Is the Graph Analytics for CX Market for New Investment?

The graph analytics for CX industry presents a highly attractive investment case, supported by a USD 5.43 billion absolute dollar opportunity between 2026 and 2035 and above-average growth in Asia-Pacific and Middle East & Africa. We found that investment attractiveness is highest for platforms combining query performance with AI-native differentiation, positioning them to serve both cost-sensitive small and medium enterprise buyers and premium enterprise segments simultaneously.

What Market Shifts and Key Risks Should Stakeholders Monitor?

Stakeholders should monitor data-privacy regulation complexity, specialized graph query skills shortages, and legacy system migration friction as key risks to the graph analytics for CX market. Our analysis shows that vendors unable to simplify migration from legacy relational customer data systems risk losing enterprise contracts to competitors with proven, low-friction onboarding, particularly as adoption accelerates across regulated financial and telecom channels through 2035.

What Are the Key Growth Pathways for the Graph Analytics for CX Market?

Key growth pathways include expanding GraphRAG-native AI capability, scaling managed cloud graph services, and deepening penetration into small and medium enterprise buyer segments. Next Move Strategy Consulting's analysis indicates that vendors pursuing these pathways while maintaining query performance in core customer 360 and personalization categories will be best positioned to capture the graph analytics for CX market's projected growth through 2035.

FAQs

About the Author

Liza Phukan

Liza Phukan

Liza Phukan is Research Associate at Next Move Strategy Consulting, where she has covered emerging industries and market research across sectors for 3.5 years. Her work includes analyzing industry developments, validating market data, and developing structured business content from research findings. She uses secondary research and data-validation practices to turn complex market information into clear decision-useful market analysis for business audiences and support report development and B2B.

About the Reviewer

Supradip Baul

Supradip Baul

Supradip Baul is an accomplished business consultant and strategist with over a decade of rich experience in market intelligence, strategy, technology, and business transformation. His work has included rigorous qualitative and quantitative analysis across multiple industries, helping clients shape investment decisions and long-term roadmaps. Earlier in his career, he was associated with Gartner, where he contributed to industry-leading reports and market share analyses. He has worked with leading global companies and holds an MBA with a dual specialization in Marketing and Finance.

Download Free Sample

Rishabh Jogani

RISHABH JOGANI

Strategy Analyst

Accenture Japan

We are incredibly impressed with the market report on the real estate market in India provided by Next Move Strategy Consulting. The report was thorough, insightful, and well-structured, offering deep analysis and actionable recommendations. It not only captured the current trends and dynamics but also provided a forward-looking perspective that has been invaluable for our strategic planning. Their team demonstrated exceptional professionalism, attention to detail, and a profound understanding of the industry. The data-driven insights and clarity of presentation exceeded our expectations, making complex market trends easy to understand. We highly recommend Next Move Strategy Consulting to anyone looking for reliable and comprehensive market research services. Their expertise has given us the confidence to navigate the complexities of the Indian real estate market with clarity and foresight.

Semih Kavaklioglu

SEMIH KAVAKLIOGLU

Co-Founder & Sales Manager

Decortie

I work a lot in the marketing industry and I know that research is an essential part of any campaign. I have used Market research reports for my own products and I found them to be very informative and well-researched. The team here produces insightful reports for a good price

Ross J Mckenzie

ROSS J MCKENZIE

Business Insight Manager

Staysure Group

“Next MSC have been incredibly helpful in providing detailed & robust information on our market, alongside quantifying growth by different segments. The process to procure was simple and easy, with sample reports and regular contact to ensure we had what we needed. Succinct detail on their sources & methodologies is also greatly received, allowing transparency in this respect helps build trust in the detail you pay for. Joseph in particular was fantastic, and helped ensure efficient provision of the insight pack – thank you NMSC!”.

Melanie Samko

MELANIE SAMKO

Director of Marketing

TOSOH BIOSCIENCE, INC.

The information provided by NMSC is incredibly valuable, thank you so much for such a excellent work. I really appreciate it. I will make sure to reference all of it, in my summary document.

Gaurav Jaiswal

GAURAV JAISWAL

Founder & CEO

Yano Charge Private Limited

The EV Charging market research report provided by the NextMSC was exceptionally detailed and insightful. It offered a comprehensive analysis that proved to be a game-changer for our strategic planning. Truly a testament to the NextMSC’s expertise and thoroughness in EV market landscape & analysis.

Custom Market Research Services

We will customize the research for you if the listed report does not fully match your requirements.

Get 30% Free Customization

Select License

This website uses cookies to ensure you get the best experience on our website. Learn more

✖