North America Smart Furniture Market By Product Type (Smart Tables & Desks, Smart Stools & Benches, Smart Chairs and Smart Bed), By Distribution Channel [B2C/Retail (Big‑box/Home Centres, Specialty Furniture Stores and E‑commerce), and Contract (B2B Projects & Fit‑Outs)], By End-User (Residential, Commercial) – Opportunity Analysis & Forecast, 2025–2030
Industry: Retail and Consumer | Lastest Edition: June 1, 2026 | No of Pages: 152 | No. of Tables: 114 | No. of Figures: 59 | Format: PDF | Report Code : RC1134
Industry Outlook
The North America Smart Furniture Market size was valued at USD 271.74 million in 2024 and is expected to reach USD 314.94 million by 2025. Furthermore, the market is projected to reach USD 553.76 million by 2030, growing at a CAGR of 11.95% from 2025 to 2030.
The market is witnessing strong growth driven by the rapid adoption of smart home technologies and the rise of remote work and home office setups. Households are increasingly integrating connected devices such as smart lighting, climate control, security systems, and voice assistants, fueling demand for furniture that enhances convenience, energy efficiency, and lifestyle comfort. Simultaneously, the shift to hybrid work models is boosting adoption of ergonomic, multifunctional, and IoT-enabled home office furniture that improves productivity and health. However, high costs of technologically advanced furniture, along with maintenance requirements and compatibility concerns, remain key restraints, limiting mass adoption among middle-income consumers. Despite these challenges, growing consumer awareness, urban tech adoption, and the demand for connected, multifunctional furniture continue to provide strong opportunities for innovation and market expansion across the U.S. and Canada.
High Adoption of Smart Home Technologies Drives the North America Smart Furniture Market Growth
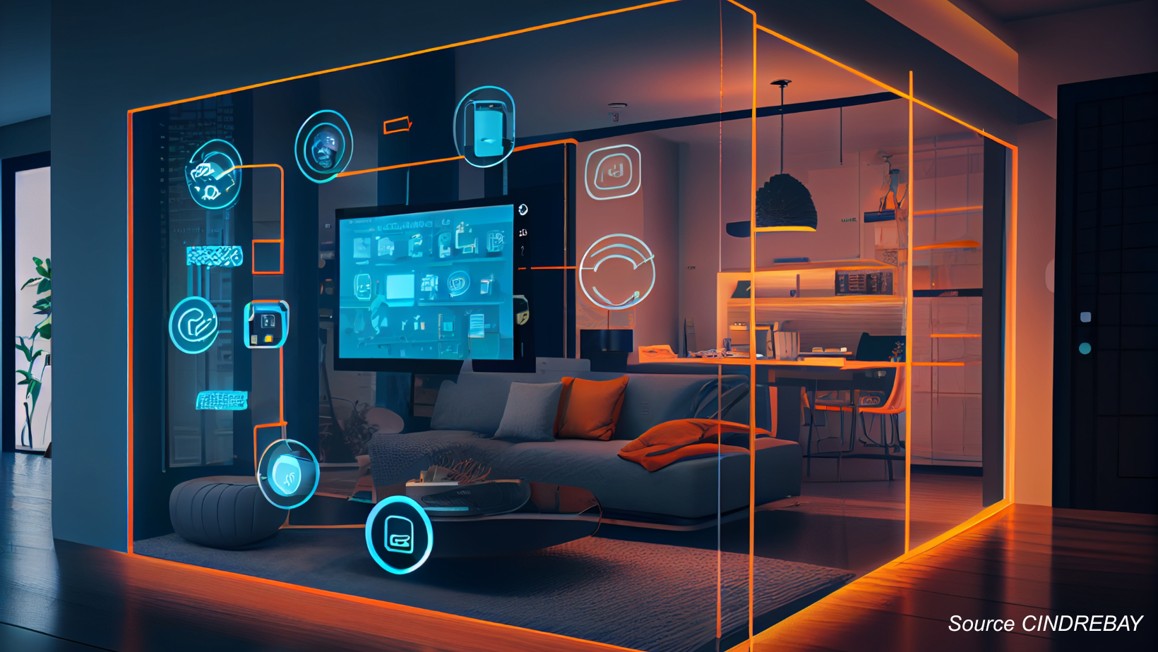
The rapid adoption of smart home technologies is a major driver of the smart furniture market in North America. Households are increasingly integrating connected devices such as smart lighting, automated climate control, home security systems, and voice-activated assistants, creating a strong demand for furniture that seamlessly interacts with these technologies. Smart furniture equipped with wireless charging ports, motion sensors, app-controlled functionalities, and ergonomic designs enhances convenience, energy efficiency, and lifestyle comfort. Urban and suburban households in the U.S. and Canada, especially in tech-forward cities like San Francisco, Toronto, and Seattle, are embracing connected living solutions, encouraging manufacturers to develop innovative, multifunctional products tailored to smart homes. This growing ecosystem of smart devices is not only driving consumer interest but also providing opportunities for continuous innovation, thereby significantly boosting market growth in the region.
Growing Remote Work and Home Office Setups Fuels the North America Smart Furniture Market Expansion
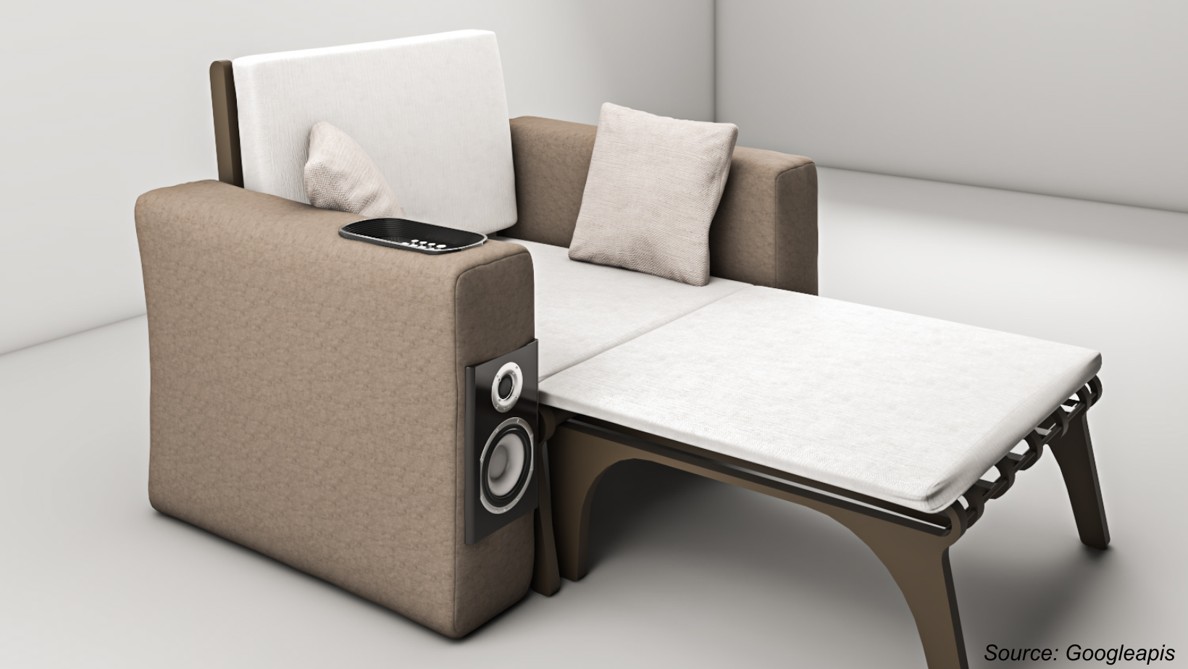
The surge in remote work and hybrid work models in North America has fueled demand for smart furniture designed for home offices. Adjustable desks, ergonomic chairs with integrated sensors, and multifunctional storage solutions enhance productivity, health, and comfort for professionals working from home. Smart office furniture with IoT connectivity allows users to track posture, optimize workspace organization, and integrate with digital devices for seamless work experiences. Rising awareness of ergonomics, coupled with the need for flexible and functional home office setups, is driving significant adoption among professionals, freelancers, and students. This trend not only supports immediate market growth but also encourages innovation in the design and functionality of smart furniture solutions tailored for remote working lifestyles.
High Costs Limit Widespread Adoption of Smart Furniture Restraints the North America Smart Furniture Market Demand
The high cost of technologically advanced smart furniture remains a key restraint in North America. Products with integrated sensors, IoT connectivity, and automated features carry premium prices, making them less accessible to a broad consumer base. Additionally, maintenance expenses, software updates, and potential compatibility issues with existing home systems further discourage adoption. Even as awareness of smart home benefits grows, economic fluctuations and cautious consumer spending prevent mass-market penetration. This pricing barrier is particularly significant in regions with middle-income households, restricting large-scale adoption and slowing overall market growth despite the strong demand for connected, ergonomic, and multifunctional furniture.
Integration of AI and IoT to Enhance Furniture Functionality Creates New North America Smart Furniture Market Opportunities
The integration of AI and IoT technologies presents significant growth potential for the smart furniture market in North America. AI-enabled furniture analyze user behaviors, comfort preferences, and ergonomic patterns to automatically adjust settings, enhancing posture, productivity, and overall well-being. For instance, smart workstations modify height throughout the day to support healthy sitting and standing habits, while intelligent beds track sleep patterns and adjust firmness or temperature for optimal rest. As the smart home ecosystem in North America expands and digital connectivity improves, these furniture solutions increasingly integrate with lighting, voice assistants, and home monitoring systems, creating fully synchronized and connected living spaces. Rising consumer demand for personalized, energy-efficient, and tech-enabled home solutions positions manufacturers that combine AI and IoT innovation with appealing design and competitive pricing to capture a larger share of this evolving market.
U.S. Dominates the Smart Furniture Market in North America Region
The United States leads the smart furniture market in North America, driven by widespread adoption of smart home technologies, high disposable incomes, and a tech-savvy consumer base. Increasing demand for ergonomic, multifunctional, and connected furniture, coupled with the rise of remote and hybrid work models, has fueled growth in urban and suburban households alike. Advanced digital infrastructure, including high-speed internet and 5G networks, supports seamless integration of AI- and IoT-enabled furniture with smart home systems. U.S. manufacturers and retailers are capitalizing on these trends by offering innovative, tech-enabled furniture solutions, positioning the country as the dominant contributor to the North American smart furniture market.
Mexico to Witness Highest CAGR in North America Region
The smart furniture market in Mexico is projected to experience the highest CAGR in North America, driven by rising urbanization, increasing disposable incomes, and growing awareness of ergonomic and tech-enabled furniture solutions. Consumers in urban centers such as Mexico City, Monterrey, and Guadalajara are increasingly adopting multifunctional and AI-/IoT-integrated furniture to optimize space, enhance comfort, and connect with smart home ecosystems. Expanding e-commerce channels, coupled with the entry of international smart furniture brands, are accelerating market penetration, positioning Mexico as the fastest-growing market within the North American region.
Competitive Landscape
The North America smart furniture industry comprises various market players, such Steelcase Inc., MillerKnoll Inc., Haworth Inc., Humanscale International Inc., Autonomous AI Inc., Sleep Number Corporation, Eight Sleep Inc., Ori Living Inc., UPLIFT Desk Inc., Sobro Design Inc., IKEA, La Z Boy Inc., Ashley Furniture Industries Inc., Teknion Corporation, and Vitra International.
North America Smart Furniture Market Key Segments
By Product Type
-
Smart Tables & Desks
-
Smart Stools & Benches
-
Smart Chairs
-
Smart Bed
By Distribution Channel
-
B2C/Retail
-
Big‑box/Home Centres
-
Specialty Furniture Stores
-
E‑commerce
-
-
Contract (B2B Projects & Fit‑Outs)
By End-User
-
Residential
-
Commercial
By Region
-
U.S.
-
Canada
-
Mexico
Key Players
-
MillerKnoll, Inc.
-
Humanscale International, Inc.
-
Autonomous AI, Inc.
-
Sleep Number Corporation
-
Eight Sleep, Inc.
-
Ori Living, Inc.
-
UPLIFT Desk, Inc.
-
Sobro Design, Inc.
-
IKEA Home Smart (part of IKEA)
-
La‑Z‑Boy Inc.
-
Ashley Furniture Industries, Inc.
-
Teknion Corporation
-
Vitra International
Report Scope and Segmentation:
|
Parameters |
Details |
|
Market Size in 2025 |
USD 314.94Million |
|
Revenue Forecast in 2030 |
USD 553.76 Million |
|
Growth Rate |
CAGR of 11.95% from 2025 to 2030 |
|
Analysis Period |
2024–2030 |
|
Base Year Considered |
2024 |
|
Forecast Period |
2025–2030 |
|
Market Size Estimation |
Million (USD) |
|
Growth Factors |
|
|
Countries Covered |
3 |
|
Companies Profiled |
15 |
|
Market Share |
Available for 10 companies |
|
Customization Scope |
Free customization (equivalent to up to 80 working hours of analysts) after purchase. Addition or alteration to country, regional, and segment scope. |
|
Pricing and Purchase Options |
Avail customized purchase options to meet your exact research needs. |
")

About the Author
 Mayurima Roy is a research analyst delivering data-driven insights that support strategic planning and market understanding. She combines analytical rigor with strong content development skills, translating complex information into clear, actionable narratives for diverse audiences. Her work includes structured research, trend tracking, competitive assessment, and insight-led content creation that supports informed decision-making. Curious and detail-oriented by nature, she continually deepens her understanding of evolving markets while pursuing creative interests such as crafting and video creation.
About the Reviewer
 Supradip Baul is an accomplished business consultant and strategist with over a decade of rich experience in market intelligence, strategy, technology, and business transformation. His work has included rigorous qualitative and quantitative analysis across multiple industries, helping clients shape investment decisions and long-term roadmaps. Earlier in his career, he was associated with Gartner, where he contributed to industry-leading reports and market share analyses. He has worked with leading global companies and holds an MBA with a dual specialization in Marketing and Finance.
At Next Move Strategy Consulting, we understand that insightful market research is the cornerstone of successful business decisions. That's why we employ a robust and multifaceted approach, combining various methodologies to deliver the most accurate and actionable data for our clients.

Research Landscape
We navigate the world of research with two primary approaches:
Qualitative Approach
Our qualitative research methodologies involve immersive techniques such as in-depth interviews, focus groups, and observational studies. By engaging directly with individuals and stakeholders, we uncover valuable insights that quantitative data alone may overlook.

Quantitative Research
In tandem with qualitative methodologies, NMSC leverages the power of Quantitative Research to provide a robust foundation of numerical insights. Through systematic data collection and analysis, we quantify patterns, preferences, and market trends, offering a comprehensive view of the business landscape.
Our quantitative research approach employs diverse tools, including surveys, experiments, and statistical modelling. These methodologies enable us to gather data from a large and representative sample, ensuring the statistical significance of our findings. By employing structured questionnaires and standardized data collection methods, we guarantee the reliability and validity of the information we present to our clients.
Quantitative research is particularly effective in measuring the prevalence of trends, assessing market size, and gauging the impact of various factors on consumer behavior. The numerical precision attained through this approach equips our clients with actionable insights, facilitating data-driven decision-making and strategy formulation.


Our Specialized Toolbox for Industry-Specific Market Research
We deploy a specialized arsenal of techniques tailored to meet your unique requirements. Here's a glimpse into our comprehensive toolbox:

Information Procurement
The stage entails acquiring market data or relevant information through various sources and methodologies.


Market Research Approach
We utilize both top-down and bottom-up approaches in market research analysis to achieve a comprehensive understanding of the market dynamics, leveraging the broad perspective of industry trends and macroeconomic factors alongside detailed insights from specific segments and individual companies.

Porters Five Forces Analysis
We conduct Porter's Five Forces analysis to evaluate the competitive landscape of an industry, providing us with insights into factors that affect profitability and strategic positioning.

SWOT Analysis

Forecasting
We utilize a forecasting model to predict future consumption by considering parameters like population, economics, regulations, market competition, drivers, constraints, technology, and pricing. We also employ statistical techniques such as multilinear regression, exponential smoothing, moving average, ARIMA, and Monte Carlo simulations for accurate predictions. In econometric forecasting, we analyzed short-term and long-term event impacts, attributing values based on regulatory frameworks, economic factors, and market events.


 Speak to Our Analyst