Passive Electronic Components Market

Passive Electronic Components Market: Passive Electronic Components Market size was USD 41.09 Billion in 2025, projected to reach USD 67.7 Billion by 2035, growing at a CAGR of 4.97% from 2026 to 2035. Key drivers include surging AI server and data center demand for high-capacitance multilayer ceramic capacitors, rising electric vehicle production, and increasing demand for automotive-grade passive components, with Asia-Pacific leading the market .

Download Free Sample PDF
Base Year (2025)
$41.09 Billion
Forecast (2035)
$67.70 Billion
CAGR (2026-2035)
5.0%
Top Country
Asia-Pacific

What Is the Passive Electronic Components Market Size?

The global passive electronic components market size was valued at USD 41.09 billion in 2025 and is estimated at USD 43.75 billion in 2026, projected to reach USD 67.7 billion by 2035, growing at a CAGR of 4.97% from 2026 to 2035. Asia-Pacific led the market with an approximate 58% revenue share in 2025, while the Capacitors component segment dominated at roughly 42% share.

Our findings suggest that the following key takeaways summarize the passive electronic components market's segment-level and geographic dynamics as of 2025.

Passive Electronic Components Market Revenue Forecast

Values in USD Billion

2025 $41.09 Billion
2025
2026 $43.75 Billion
2026
2027 $45.92 Billion
2027
2028 $48.21 Billion
2028
2029 $50.60 Billion
2029
2030 $53.12 Billion
2030
2031 $55.76 Billion
2031
2032 $58.53 Billion
2032
2033 $61.44 Billion
2033
2034 $64.49 Billion
2034
2035 $67.70 Billion
2035

Key Takeaways

By Component: Capacitors held the largest share, expanding from USD 17.26 billion in 2025 to USD 25.73 billion by 2035, representing approximately 42% of the market in 2025. Other Passive Components is the fastest-growing component category, while Passive Filters is the fastest-growing scaled segment at 11.02% CAGR from 2026–2035.

By End-User Industry: Automotive held the largest share, accounting for approximately 26% of the market and reaching USD 10.68 billion in 2025; Computing and Data Centres is the fastest-growing end-user industry at 11.15% CAGR from 2026–2035.

By Sales Channel: Distribution held the largest share, accounting for approximately 56% of the market and reaching USD 23.01 billion in 2025; Digital Sales is the fastest-growing sales channel at 12.84% CAGR from 2026–2035.

Dominant Region: Asia-Pacific dominated the market with approximately 58% revenue share in 2025, representing USD 23.83 billion.

Fastest-Growing Region: Middle East & Africa is expected to register the highest CAGR of 10.90% during 2026–2035.

Dominant Country: China led the market, reaching USD 8.58 billion in 2025.

Fastest-Growing Country: India is the fastest-growing country, registering a CAGR of 11.13% during 2026–2035.

Market Opportunity: The passive electronic components market presents an absolute dollar opportunity of approximately USD 23.95 billion between 2026 and 2035, calculated as the difference between the 2035 forecast value and the 2026 base value, an investment window favoring manufacturers scaling high-capacitance, AI server-grade multilayer ceramic capacitor production.

According to NMSC analysis, we found that the gap between surging AI data center demand for high-capacitance components and currently constrained high-end manufacturing capacity is widening the addressable market for capacity-expanding manufacturers, with lead times for certain high-voltage, high-capacitance components reportedly stretching from four weeks to twenty weeks in 2026 amid tightening supply.

Ecosystem Analysis of the Passive Electronic Components Industry

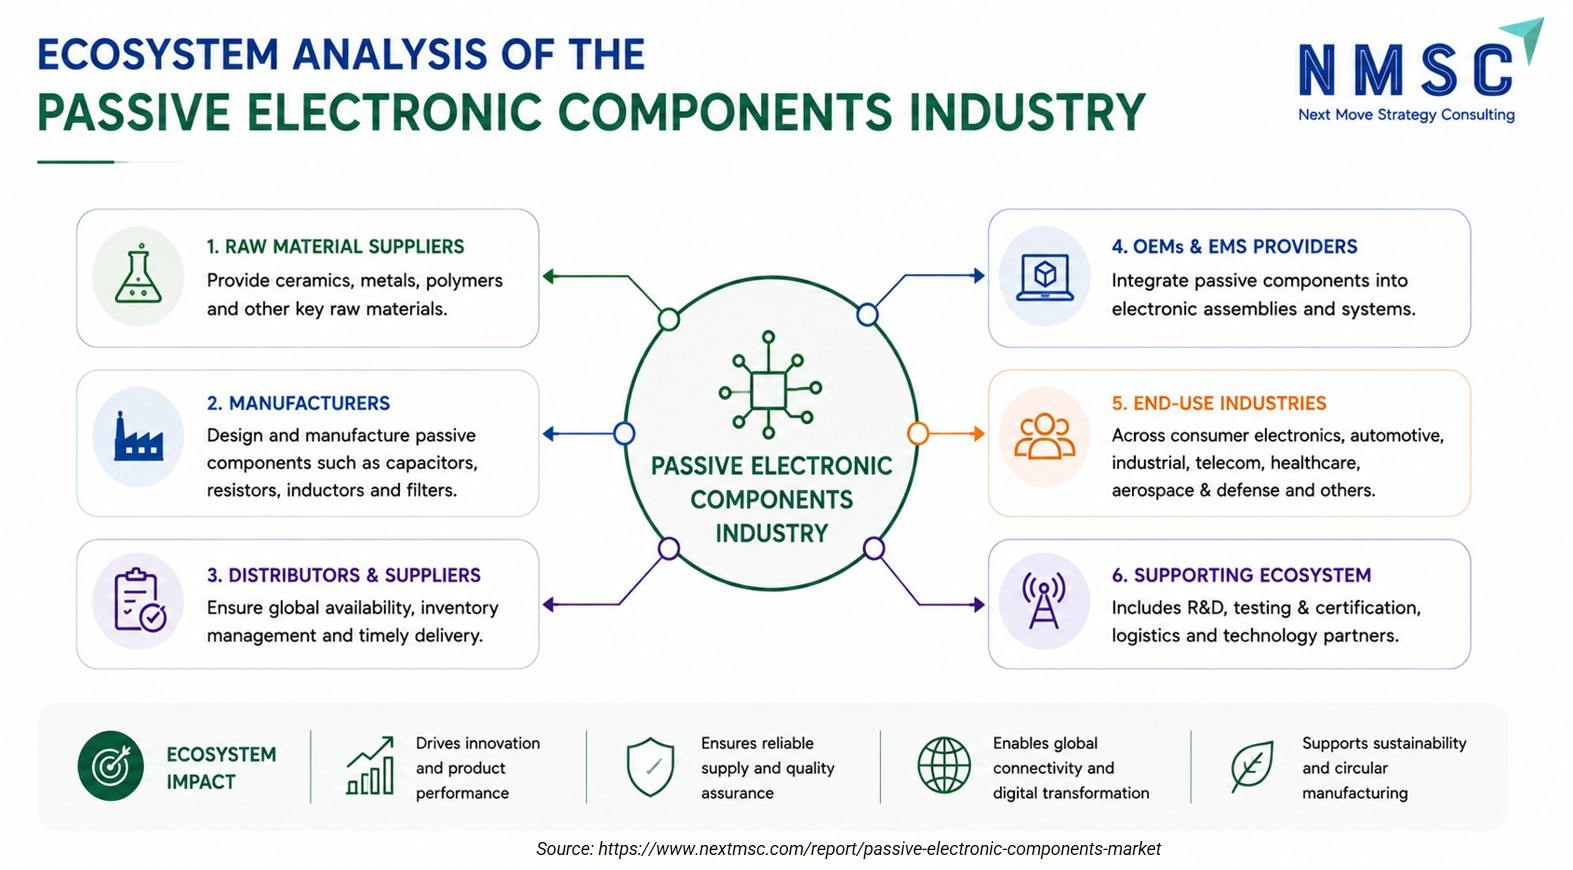
The above infographic provides a detailed ecosystem analysis of the passive electronic components industry, mapping out six key segments from raw material suppliers to end-use industries. It illustrates how manufacturers, distributors, and OEMs interact within a connected network to ensure global supply and drive technological integration. The analysis further highlights the supporting ecosystem of R&D and testing, while emphasizing the industry's broader impact on innovation, digital transformation, and sustainable manufacturing. Ultimately, it demonstrates how this interconnected chain reliably supplies essential components across diverse sectors like automotive, healthcare, and aerospace .

What does the Passive Electronic Components Market Encompass?

The market encompasses capacitors, resistors, inductors, transformers, thermistors, varistors, chokes, magnetic beads, and RF passive components. These devices store, filter, or dissipate electrical energy without amplification or active switching. They span applications across automotive, consumer electronics, computing, telecommunications, industrial, medical, and aerospace sectors.
We observed that the market has evolved structurally from commodity-grade components toward highly specified, application-engineered products. This is demonstrated by major capital injections from tier-1 manufacturers aimed specifically at medium- to long-term MLCC capacity.

Regulatory frameworks continue to reshape material composition requirements, with the European Commission publishing Delegated Directive (EU) 2025/2363 in the Official Journal on November 21, 2025, extending the lead-in-dielectric-ceramic-capacitor exemption under the RoHS Directive to December 31, 2027 for capacitors rated 125 V AC or 250 V DC and above. During our market evaluation, we noticed that capacitor technology adoption is accelerating fastest in AI server and data center applications, where a single high-end AI server platform can require tens of thousands of individual multilayer ceramic capacitors.

The market encompasses capacitors, resistors, inductors, transformers, thermistors, varistors, chokes, magnetic beads, and RF passive components. These devices store, filter, or dissipate electrical energy without amplification or active switching. They span applications across automotive, consumer electronics, computing, telecommunications, industrial, medical, and aerospace sectors.

We observed that the market has evolved structurally from commodity-grade components toward highly specified, application-engineered products. This is demonstrated by major capital injections from tier-1 manufacturers aimed specifically at medium- to long-term MLCC capacity .

Regulatory frameworks continue to reshape material composition requirements, with the European Commission publishing Delegated Directive (EU) 2025/2363 in the Official Journal on November 21, 2025, extending the lead-in-dielectric-ceramic-capacitor exemption under the RoHS Directive to December 31, 2027 for capacitors rated 125 V AC or 250 V DC and above. During our market evaluation, we noticed that capacitor technology adoption is accelerating fastest in AI server and data center applications, where a single high-end AI server platform can require tens of thousands of individual multilayer ceramic capacitors.

Market Size in 2025 USD 41.09 Billion
Market Size in 2026 USD 43.75 Billion
Revenue Forecast in 2035 USD 67.7 Billion
Growth Rate CAGR of 4.97% from 2026 to 2035
Analysis Period 2025–2035
Base Year Considered 2025
Forecast Period 2026–2035
Market Size Estimation USD Billion
Companies Profiled 20
Countries Covered 38
Market Share Available for Top 10 Companies
Source: www.nextmsc.com

Market Drivers & Dynamics

Interactive Dataset
Surging AI server and data center demand for high-capacitance components driver +1.6% Asia-Pacific, North America 2026–2032
Rising electric vehicle production requiring automotive-grade passives driver +1.1% Asia-Pacific, Europe 2026–2033
Expanding 5G and telecommunications infrastructure investment driver +0.7% Asia-Pacific, Middle East 2026–2031
Capacity expansion and manufacturing footprint diversification driver +0.5% Asia-Pacific 2026–2030
Regulatory clarity under updated EU RoHS lead exemptions driver +0.3% Europe 2026–2028
Extended component lead times constraining high-end supply restraint −0.8% Global 2026–2028
Rising raw material costs for silver, nickel, and precious metals restraint −0.6% Global 2026–2029
Price sensitivity in commodity-grade consumer electronics segments restraint −0.4% Asia-Pacific, Latin America 2026–2030
Source: Next Move Strategy Consulting

Growth Drivers

Surging AI server and data center demand for high-capacitance components

Surging AI server and data center demand for high-capacitance multilayer ceramic capacitors is the single largest driver of market growth, as accelerator-dense server platforms require dramatically higher component counts than conventional computing hardware. Murata's confirmed JPY 80 billion additional capital expenditure plan for fiscal years 2026 and 2027, directed specifically at AI data center MLCC capacity, reflects the scale of this demand shift. We observed that this AI-driven demand is directly underpinning the Computing and Data Centres end-use segment's above-market growth rate.

Rising electric vehicle production requiring automotive-grade passives

Rising electric vehicle production is driving demand for automotive-grade passive components engineered to withstand higher voltages, temperatures, and vibration than consumer-grade equivalents. Vishay Intertechnology's continued expansion of AEC-Q200-qualified resistors, film capacitors, and common-mode chokes for traction inverters, on-board chargers, and battery monitoring systems illustrates this automotive-specific product development cadence. Our analysis shows that the Automotive end-use segment retains the largest 2025 revenue share as a result of this sustained qualification and design-in activity.

Growth Inhibitors

Extended component lead times constraining high-end supply

Extended component lead times restrain the pace of downstream production for server and automotive original equipment manufacturers, with certain high-capacitance, high-voltage MLCC models reportedly experiencing lead times stretching from a typical four weeks to twenty weeks amid 2026 supply tightness. Rising raw material costs for silver and other precious metals used in electrode formulations also restrain manufacturer margins. We found that these pressures are concentrating near-term supply access among customers able to commit to long-term volume agreements with the largest manufacturers.

Segmentation Analysis

2025 (USD Billion)
2035 (USD Billion)
Capacitors
Ceramic Capa
Multilayer C
Single-Layer
Feedthrough
Segment Item 2025 (USD Billion) 2035 (USD Billion) CAGR
Capacitors $10.0 USD Billion $40.0 USD Billion 14.0%
Ceramic Capacitors $17.1 USD Billion $51.1 USD Billion 8.0%
Multilayer Ceramic Capacitors $24.2 USD Billion $62.2 USD Billion 14.0%
Single-Layer Ceramic Capacitors $31.3 USD Billion $73.3 USD Billion 20.0%
Feedthrough Ceramic Capacitors $38.4 USD Billion $84.4 USD Billion 27.0%

Segment-wise data is locked

Unlock complete segment-wise numbers for By Component.

Unlock Full Data

Which Component Segment Dominates the Market?

Capacitors dominate the passive electronic components market with approximately a 42% share in 2025, valued at USD 17.26 billion, reflecting their universal role across every electronic circuit and their outsized content in AI server and data center hardware. RF Passive Components is the fastest-growing segment at a 20.81% CAGR from 2026 to 2035, as expanding 5G infrastructure and satellite communications demand drive rapid adoption of attenuators, couplers, and baluns from a comparatively small 2025 base.

2025 (USD Billion)
2035 (USD Billion)
Automotive
Consumer Ele
Smartphones
TVs and Audi
Wearables
Segment Item 2025 (USD Billion) 2035 (USD Billion) CAGR
Automotive $10.0 USD Billion $40.0 USD Billion 25.0%
Consumer Electronics $17.1 USD Billion $51.1 USD Billion 11.0%
Smartphones and Tablets $24.2 USD Billion $62.2 USD Billion 25.0%
TVs and Audio $31.3 USD Billion $73.3 USD Billion 11.0%
Wearables $38.4 USD Billion $84.4 USD Billion 16.0%

Segment-wise data is locked

Unlock complete segment-wise numbers for By End-User Industry.

Unlock Full Data

Which End-User Industry Segment Is Growing Fastest?

Automotive leads the end-user segmentation with approximately 26% share in 2025 at USD 10.68 billion, anchored by rising electric vehicle production and expanding advanced driver-assistance system content per vehicle. Computing and Data Centres is the fastest-growing end-user segment at an 11.15% CAGR, directly reflecting AI server deployment volumes, with Murata's own disclosures confirming that AI data center demand is now a primary driver of its capital expenditure planning through fiscal 2027.

2025 (USD Billion)
2035 (USD Billion)
Direct Sales
Distribution
Digital Sale
Segment Item 2025 (USD Billion) 2035 (USD Billion) CAGR
Direct Sales $10.0 USD Billion $40.0 USD Billion 27.0%
Distribution $17.1 USD Billion $51.1 USD Billion 9.0%
Digital Sales $24.2 USD Billion $62.2 USD Billion 19.0%

Segment-wise data is locked

Unlock complete segment-wise numbers for By Sales Channel.

Unlock Full Data

Which Sales Channel Segment Leads the Passive Electronic Components Market?

Distribution leads the sales-channel segmentation with approximately 56% share in 2025 at USD 23.01 billion, reflecting the long-established role of authorized distributors in serving the fragmented base of small and mid-sized electronics manufacturers that purchase passive components in lower volumes. Digital Sales is the fastest-growing channel at a 12.84% CAGR, as engineering procurement teams increasingly source components through online catalogs and digital marketplaces offering real-time inventory visibility.

Growth Opportunities

Beyond the core drivers shaping overall demand, three whitespace opportunities stand out for passive component manufacturers positioning portfolios toward 2035.

How Can Manufacturers Capture Value from AI Data Center Capacity Expansion?

Dedicated high-capacitance MLCC production lines built specifically for AI server and data center applications create a mechanism for manufacturers to capture premium pricing during a period of confirmed supply tightness. Manufacturers with committed capital expenditure programs, such as Murata's fiscal 2026–2027 investment plan, stand to benefit most from this fastest-growing end-use opportunity.

What Opportunity Exists in RF and 5G Passive Component Specialization?

Expanding 5G infrastructure and satellite communications deployment create a mechanism for manufacturers to capture share in RF passive components, including attenuators, couplers, and baluns, a segment still small in absolute terms but growing at the fastest rate in the entire component taxonomy. Manufacturers with established RF filter and LTCC filter design capability are best positioned to capture this specialized, high-growth opportunity.

How Can Suppliers Benefit from Automotive Electrification Qualification Programs?

AEC-Q200 qualification programs for next-generation electric vehicle platforms create a mechanism for suppliers to secure long-term design-in positions on components such as automotive-grade film capacitors and power resistors. Suppliers with proven automotive qualification track records, exemplified by Vishay's expanding AEC-Q200 portfolio, are best positioned to capture this durable, design-cycle-anchored opportunity.

Regional Outlook

2025 (USD Billion)
2035 (USD Billion)
North Americ
Europe
Asia-Pacific
Middle East
Latin Americ
Region 2025 (USD Billion) 2035 (USD Billion) CAGR (%)
North America $10.0 USD Billion $40.0 USD Billion 9.0%
Europe $17.1 USD Billion $51.1 USD Billion 27.0%
Asia-Pacific $24.2 USD Billion $62.2 USD Billion 25.0%
Middle East & Africa $31.3 USD Billion $73.3 USD Billion 23.0%
Latin America $38.4 USD Billion $84.4 USD Billion 12.0%

Regional data is locked

Unlock complete regional numbers for this market.

Unlock Full Data

Supply Chain Analysis of the Passive Electronic Components Market

Supply Chain Analysis of the Passive Electronic Components Market
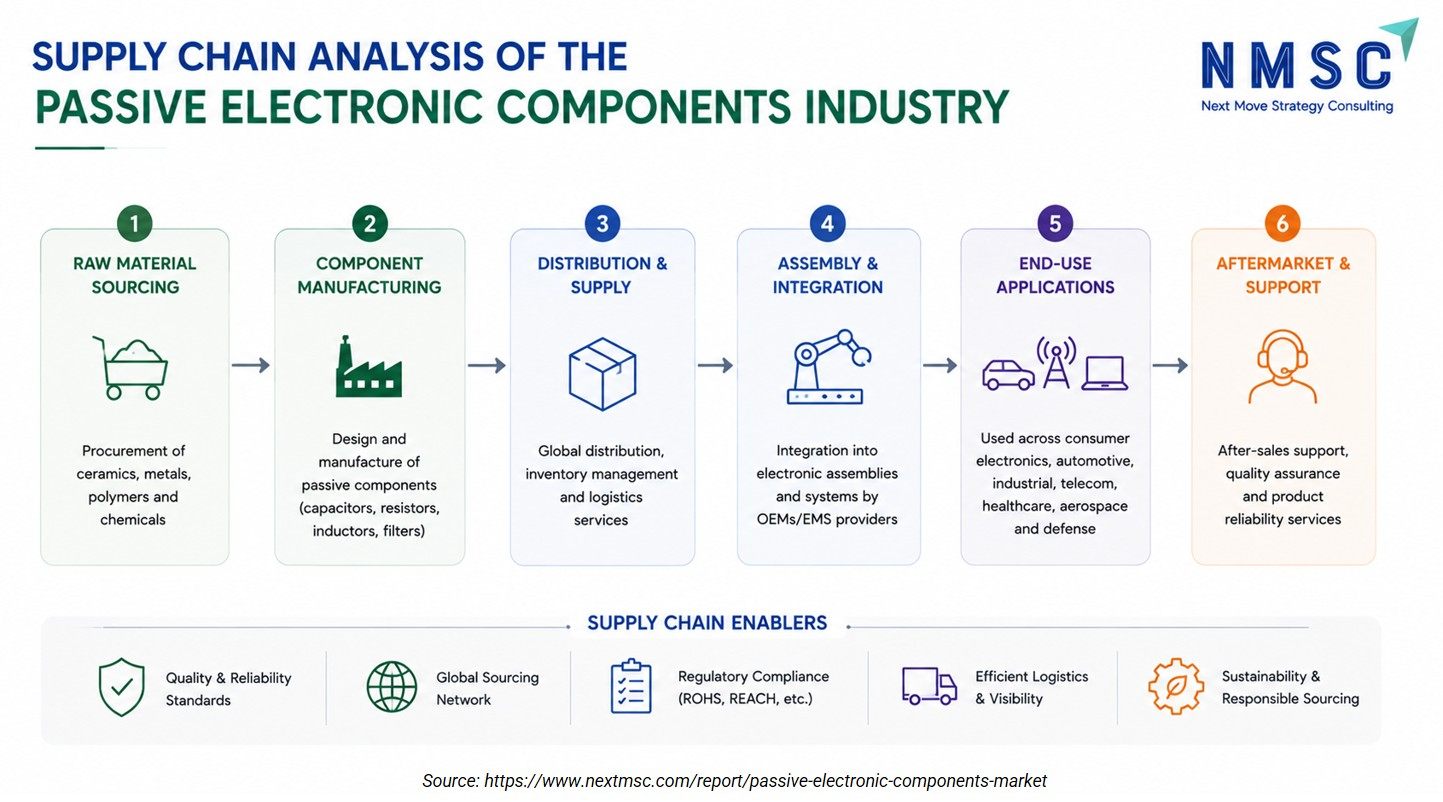
The above infographic provides a detailed supply chain analysis of the passive electronic components industry, outlining a six-step process from raw material sourcing to aftermarket support. It traces the journey of components through manufacturing, global distribution, and assembly before reaching diverse end-use applications like automotive and healthcare. Supported by key enablers such as quality standards and regulatory compliance, the chain ensures reliable delivery. Ultimately, the analysis highlights the industry's structured approach to maintaining efficiency, visibility, and sustainability across its global operations .

Competitive Landscape

Our assessment indicates that competitive intensity in the passive electronic components market is shaped by a concentrated group of Japanese, Taiwanese, and Korean manufacturers competing on manufacturing scale, materials engineering depth, and automotive qualification breadth within the broader semiconductor and electronics component supply chain. Market Structure | Concentrated at the high-end MLCC and automotive-grade tier around Murata, TDK, Samsung Electro-Mechanics, and YAGEO, fragmented among regional manufacturers at the commodity-grade tier. Innovation Focus | High-capacitance, high-voltage MLCC design for AI data centers, automotive-grade qualification under AEC-Q200, and geographically diversified manufacturing capacity. M&A Activity | Organic capacity expansion and strategic capital expenditure commitments rather than large-scale horizontal consolidation among the leading manufacturers. Source: www.nextmsc.com

How Do Companies Compete in the Passive Electronic Components Market?

Companies compete primarily on manufacturing scale, materials engineering capability, automotive and industrial qualification breadth, and proven multi-decade customer relationships built through original design manufacturer partnerships. Our analysis shows that Murata Manufacturing competes on ceramic materials engineering depth and MLCC manufacturing scale, while Vishay Intertechnology competes on product-line breadth spanning resistors, capacitors, inductors, and automotive-qualified components across a single unified catalog .

Which Competitive Archetypes Dominate the Passive Electronic Components Industry?

Two archetypes dominate the market: large-scale Japanese and Korean manufacturers competing on proprietary materials science and MLCC manufacturing depth, and diversified multinational component makers competing on product-line breadth across the full passive component taxonomy. Murata Manufacturing exemplifies the materials-science archetype through its ceramic dielectric expertise, while Vishay Intertechnology exemplifies the diversified- catalog archetype through its broad resistor, capacitor, inductor, and sensor product range.

How Are Companies Differentiating Through Innovation?

Innovation and differentiation increasingly center on high-capacitance, high-voltage MLCC design and automotive-grade qualification depth. Murata's development of the world's smallest 006003-case MLCC and a high-layer-count 0402-case device, alongside Vishay's continued AEC-Q200 qualified product introductions across resistors, film capacitors, and common-mode chokes, both illustrate how manufacturers are pushing miniaturization and reliability specifications simultaneously to serve AI infrastructure and automotive electrification demand.

What M&A and Expansion Activity Is Shaping the Market?

Expansion activity is concentrated in organic manufacturing capacity investment rather than large-format acquisitions among the leading passive component manufacturers. Murata's completed Izumo production facility, its planned JPY 80 billion additional capital expenditure for fiscal years 2026 and 2027, and its leased Indian rental facility together illustrate how the largest manufacturers are prioritizing geographically diversified, demand-driven capacity growth over consolidation.

Key Market Players

Our assessment indicates that the following 20 companies are actively shaping manufacturing capacity, materials innovation, and automotive and computing qualification breadth within the global passive electronic components market.

Murata Manufacturing Co., Ltd. TDK Corporation YAGEO Corporation Samsung Electro-Mechanics Co., Ltd. Vishay Intertechnology , Inc. KYOCERA AVX Components Corporation Panasonic Industry Co., Ltd. TAIYO YUDEN CO., LTD. NICHICON CORPORATION Walsin Technology Corporation Nippon Chemi-Con Corporation SUMIDA CORPORATION Shenzhen Sunlord Electronics Co., Ltd. Bourns, Inc. KOA Corporation Guangdong Fenghua Advanced Technology Holding Co., Ltd. Lelon Electronics Corp. Rubycon Corporation Hunan Aihua Group Co., Ltd. Würth Elektronik eiSos GmbH & Co. KG

Latest Developments

We found that recent capacity expansions and regulatory developments within the passive electronic components market are concentrated on AI-driven MLCC investment and automotive-grade product introductions across 2025 and 2026.

Date Event
September 2026 TDK expanded its CN series with 100 V X7R MLCCs delivering 10 μF capacitance in a 3225 package. Designed for AI servers, humanoid robots, xEVs , and industrial equipment, the components provide low resistance, soft termination, higher reliability, and reduced component count.
September 2026 Murata: Murata expanded its automotive-grade DFE2MCPH_JL metal power inductor series by adding nine new inductance values . The expanded lineup is designed for automotive power circuits used in ADAS, in-vehicle infotainment (IVI), and other automotive electronic equipment, providing greater design flexibility as vehicle electronics become more sophisticated and electrified.
September 2026 KYOCERA AVX added a 0201 case size to its KGU Series high-performance C0G/NP0 RF MLCCs. The ultraminiature capacitors target satellite, cellular, and broadband wireless systems and extend the series across five miniature and ultraminiature EIA package sizes.
July 2026 Samsung Electro-Mechanics introduced ultra-compact, ultra-high-capacitance MLCCs addressing growing requirements from AI edge devices. The company also expanded its MLCC portfolio with 1,000 V-rated products and automotive high-capacitance solutions during 2026.

Investment Opportunities

What Capital Inflows Are Targeting the Passive Electronic Components Market?

Capital inflows are increasingly directed toward high-capacitance MLCC and automotive-grade component manufacturing capacity, with Murata's confirmed JPY 80 billion additional investment for fiscal years 2026 and 2027 representing one of the largest publicly disclosed capacity commitments in the sector. We observed that investors favor manufacturers demonstrating confirmed AI data center and hyperscale customer demand, viewing extended order lead times as a proxy for durable, multi-year revenue visibility.

How Is Infrastructure Investment Supporting Market Growth?

Infrastructure investment in geographically diversified manufacturing capacity continues to underwrite passive component supply resilience, with Murata's production sites spanning Japan, Thailand, China, and India illustrating a deliberate multi-country capacity strategy. Our findings suggest that manufacturers with the most diversified production footprints are best positioned to capture this infrastructure-driven investment while managing single-country concentration risk through 2035.

What ESG Considerations Are Shaping Investment Decisions?

Material compliance and responsible sourcing are central governance considerations shaping investment decisions, as passive component manufacturers must navigate evolving restrictions on lead and other regulated substances under frameworks such as the EU RoHS Directive. We found that investors increasingly treat demonstrated regulatory compliance readiness, including timely qualification under updated exemption schedules, as a governance indicator alongside conventional financial performance metrics when evaluating component manufacturers.

Key Benefits for Stakeholders

How Does This Report Benefit Enterprise and Industry Leaders?

Enterprise and industry leaders gain access to validated segmentation, competitive benchmarking, and regional demand forecasts that support sourcing and capacity-investment decisions across the passive electronic components industry. Our analysis shows that detailed component, end-user, and sales-channel breakdowns help procurement teams align sourcing strategy with the fastest-growing segments, including RF Passive Components and Computing and Data Centres.

How Does This Report Benefit Investors and Financial Analysts?

Investors and financial analysts benefit from consistent, single-point market size and CAGR estimates that support valuation and capital-allocation decisions across the passive electronic components supply chain. We observed that the report's regional and segment-level growth differentials help identify which manufacturers are best positioned to capture above-market growth in AI-driven capacitor demand and Middle East & Africa infrastructure expansion through 2035.

How Does This Report Benefit Technology Vendors and Product Teams?

Technology vendors and product teams gain insight into emerging design requirements, including high-capacitance MLCC miniaturization, automotive-grade qualification standards, and RF filter specialization, that are reshaping the industry. Our findings suggest that this analysis helps R&D teams prioritize development roadmaps around the Passive Filters and Digital Sales segments showing the strongest above-market growth trajectories.

Key Market Segments Evaluated

By Component

  • Capacitors
  • Resistors
  • Inductors
  • Passive Filters
  • Transformers
  • Chokes
  • Magnetic Beads
  • Thermistors
  • Varistors
  • RF Passive Components
  • Coupled Inductors
  • Other Passive Components

By End-User Industry

  • Automotive
  • Consumer Electronics
  • Industrial
  • Computing and Data Centres
  • Telecommunications
  • Medical
  • Aerospace and Defence
  • Other Electronics

By Sales Channel

  • Distribution
  • Direct Sales
  • Digital Sales

Conclusion & Recommendations

The long-term outlook for the passive electronic components market remains positive, with global revenue projected to grow from USD 41.09 billion in 2025 to USD 67.7 billion by 2035 at a 4.97% CAGR. We observed that AI-driven capacitor demand, automotive electrification, and expanding RF and telecommunications applications will continue underpinning demand across automotive, computing, and industrial end uses through the forecast period.

What Strategic Positioning Should Passive Component Manufacturers Pursue?

Manufacturers should prioritize high-capacitance MLCC capacity expansion and automotive-grade qualification breadth while maintaining geographically diversified production to manage supply-chain concentration risk. Our assessment indicates that manufacturers investing early in AI data center -grade capacitor capacity will be best positioned to capture premium pricing during the current period of confirmed supply tightness.

How Attractive Is the Passive Electronic Components Market for New Investment?

The passive electronic components market presents an attractive investment case, supported by a USD 23.95 billion absolute dollar opportunity between 2026 and 2035 and above-average growth in Computing and Data Centres and RF Passive Components. We found that investment attractiveness is highest for manufacturers combining proven high-capacitance manufacturing scale with confirmed hyperscale and automotive customer relationships, positioning them to serve both AI-driven and electrification-driven demand simultaneously.

What Market Shifts and Key Risks Should Stakeholders Monitor?

Stakeholders should monitor extended component lead times, rising precious metal input costs, and price sensitivity in commodity-grade consumer electronics segments as key risks to the passive electronic components market. Our analysis shows that manufacturers unable to expand high-end capacity quickly enough risk losing share to competitors with earlier-completing capital projects as AI-driven demand continues to outpace near-term supply.

What Are the Key Growth Pathways for the Passive Electronic Components Market?

Key growth pathways include scaling high-capacitance MLCC production for AI infrastructure, deepening automotive-grade qualification programs following precedents such as Vishay's expanding AEC-Q200 portfolio, and expanding RF and filter specialization to serve 5G and satellite communications growth. Next Move Strategy Consulting's analysis indicates that manufacturers pursuing these pathways while managing geographically diversified capacity will be best positioned to capture the market's projected growth through 2035.

Delivered Customizations

We have successfully delivered the following deep-dive customizations:

Client Request Customization Delivered Value Adds
Historical Market & Sales Analysis
  • Historical sales value and shipment volume analysis across capacitors, resistors, inductors, and other passive component categories.
  • Identifies high-growth component categories and cyclical demand patterns to guide capacity and portfolio priorities.
Company-Level Sales Volume Analysis
  • Company-level unit shipments and passive component sales benchmarking by component category, based on annual reports and investor filings.
  • Highlights supplier scale differences and share shifts to support competitive positioning and partnership targeting.
Country-Level Trade Assessment
  • Country-wise import and export analysis for capacitors, resistors, inductors, and related passive components using customs trade data.
  • Reveals sourcing dependencies and regional supply hubs to support sourcing and localization decisions.
End-User Industry Demand Mapping
  • Passive component content and demand mapping by component type across automotive, consumer electronics, industrial, telecom, and healthcare end-user industries.
  • Prioritizes high-value end-user industries and shows where component demand is shifting.
Automotive Electrification Opportunity Assessment
  • Passive component content-per-vehicle and demand outlook for automotive-grade capacitors, resistors, and inductors across ICE, hybrid, and electric vehicles, within the automotive end-user segment.
  • Guides automotive-grade product investment and qualification priorities for xEV and ADAS growth.
Sales Channel and Distributor Landscape Analysis
  • Component-wise revenue split between direct OEM sales and distribution, with profiling of leading authorized distributors using public filings.
  • Supports go-to-market design, distributor partner selection, and channel margin optimization.

FAQs

About the Author

Mayurima Roy

Mayurima Roy

Mayurima Roy is Research Analyst at Next Move Strategy Consulting, where she has spent 4 years working across the firm's full industry coverage rather than a single fixed vertical. Her work centers on structured research, ongoing trend tracking, competitive assessment, and insight-led content development, translating complex market data into clear, decision-ready narratives that support informed client decision-making across diverse global industries, market sectors, and world regions every day.

About the Reviewer

Supradip Baul

Supradip Baul

Supradip Baul is an accomplished business consultant and strategist with over a decade of rich experience in market intelligence, strategy, technology, and business transformation. His work has included rigorous qualitative and quantitative analysis across multiple industries, helping clients shape investment decisions and long-term roadmaps. Earlier in his career, he was associated with Gartner, where he contributed to industry-leading reports and market share analyses. He has worked with leading global companies and holds an MBA with a dual specialization in Marketing and Finance.

Download Free Sample

Gustaf Hummel Burstrom

GUSTAF HUMMEL BURSTROM

Founder

Revline Tools AB

Joseph and the team at Next Move Strategy Consulting have been excellent to work with, in supplying us with relevant market data and forecasts for our specific category. We had some special requirements and they were able to do a custom package to suit our needs. We would definitely recommend them to any other company needing market data and forecasts

Amos Chang

AMOS CHANG

Strategy Consultant

Kardex Group

I have bought the intralogistics market reports from NMSC two times so far. Joseph and his team are always very helpful and flexible in responding to any customization requirements on the report. Their expertise in market reports really helps us steer the day-to-day business. I will definitely recommend and come back myself whenever there is a need.

Kishu Kanda

KISHU KANDA

Strategy Analyst

Accenture

We purchased the AI Consumer Market Report from this company. Not only did they customize the report to meet our specific requirements, but they also showed great flexibility in accommodating our budget. The report we received fully met our expectations. Additionally, they provided prompt and thorough responses to both our pre-purchase and follow-up questions. We look forward to working with this company again in the future.

Gaurav Jaiswal

GAURAV JAISWAL

Founder & CEO

Yano Charge Private Limited

The EV Charging market research report provided by the NextMSC was exceptionally detailed and insightful. It offered a comprehensive analysis that proved to be a game-changer for our strategic planning. Truly a testament to the NextMSC’s expertise and thoroughness in EV market landscape & analysis.

Diana Trejo

DIANA TREJO

Assistant Manager

Sumitomo Corporation de Mexico, S.A. de C.V.

Recently, we purchased a report on the Mexico Data Center Market from Next Move Strategy Consulting. The service has been excellent, with support that is always timely and thoroughly professional. The information provided is interesting, highly useful, and delivered with clarity. I would highly recommend NextMSC for anyone seeking insightful and dependable analysis.

Custom Market Research Services

We will customize the research for you if the listed report does not fully match your requirements.

Get 30% Free Customization

Select License

This website uses cookies to ensure you get the best experience on our website. Learn more

✖