PVC Pipe Market by Type (Plasticized, Unplasticized, and Chlorinated), Material (PVC Resin, Plasticizers, Stabilizers, Lubricant, Pigment Base, and Others), and Application (Irrigation, Water Supply, Plumbing, Sewerage, Oil & Gas, HVAC, and Others): Global Opportunity Analysis and Industry Forecast, 2020 – 2030
Industry: Retail and Consumer | Publish Date: 03-Jan-2025 | No of Pages: 262 | No. of Tables: 318 | No. of Figures: 263 | Format: PDF | Report Code : RC368
PVC Pipe Market Overview
At an estimated value of over USD 58.88 billion in 2019, the global PVC Pipe Market is predicted to thrive at a CAGR of 5.9% and valued at USD 101.62 billion over the forecast year 2020-2030.
Polyvinyl chloride is one of the largest-selling plastic commodities after polypropylene and polyethylene. They are popularly known for their high tensile strength, endurance to extreme temperature conditions, ductility, and corrosion resistance. These pipes have observed extensive demand over the last few years owing to their easy installation, lightweight, and low maintenance. PVC pipes are commonly used for various applications in drain-waste-vent (DWV), sewers, conduits, water service lines, water mains, irrigation, and various industrial installations.
Market Dynamics and Trends
Increasing adoption of PVC pipes in construction industries for applications such as water supply, housing & commercial, sewage & drainage, and irrigation is one of the major driving factors of the market. In addition to this, upsurge in demand for PVC pipes in several applications, and the excellent physical properties of such pipes boost demand for PVC pipes. However, factors such as the toxicity of PVC pipes expected to hamper the PVC market growth to some extent. On the other hand, the rising implementation of CPVC pipes is expected to provide opportunities to the market players during the forecast period.
Market Segmentations and Scope of the Study
The global PVC pipe market share is segmented on the basis of type, material, application, and geography. On the basis of type the market is segmented into plasticized, unplasticized, and chlorinated. According to the material, market is divided into PVC resin, plasticizers, stabilizers, lubricant, pigment base, and others. On the basis of application, the market is segmented into irrigation, water supply, plumbing, sewer & drain, oil & gas, HVAC, and others. Geographic fragmentation and analysis of each segment include regions comprising North America, Europe, Asia Pacific and RoW.
Geographical Analysis
In terms of geography, Asia-Pacific held major share of the PVC pipes market in 2019. This is due to the dominance of China being the largest producer as well as consumer of PVC pipes. In addition, expansion of industries such as construction, agriculture, and pharmaceutical in this region is contributing to the market growth. Moreover, India is significantly pushing the demand for PVC pipes to the north due to considerable investments in its agricultural and chemical industry. However, North America is expected to grow rapidly with increasing market size due to demand for PVC pipes in the construction and agriculture sectors across the U.S. and Canada.
Competitive Landscape
Maximum growth opportunities make the PVC pipe industry highly competitive. Some of the major players in the market are TRUFLO Pipes, Astral Pipes, Prince Pipes and Fittings Ltd., Supreme Industries, Formosa Plastics Corporation, Total Plastics International, JM Eagle Inc., Diamond Plastic Corporation, National Pipe & Plastics, IPEX Inc., Omsree Group, Apollo Pipes, Plasto Group of Companies , Finolex Industries Ltd., Hindustan Pipe. and many more. Several developmental strategies have been adopted by companies in the past few years.
For instance, in October 2018, Royal Building Products partnered with Midwest Lumber, a division of US Lumber. Through this partnership, Midwest Lumber is projected to be a new full-line distributor of Royal PVC trim and moldings product lines.
Key Benefits
-
The PVC pipe market report provides a quantitative analysis of the current market and estimations through 2020-2030 that assist in identifying the prevailing market opportunities to capitalize on.
-
The study comprises an extensive analysis of the PVC pipe market trend including the current and future trends for depicting the prevalent investment pockets in the market
-
The information related to key drivers, restraints and opportunities and their impact on the PVC pipe market is provided in the report.
-
The market share of the players in the global market along with their competitive analysis.
-
Value chain analysis in the market study provides a clear picture of the stakeholders’ roles.
PVC Pipe Market Key Segments
By Type
-
Rigid PVC Pipes
-
Flexible PVC Pipes
-
CPVC (Chlorinated PVC) Pipes
-
OPVC (Oriented PVC) Pipes
-
Others
By Material
-
PVC Resin
-
Plasticizers
-
Stabilizers
-
Pigment Base
-
Others
By Application
-
Irrigation
-
Water Supply
-
Plumbing
-
Sewer & Drain
-
Heating, Ventilation and Air Conditioning (HVAC)
-
Others
By End User
-
Residential
-
Commercial
-
Industrial
-
Chemical
-
Oil & Gas
-
Agriculture
-
Others
By Geography
-
North America
-
U.S.
-
Canada
-
Mexico
-
-
Europe
-
UK
-
Italy
-
Germany
-
Spain
-
Netherlands
-
Rest of Europe
-
-
Asia-Pacific
-
China
-
Japan
-
India
-
Australia
-
South Korea
-
Taiwan
-
Vietnam
-
Rest of Asia Pacific
-
-
RoW
-
Latin America
-
Middle East
-
Africa
-
Key Players
-
TRUFLO Pipes
-
Astral Pipes
-
Prince Pipes and Fittings Ltd.
-
Supreme Industries
-
Formosa Plastics Corporation
-
Total Plastics International
-
JM Eagle Inc.
-
Diamond Plastic Corporation
-
National Pipe & Plastics
-
IPEX Inc.
-
Omsree Group
-
Apollo Pipes
-
Plasto Group of Companies
-
Finolex Industries Ltd.
-
Hindustan Pipe
REPORT SCOPE AND SEGMENTATION
|
Parameters |
Details |
|
Analysis Period |
2019–2030 |
|
Base Year Considered |
2020 |
|
Forecast Period |
2020–2030 |
|
Market Size Estimation |
Billion (USD) |
|
Market Segmentation |
By Type (Plasticized, Unplasticized,, Chlorinated) By Material (VC Resin, Plasticizers, Stabilizers, Lubricant, Pigment Base, Others) By Application (Irrigation, Water Supply, Plumbing, Sewer & Drain, Oil & Gas, Heating, Ventilation and Air Conditioning (HVAC), Others) |
|
Geographical Segmentation |
North America (U.S., Canada, Mexico) Europe (UK, Italy, Germany, Spain, Netherlands, Rest of Europe) Asia-Pacific (China, Japan, India, Australia, South Korea, Taiwan, Vietnam, Rest of Asia Pacific) RoW (Latin America, Middle East, Africa) |
|
Companies Profiled |
Advanced Drainage Systems, Inc., Egeplast a.s., China Lesso Group Holdings Ltd., Finolex Industries Ltd, IPEX Inc., North American Pipe Corporation, JM Eagle Company, Inc., Pipelife International GmbH, Royal Building Products, Sekisui Chemical Company Ltd, Plastika AS, Polypipe Plc, Tessenderlo Group, Tigre SA, and Formosa Plastics Group. |
")


About the Author
 Jayanta Das is an industry analyst and writer with a keen focus on emerging technologies and sustainable business practices. With a background in engineering and market research, he brings analytical depth to topics like renewable energy, green manufacturing, and industrial transformation. Jayanta is passionate about translating complex data into actionable insights for businesses navigating the shift toward eco-conscious operations.
About the Reviewer
 Supradip Baul is an accomplished business consultant and strategist with over a decade of rich experience in market intelligence, strategy, technology and business transformation. His work has included rigorous qualitative and quantitative analysis across multiple industries, helping clients shape investment decisions and long-term roadmaps. Earlier in his career, he was associated with Gartner, where he contributed to industry-leading reports and market share analyses. He has worked with leading global companies and holds an MBA with a dual specialization in Marketing and Finance.
At Next Move Strategy Consulting, we understand that insightful market research is the cornerstone of successful business decisions. That's why we employ a robust and multifaceted approach, combining various methodologies to deliver the most accurate and actionable data for our clients.
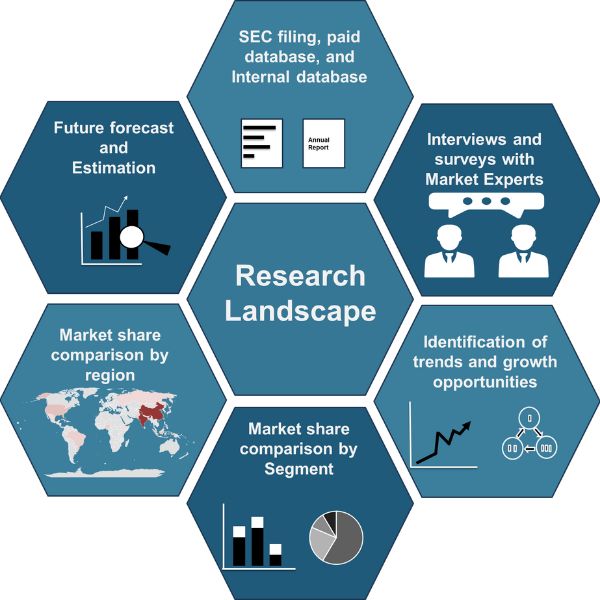
Research Landscape
We navigate the world of research with two primary approaches:
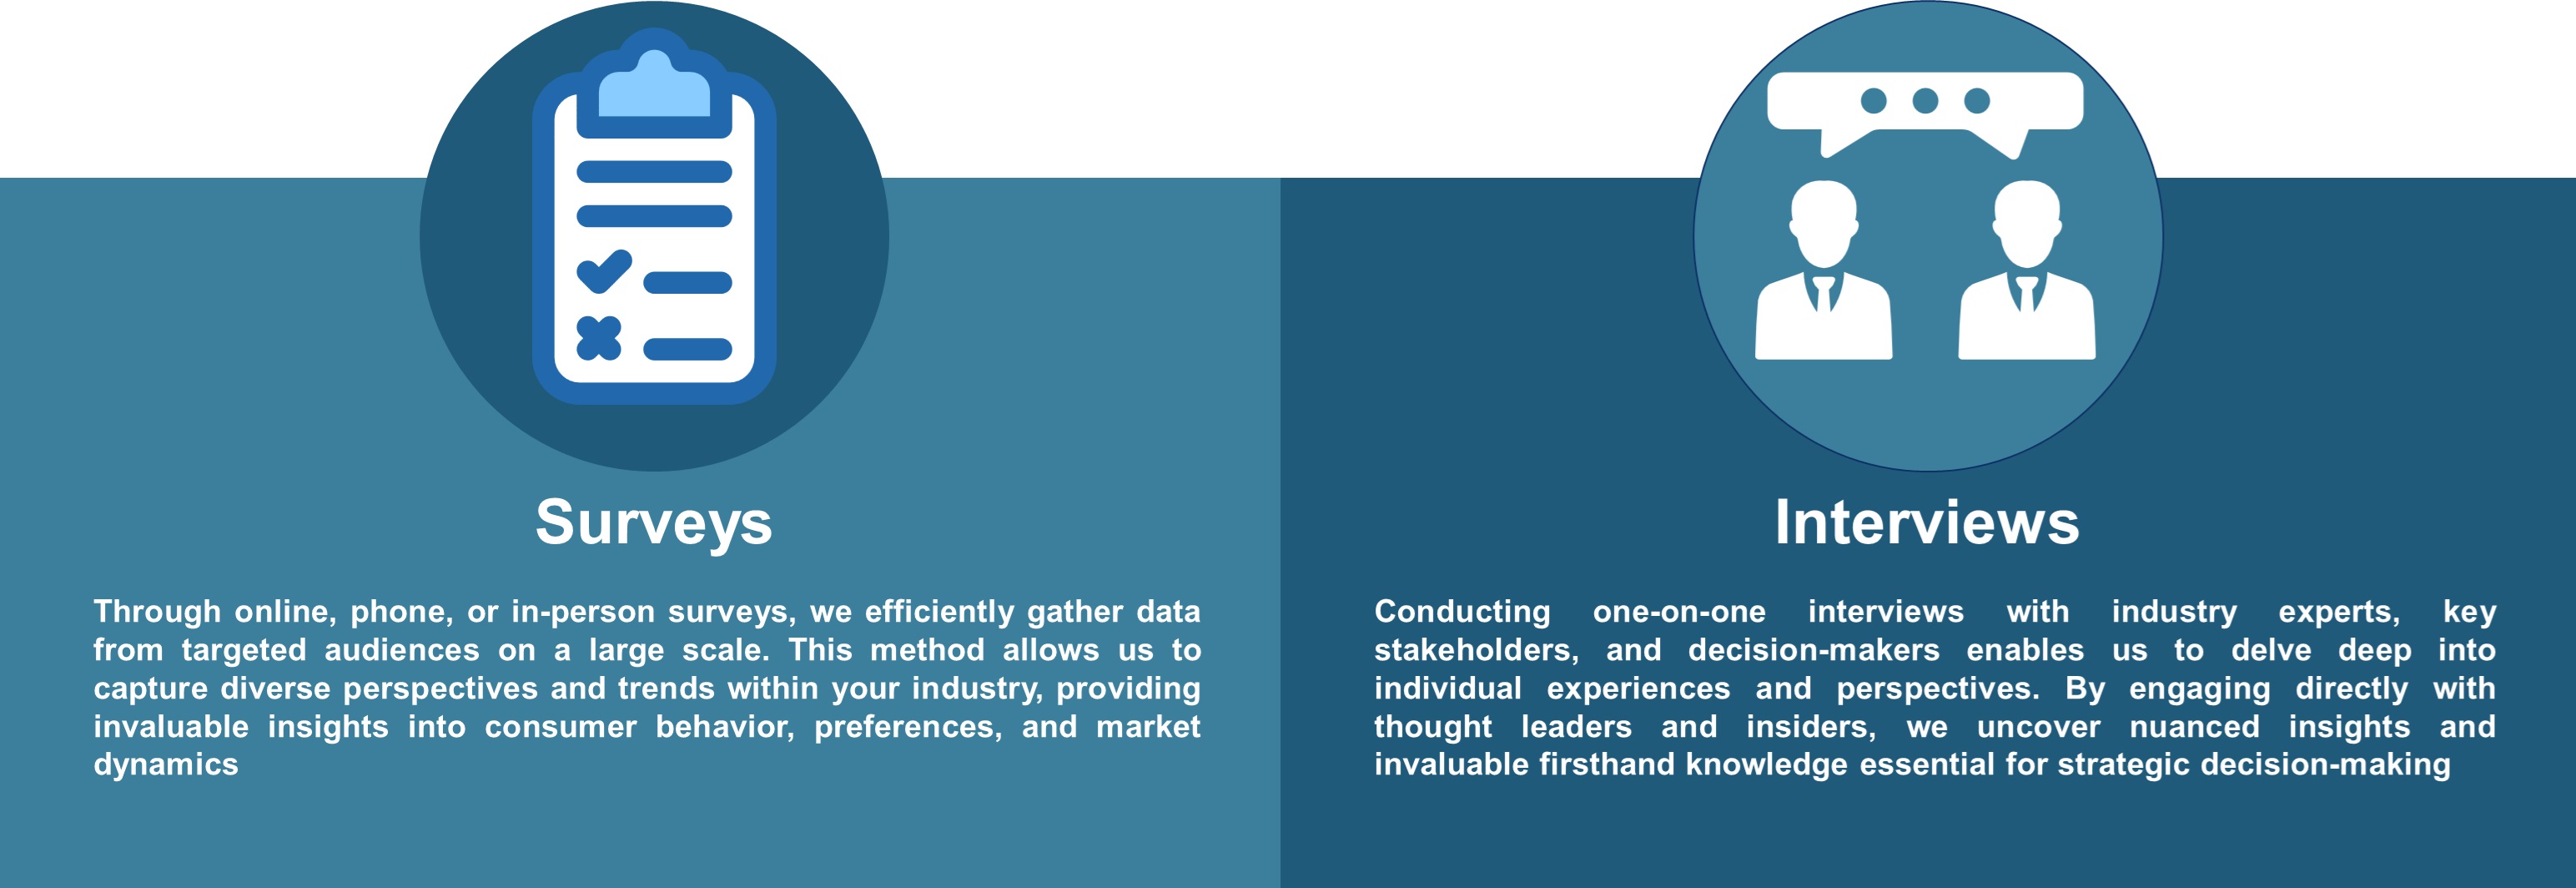
Qualitative Approach
Our qualitative research methodologies involve immersive techniques such as in-depth interviews, focus groups, and observational studies. By engaging directly with individuals and stakeholders, we uncover valuable insights that quantitative data alone may overlook.
Quantitative Research
In tandem with qualitative methodologies, NMSC leverages the power of Quantitative Research to provide a robust foundation of numerical insights. Through systematic data collection and analysis, we quantify patterns, preferences, and market trends, offering a comprehensive view of the business landscape.
Our quantitative research approach employs diverse tools, including surveys, experiments, and statistical modelling. These methodologies enable us to gather data from a large and representative sample, ensuring the statistical significance of our findings. By employing structured questionnaires and standardized data collection methods, we guarantee the reliability and validity of the information we present to our clients.
Quantitative research is particularly effective in measuring the prevalence of trends, assessing market size, and gauging the impact of various factors on consumer behavior. The numerical precision attained through this approach equips our clients with actionable insights, facilitating data-driven decision-making and strategy formulation.
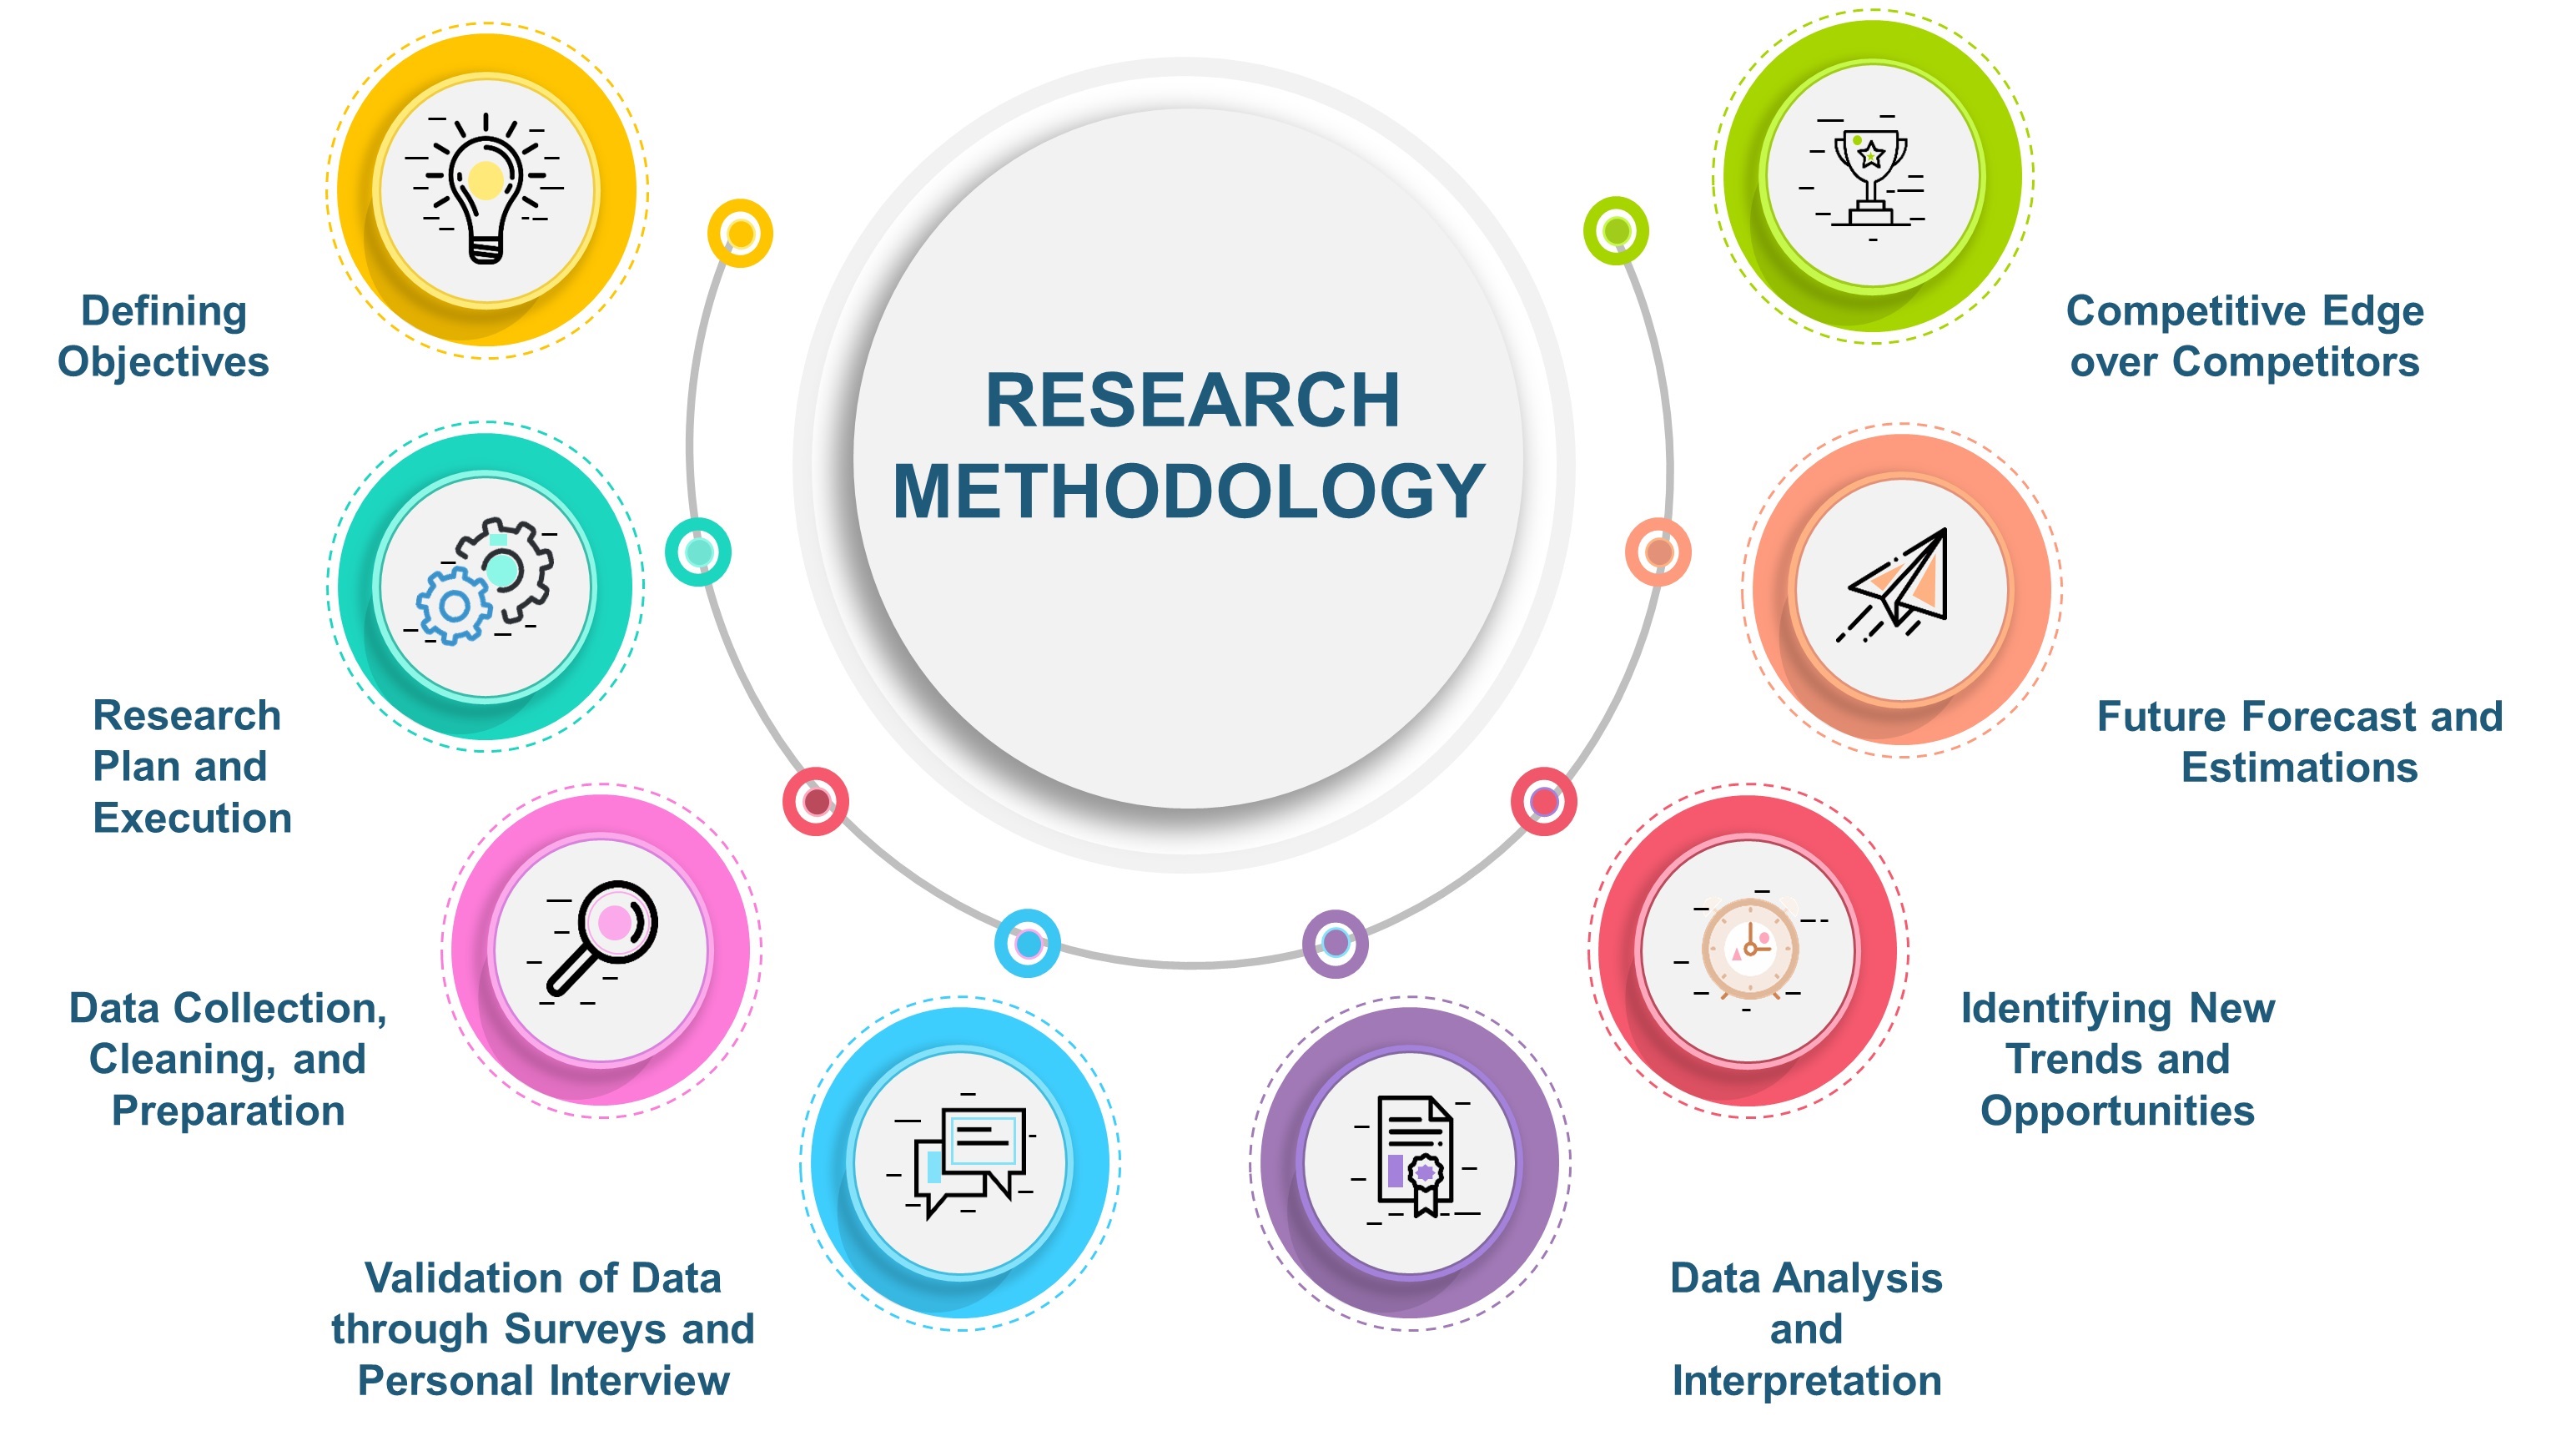
Our Specialized Toolbox for Industry-Specific Market Research
We deploy a specialized arsenal of techniques tailored to meet your unique requirements. Here's a glimpse into our comprehensive toolbox:
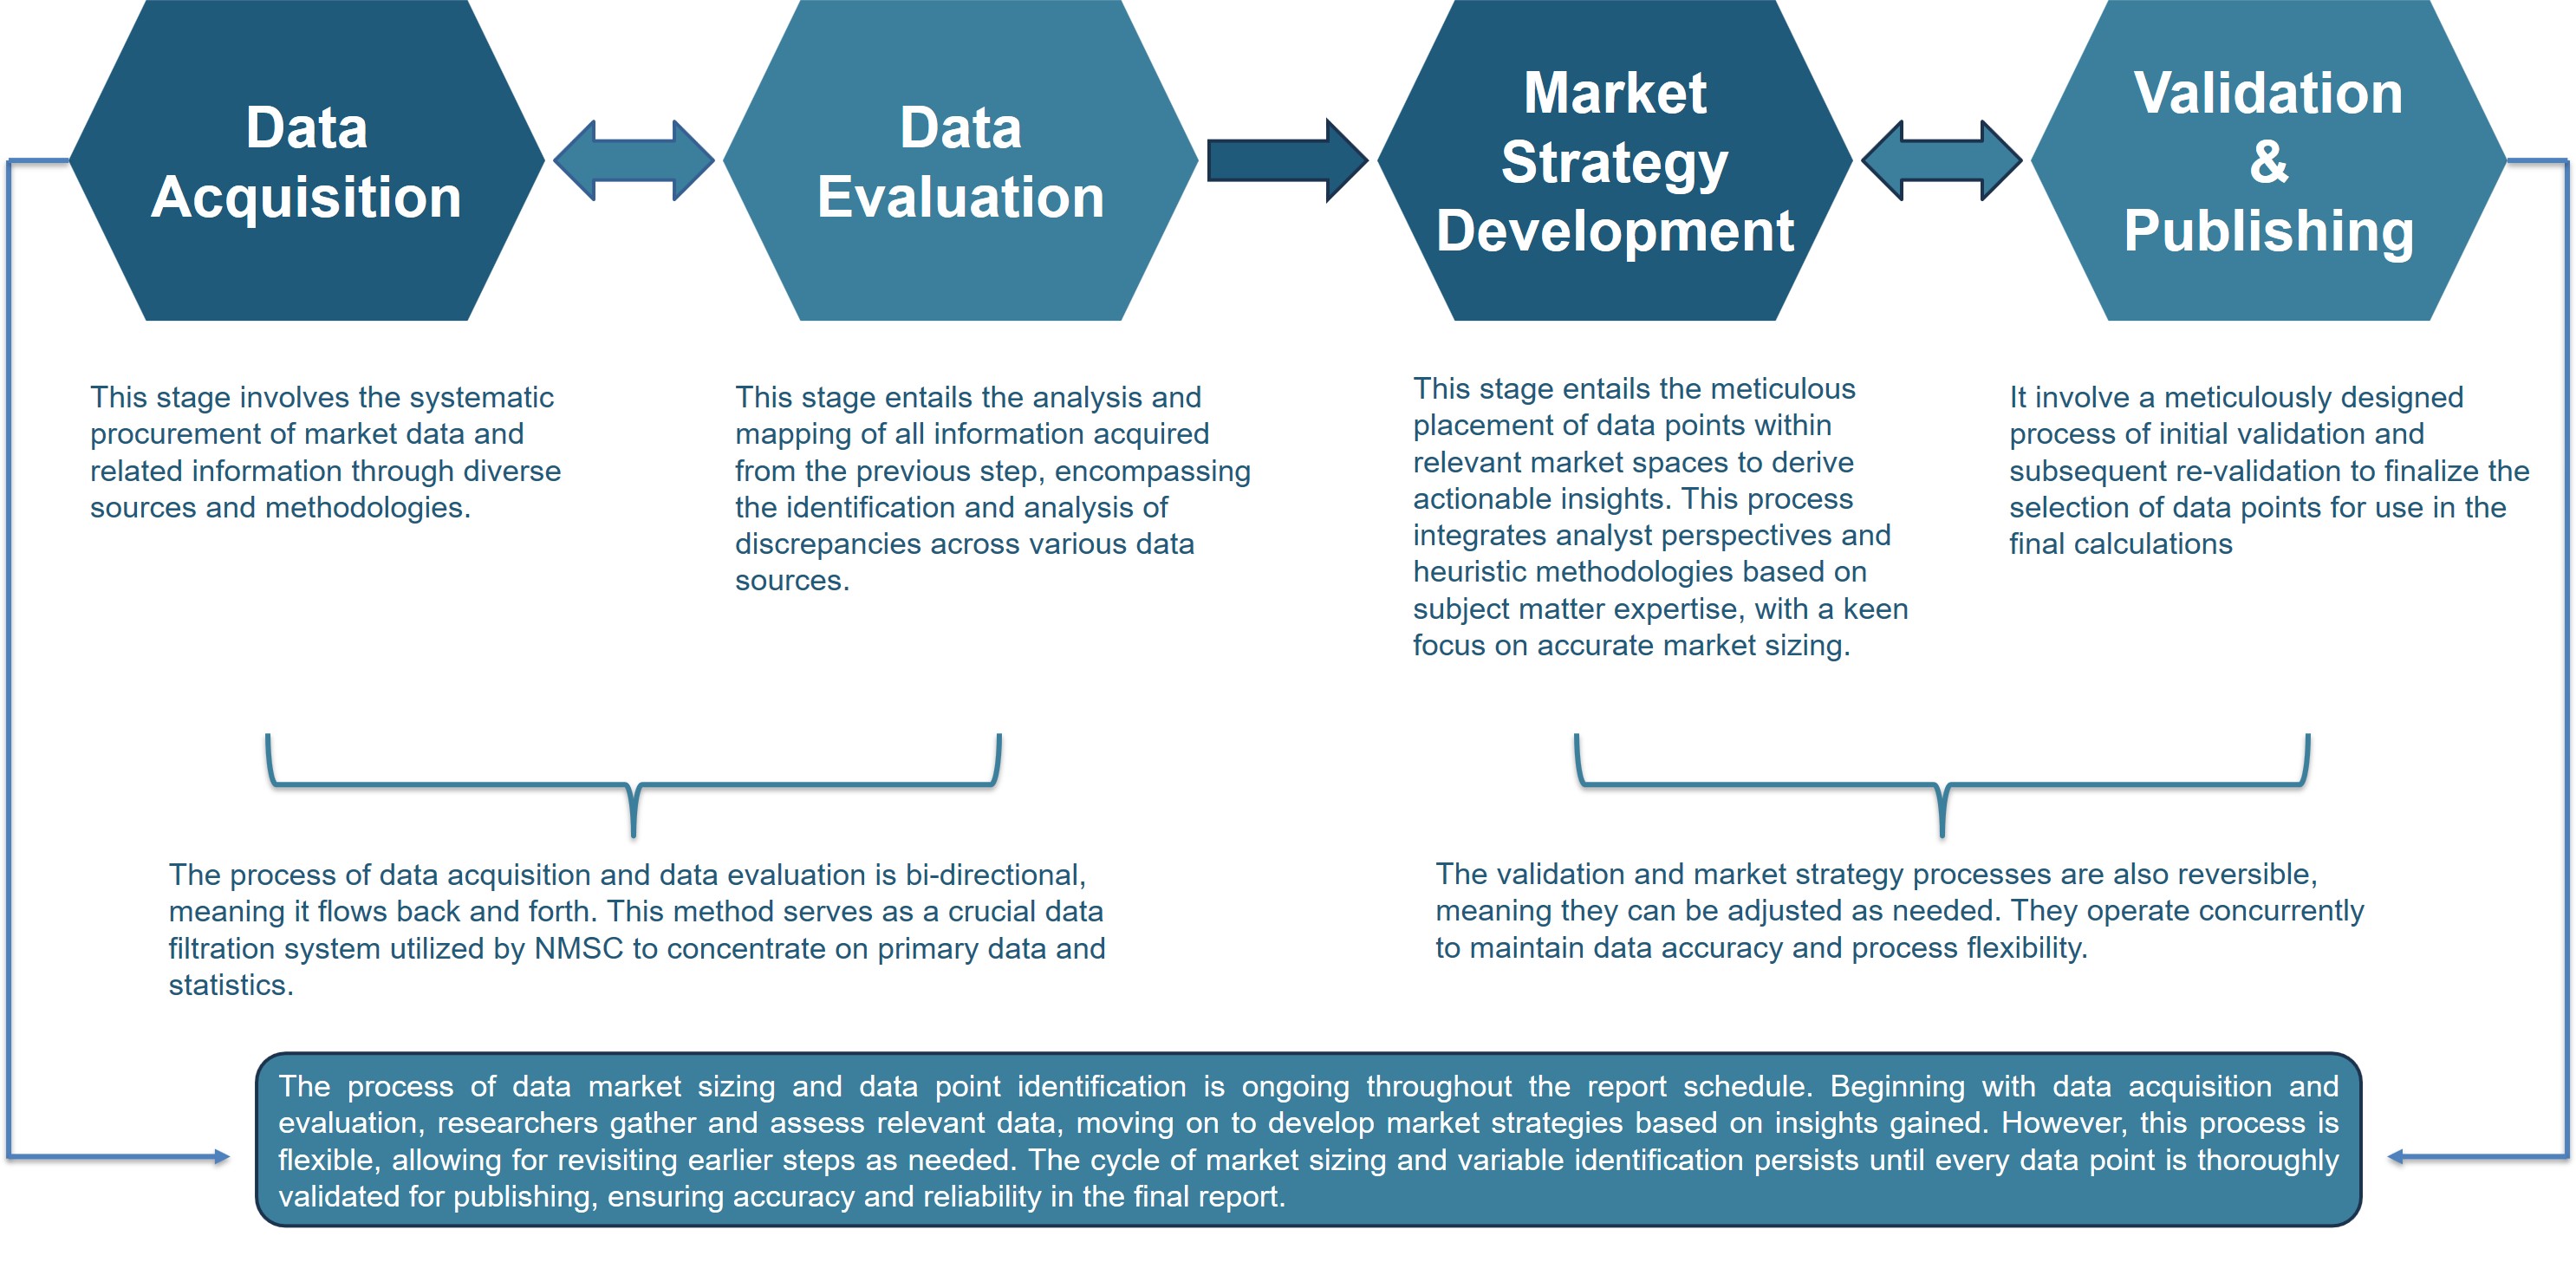
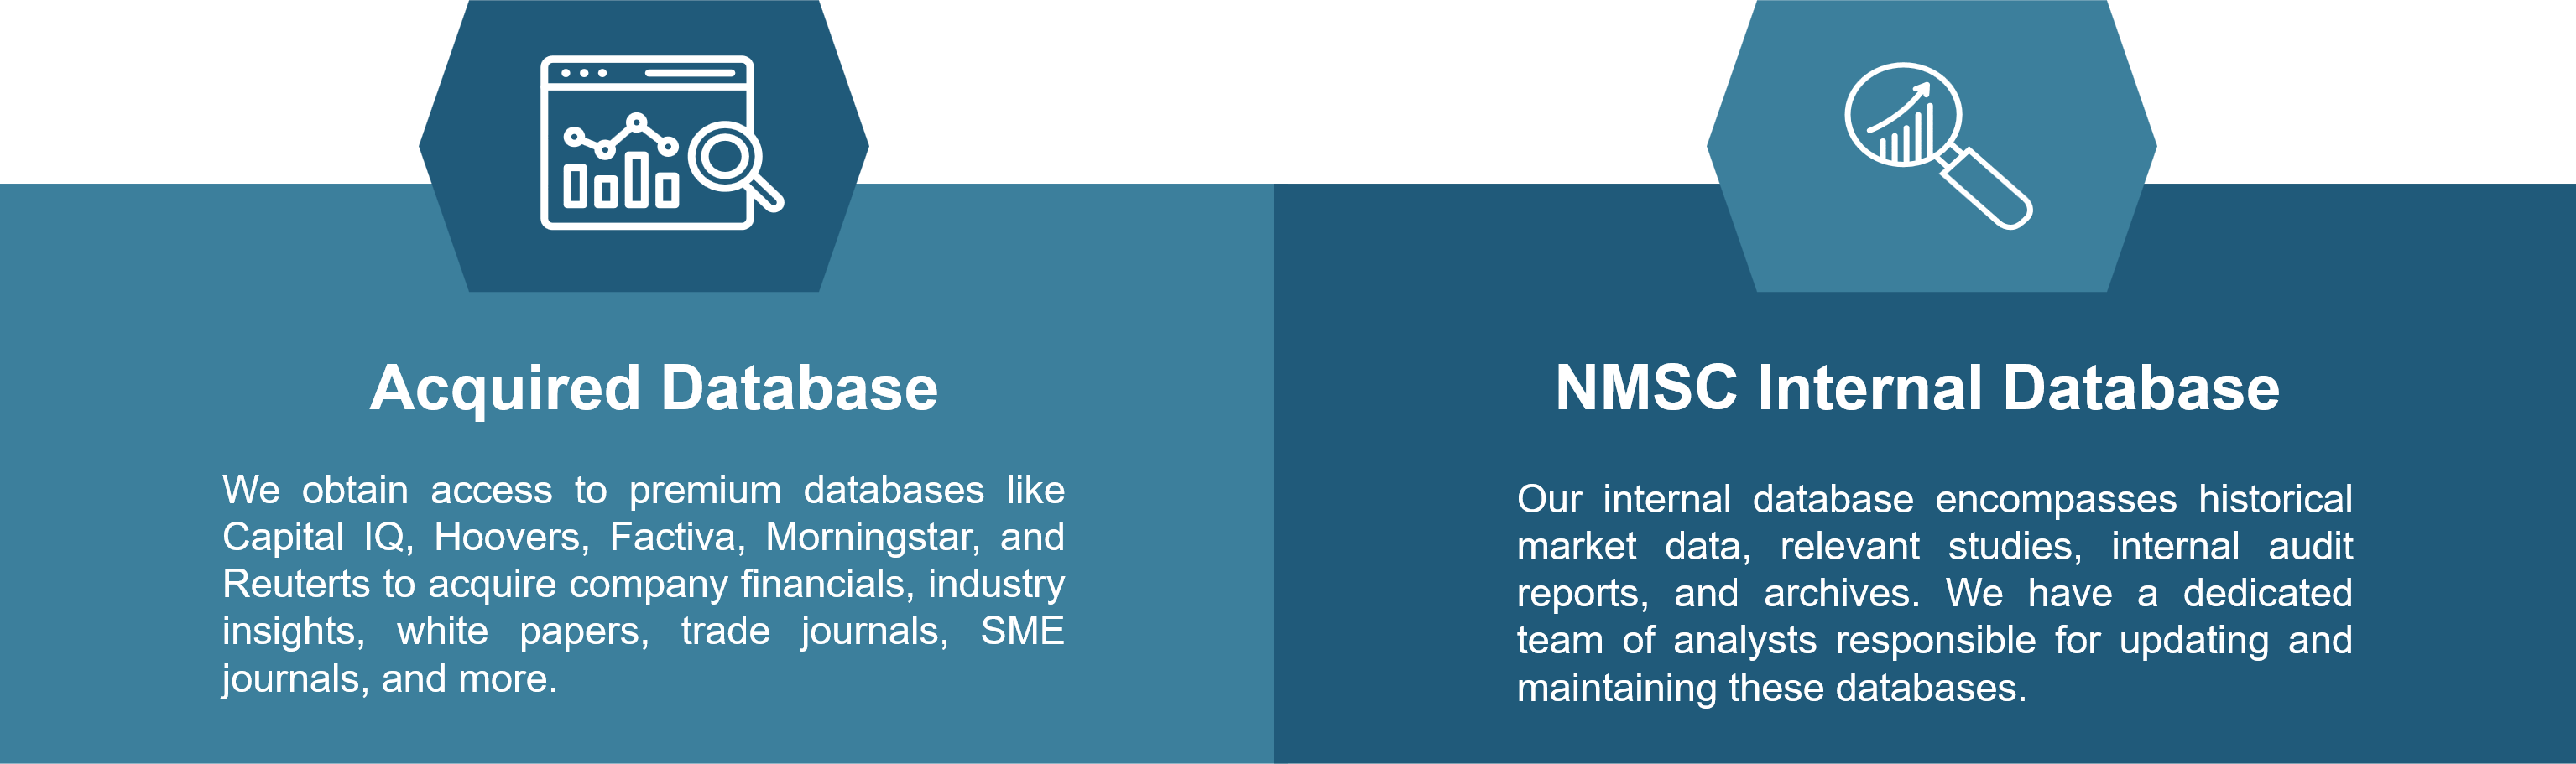
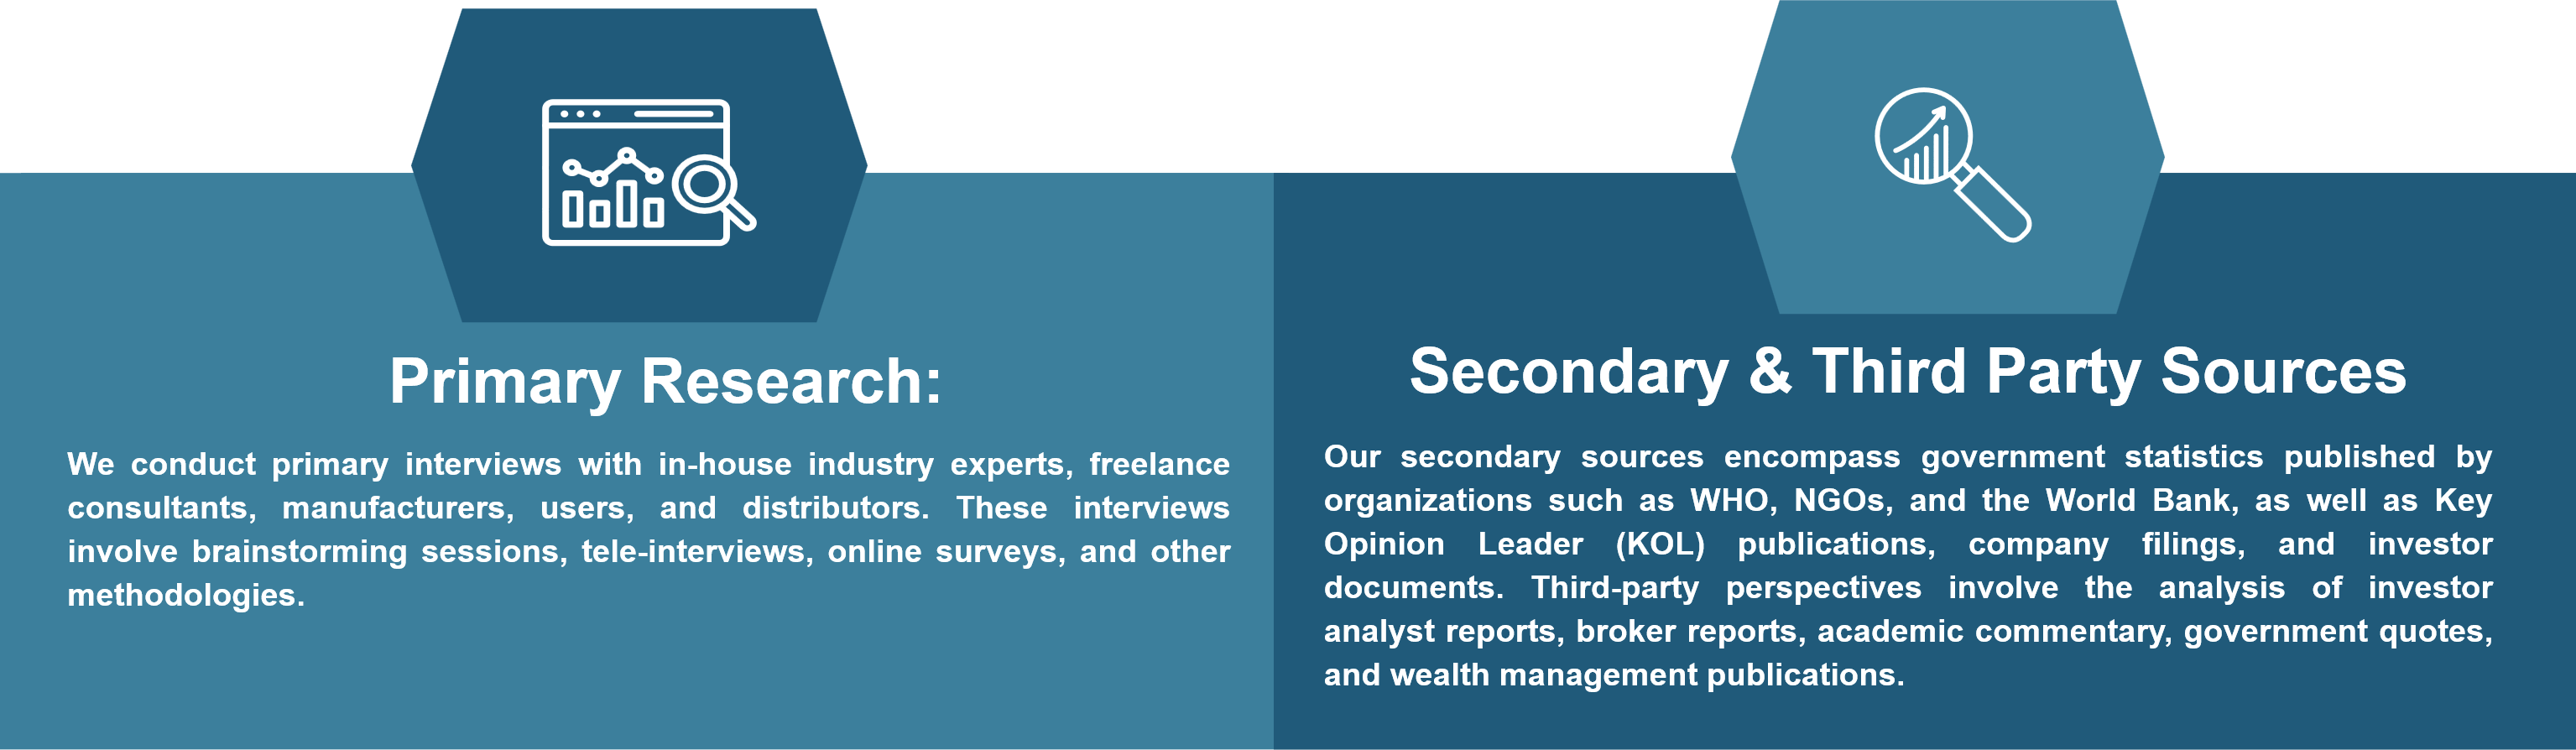
Information Procurement
The stage entails acquiring market data or relevant information through various sources and methodologies.
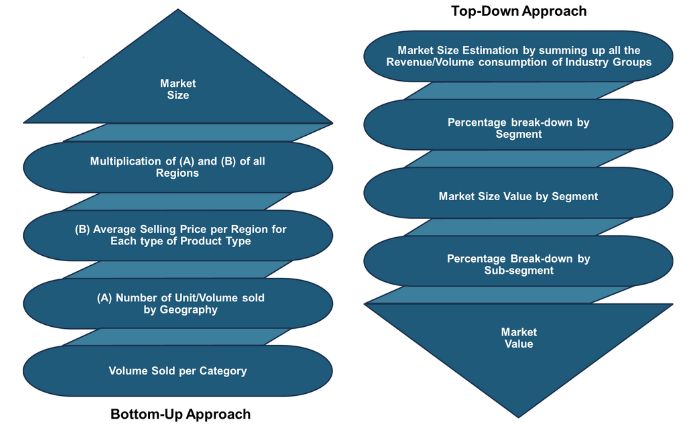
Market Research Approach
We utilize both top-down and bottom-up approaches in market research analysis to achieve a comprehensive understanding of the market dynamics, leveraging the broad perspective of industry trends and macroeconomic factors alongside detailed insights from specific segments and individual companies.
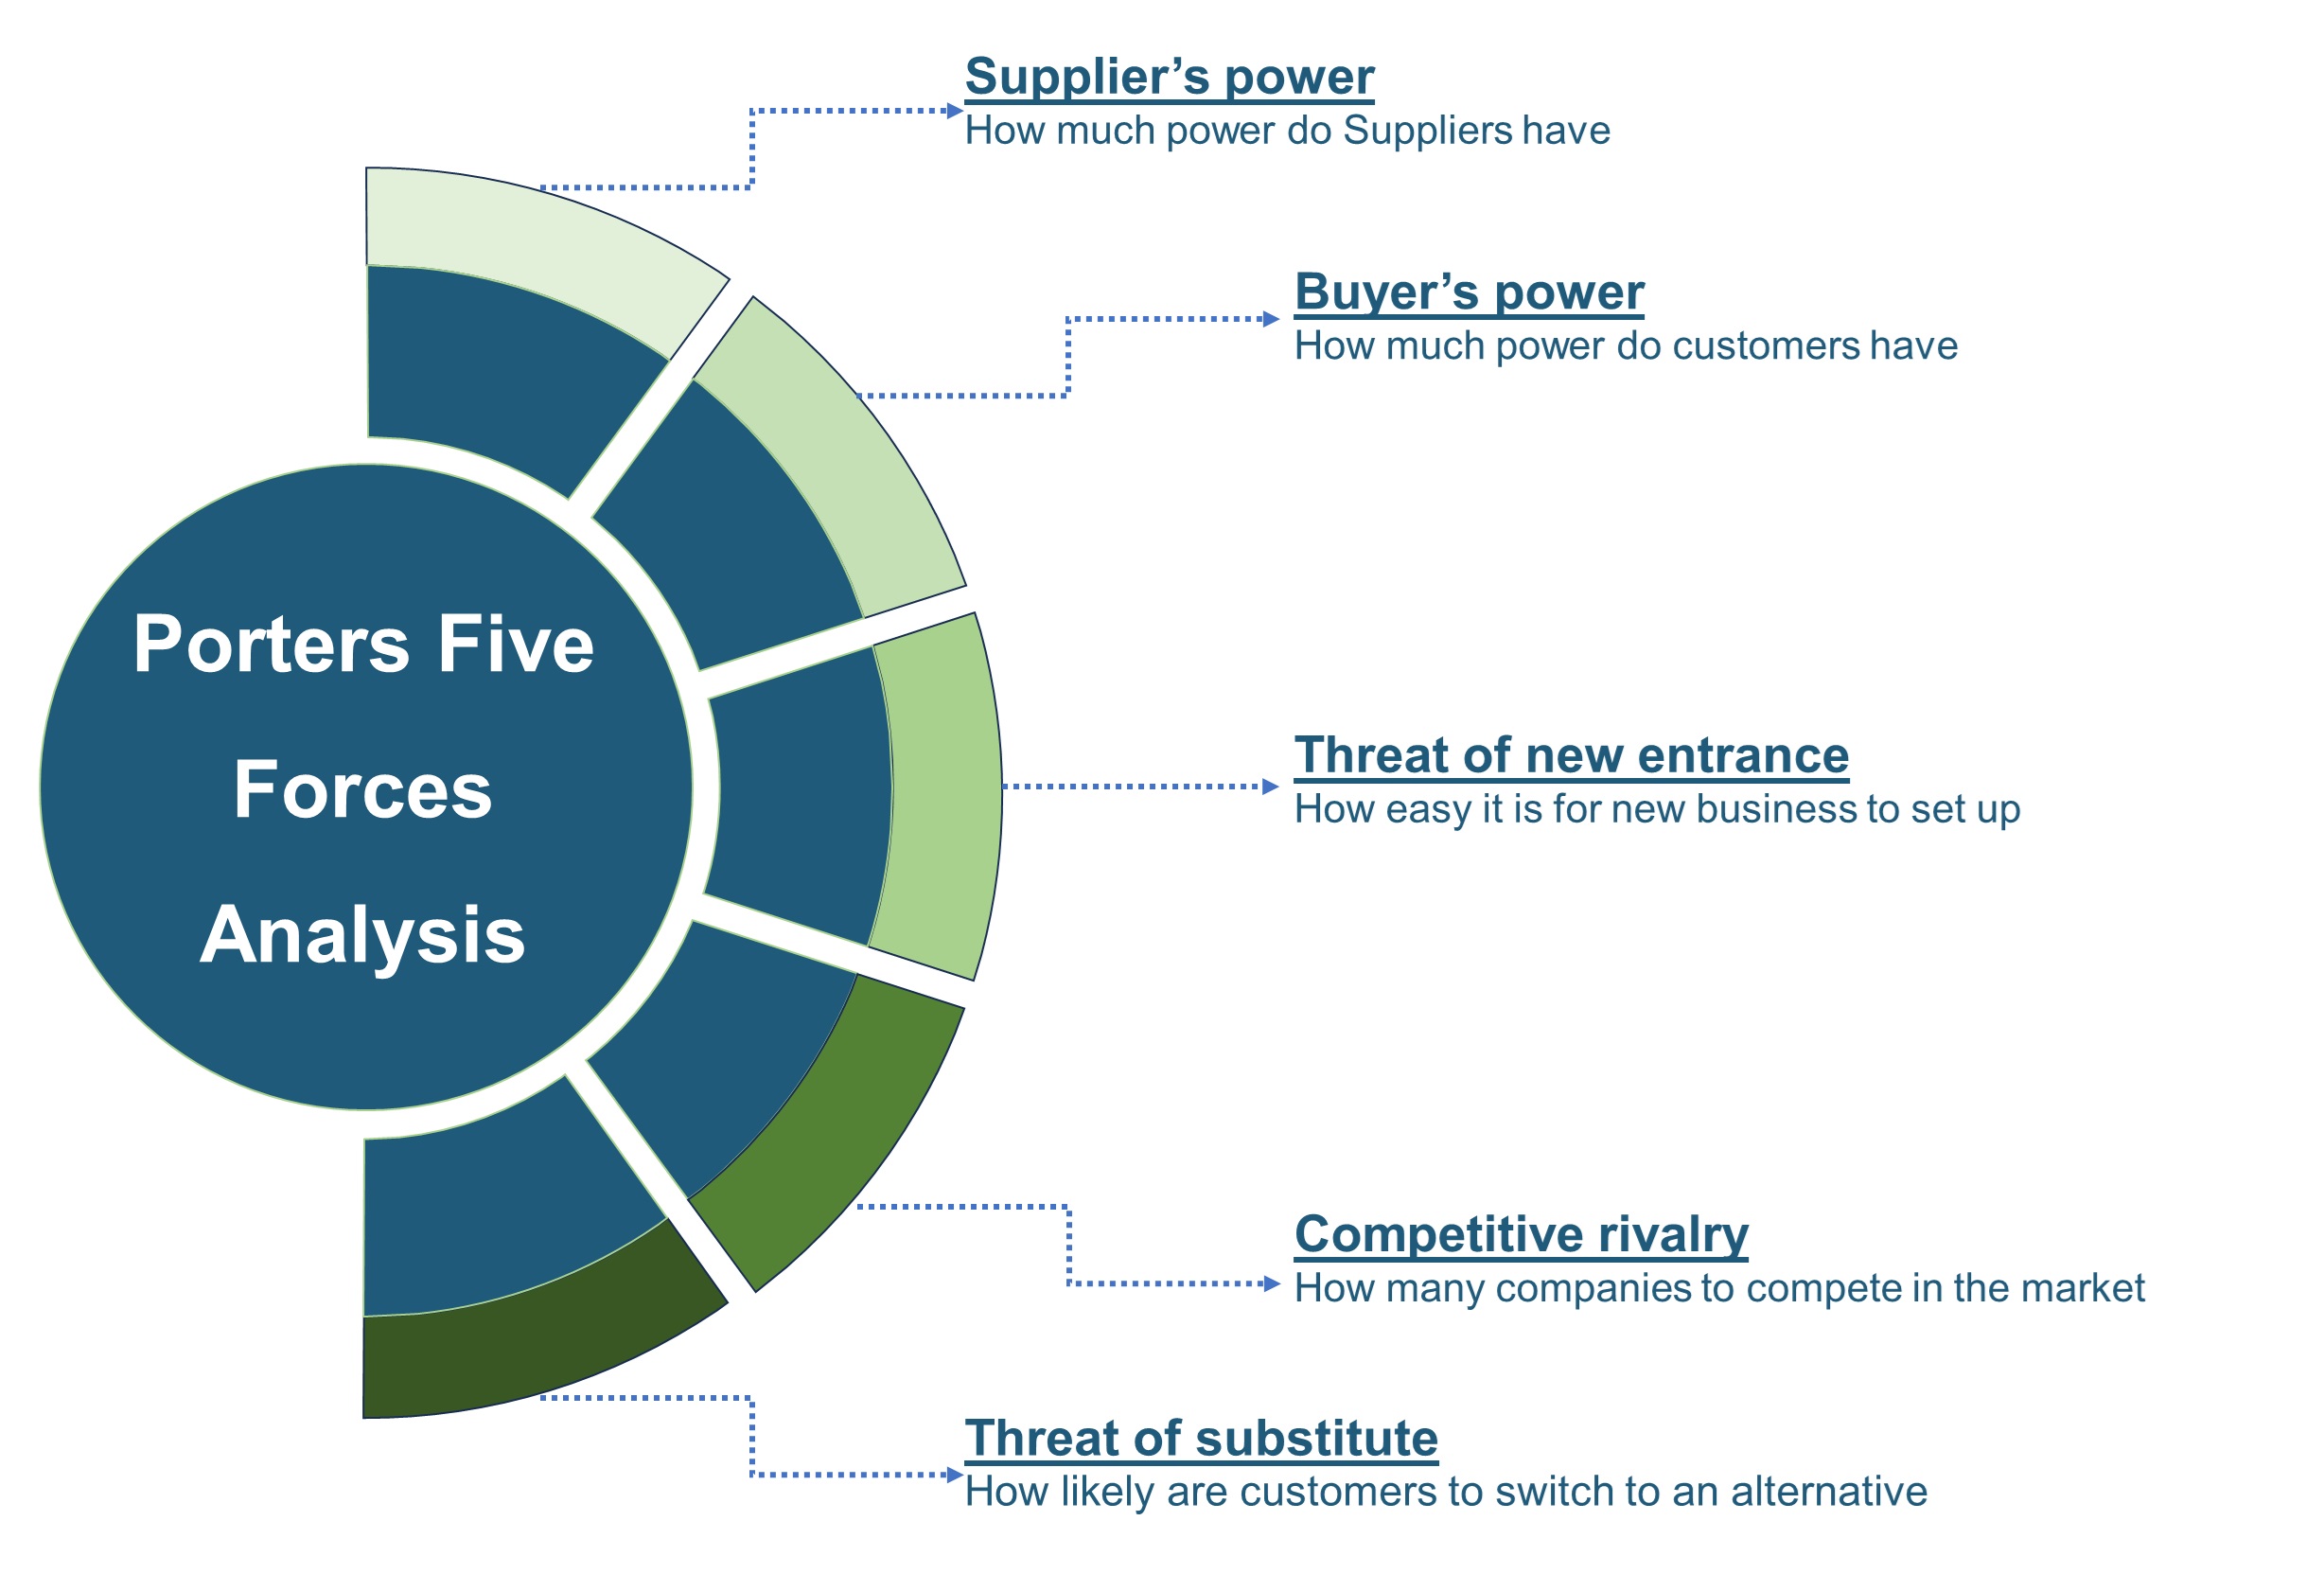
Porters Five Forces Analysis
We conduct Porter's Five Forces analysis to evaluate the competitive landscape of an industry, providing us with insights into factors that affect profitability and strategic positioning.
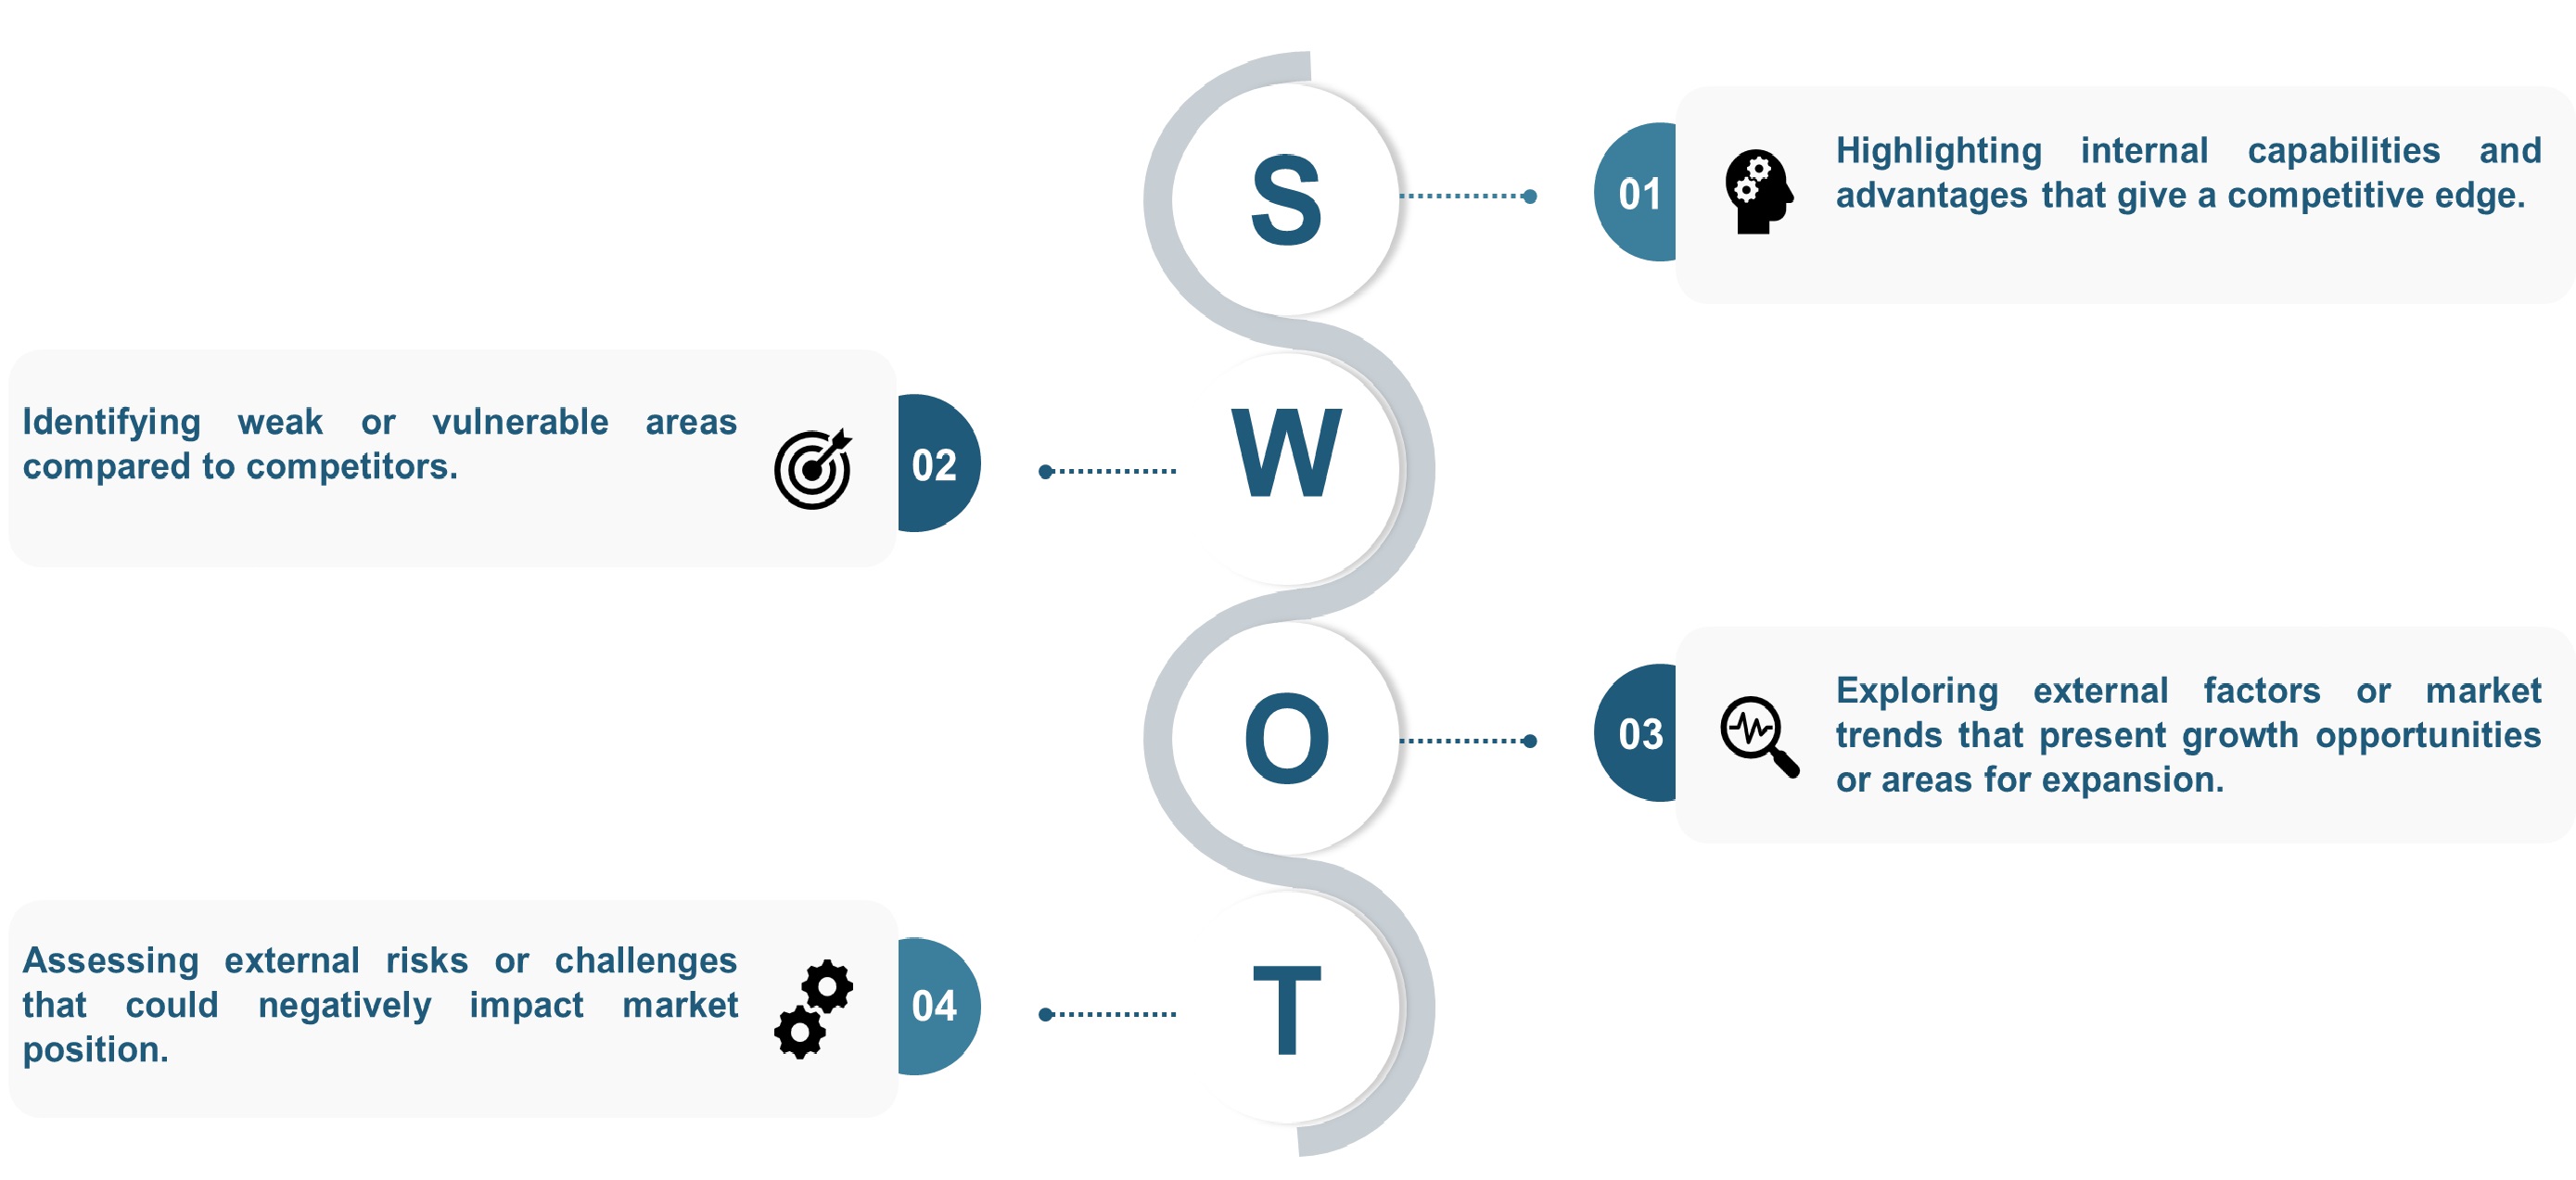
SWOT Analysis
We conduct SWOT analysis to understand market trends, identify potential threats, capitalize on opportunities, and assess our strengths and weaknesses.
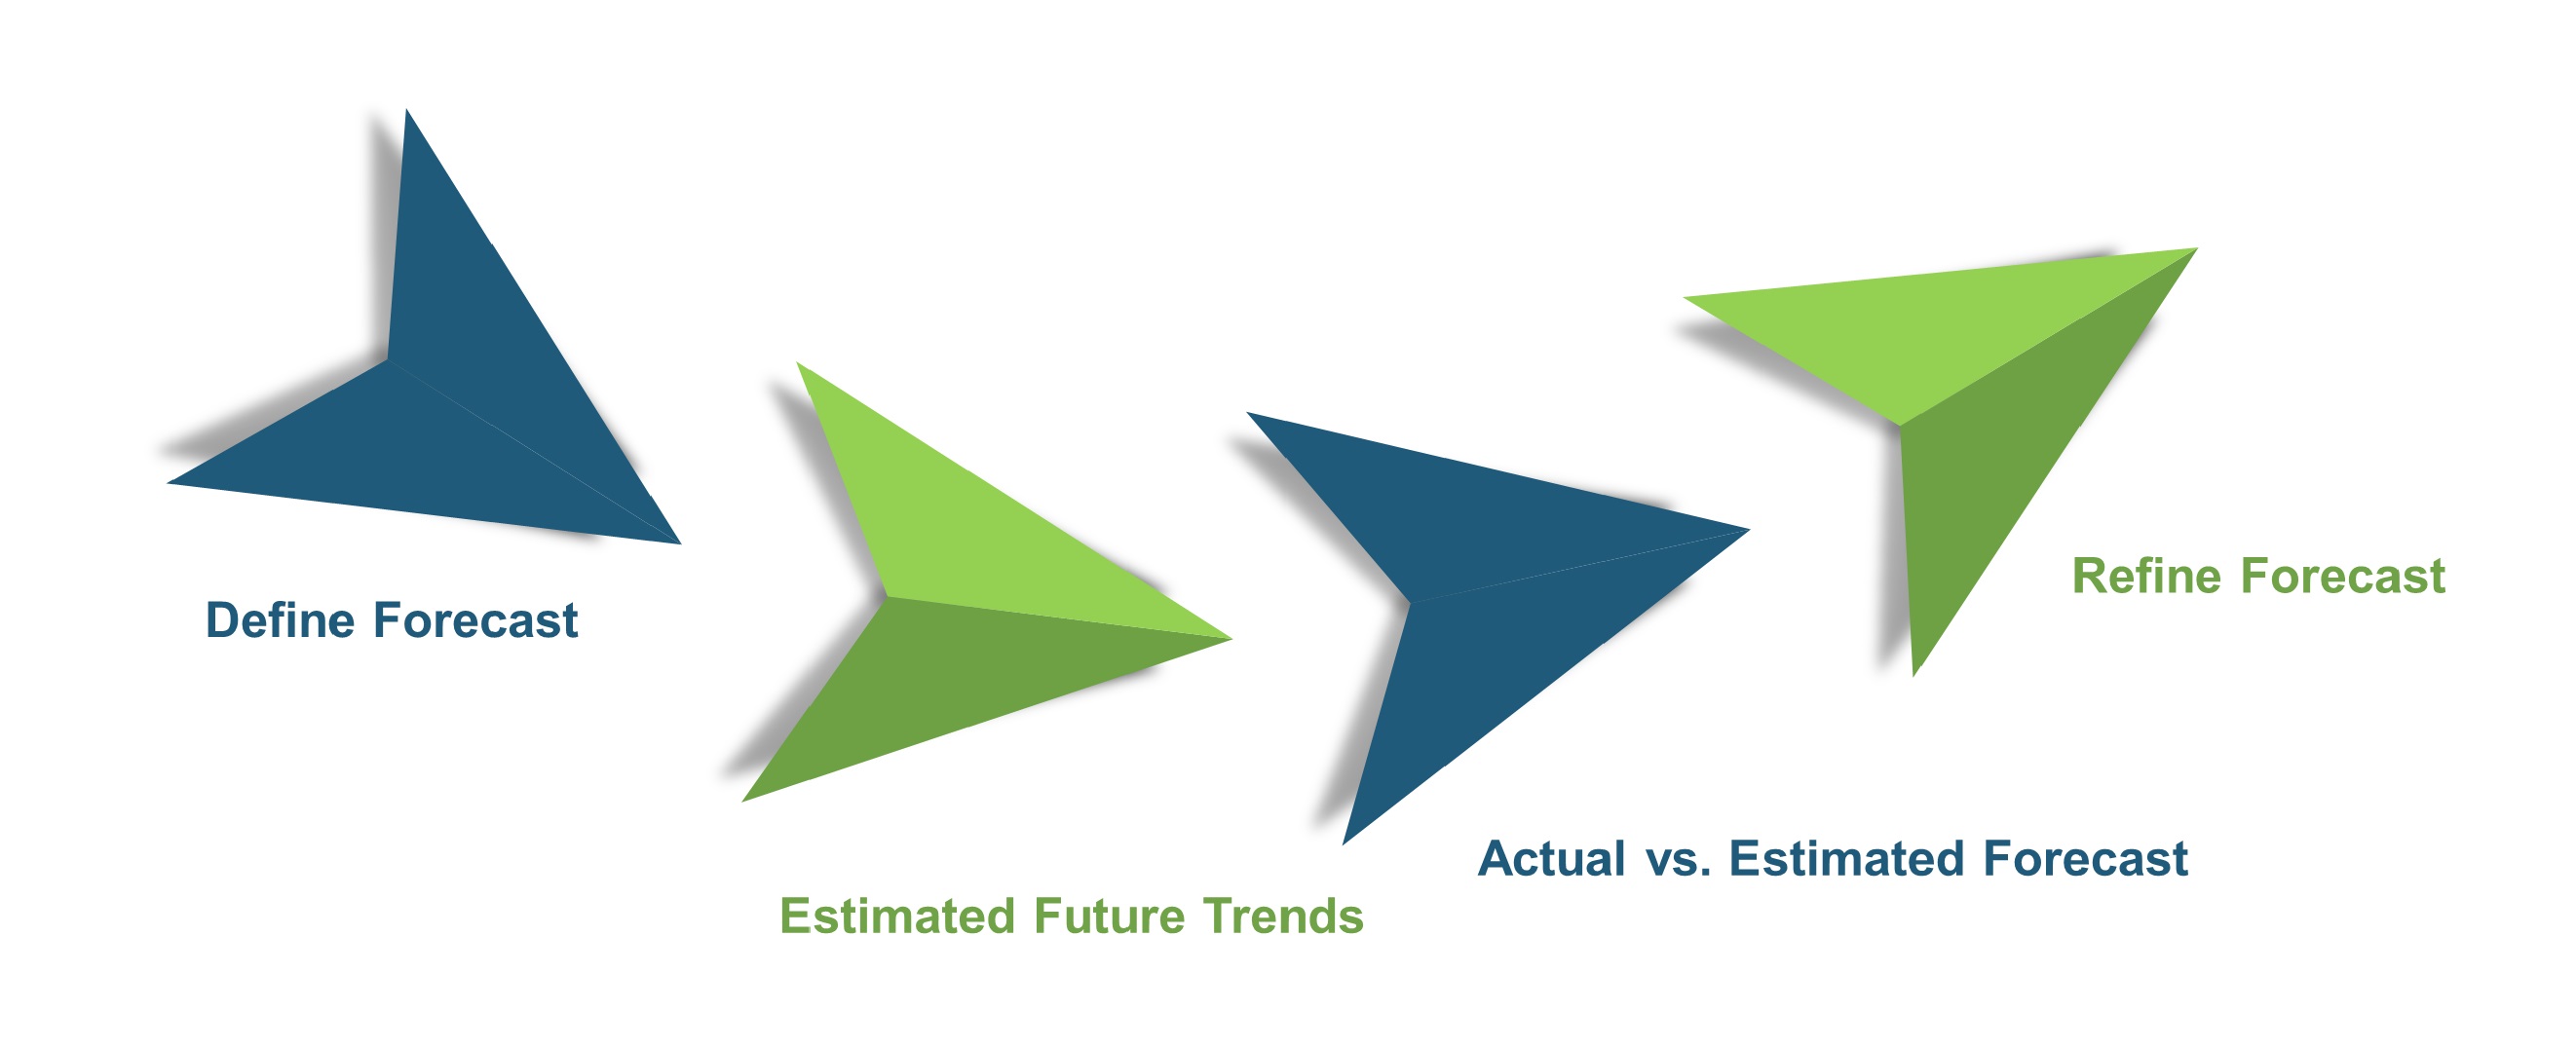
Forecasting
We utilize a forecasting model to predict future consumption by considering parameters like population, economics, regulations, market competition, drivers, constraints, technology, and pricing. We also employ statistical techniques such as multilinear regression, exponential smoothing, moving average, ARIMA, and Monte Carlo simulations for accurate predictions. In econometric forecasting, we analyzed short-term and long-term event impacts, attributing values based on regulatory frameworks, economic factors, and market events.


 Speak to Our Analyst