Smart Transformer Market Global Industry Analysis and Forecast (2026–2035)

The global Smart Transformer Market size was valued at USD 4.06 billion in 2025 and is estimated at USD 5.54 billion in 2026, forecast to reach USD 18.91 billion by 2035, expanding at a 14.6% CAGR between 2026 and 2035. North America leads with approximately 32% share, while Distribution Transformers dominate all other transformer types with approximately 53% share.
Download Free Sample PDF
Base Year (2025)
$4.06 Billion
Forecast (2035)
$18.91 Billion
CAGR (2026-2035)
14.6%
Top Region
North America

What Is the Smart Transformer Market Size?
The global Smart Transformer Market reached USD 4.06 Billion in 2025 and is estimated at USD 5.54 Billion in 2026, forecast to reach USD 18.91 Billion by 2035 at a CAGR of 14.6% between 2026 and 2035. North America leads with approximately 32% revenue share in 2025, while distribution transformers are the dominant type at approximately 53%.
We observed that utilities no longer buy transformers as passive assets, because embedded sensors, communication modules and analytics now turn each unit into a measurable grid node that reports temperature, load, gas and vibration data. This shift moves purchasing criteria from lowest unit price toward lifetime reliability, data access and supplier service capability.

Smart Transformer Market Global Industry Analysis and Forecast (2026–2035) Revenue Forecast

Values in USD Billion

2025 $4.06 Billion
2025
2026 $5.54 Billion
2026
2027 $6.35 Billion
2027
2028 $7.28 Billion
2028
2029 $8.34 Billion
2029
2030 $9.56 Billion
2030
2031 $10.95 Billion
2031
2032 $12.55 Billion
2032
2033 $14.38 Billion
2033
2034 $16.48 Billion
2034
2035 $18.91 Billion
2035

Key Takeaways

By Transformer type: Distribution transformers held the largest share, expanding from USD 2.15 Billion in 2025 to USD 8.50 Billion by 2035; Solid state transformers are the fastest growing at 24.8% CAGR from 2026–2035.

By Offering: Hardware held the largest share, expanding from USD 2.84 Billion in 2025 to USD 11.62 Billion by 2035; Services is the fastest growing at 18.7% CAGR from 2026–2035.

By End user: Utilities held the largest share, expanding from USD 2.03 Billion in 2025 to USD 7.95 Billion by 2035; Commercial and data centers is the fastest growing at 17.9% CAGR from 2026–2035.

Dominant Region: North America dominated with approximately 32% revenue share in 2025 at USD 1.30 Billion, anchored by aging utility fleets and data center load growth.

Fastest-Growing Region: Middle East & Africa is expected to register the highest CAGR of 19.2% during 2026–2035, driven by national grid expansion programs.

Dominant Country: The U.S. led the market with an estimated USD 1.02 Billion in 2025, supported by the largest utility asset base and data center demand.

Fastest-Growing Country: Saudi Arabia is projected to expand from USD 0.08 Billion in 2025 at a CAGR of approximately 20.0% from 2026–2035, driven by transmission and distribution build out.

Market Opportunity: The market presents an absolute opportunity of approximately USD 13.37 Billion between 2026 and 2035, calculated as the 2035 forecast of USD 18.91 Billion minus the 2026 estimate of USD 5.54 Billion. This positions monitoring hardware, analytics subscriptions and solid state platforms as the most capital efficient entry points for equipment investors.

According to NMSC analysis, the shift from time based inspection to condition based maintenance is the most structurally significant change underway. It lets utilities defer replacement of aging units while still lowering failure risk, and it creates recurring analytics and service revenue for suppliers that own the data pipeline from sensor to dashboard.

What Does the Smart Transformer Market Encompass?

The Smart Transformer Market covers power, distribution and solid state transformers that integrate embedded sensors, communication interfaces and analytics software to report condition, load and health data. It includes the transformer unit with its monitoring hardware, software platforms for diagnostics and asset management, and associated installation and monitoring services. The scope excludes conventional transformers fitted only with standalone third party meters and broader grid automation equipment. Utilities, renewable developers, industrial plants and data center operators are the primary buyers.

Regulation shapes both demand and design. The U.S. Department of Energy finalized distribution transformer efficiency standards in April 2024, with compliance required for units made on or after 23 April 2029, while the European Union Ecodesign rules under Regulation 548/2014 and Regulation 2019/1783 set minimum efficiency levels for transformers sold in Europe. Communication functions typically follow IEC 61850 for utility automation interoperability. NMSC's analysis indicates that efficiency rules, cybersecurity expectations and open data interfaces will increasingly define product specifications through 2035.

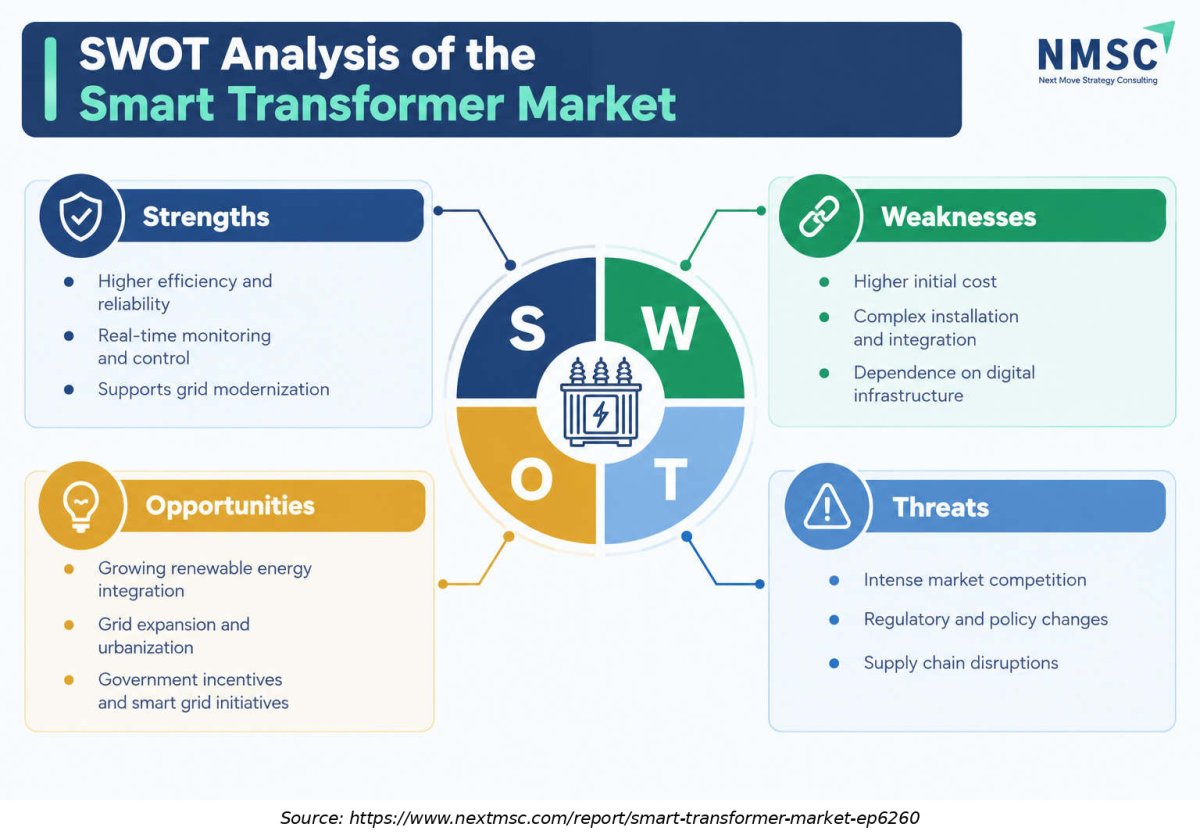
SWOT Analysis

This SWOT view highlights structural strengths, strategic gaps, expansion headroom, and external risks shaping outcomes in the Smart Transformer Market Global Industry Analysis and Forecast (2026–2035).

Strengths

Weaknesses

Opportunities

Threats

Market Drivers & Dynamics

Interactive Dataset
Grid modernization and utility digitalization programs driver +3.4% Global 2026–2035
Data center, EV and electrification load growth driver +2.8% North America, Europe, Asia-Pacific 2026–2035
Replacement of aging transformer fleets driver +2.1% North America, Europe 2026–2033
Dynamic loading and predictive maintenance value driver +1.5% Global 2026–2032
Renewable and storage interconnection needs driver +1.3% Global 2026–2035
Cost premium over conventional transformers restraint −1.4% Global 2026–2031
Electrical steel, copper and labor supply constraints restraint −1.2% North America, Europe 2026–2030
Cybersecurity and data interoperability concerns restraint −1.0% North America, Europe 2026–2035
Limited standardization of sensor data interfaces restraint −0.6% Global 2026–2032
Source: Next Move Strategy Consulting

Growth Drivers

What Is the Primary Growth Driver in the Smart Transformer Market?

Grid modernization and aging asset replacement form the primary driver of the Smart Transformer Market. The International Energy Agency estimates global grid investment near USD 400 billion per year and reports that grid component prices have nearly doubled in five years. The European Commission notes that about 40% of EU distribution grids are over 40 years old. We found that utilities facing these conditions prefer instrumented transformers because monitoring data helps them stage replacements and secure scarce manufacturing slots.

How Is Rising Electricity Demand Driving the Market Growth?

Rising electricity demand lifts orders. The International Energy Agency projects data centers will consume about 945 TWh by 2030, up from about 415 TWh in 2024, while the North American Electric Reliability Corporation forecasts a ten year summer peak increase of 224 GW. Our findings suggest that this load growth pushes utilities to extract more capacity from existing assets. The IEA states that dynamic transformer rating can add 5% to 15% of capacity, a benefit that requires temperature and load sensing built into the transformer.

Growth Inhibitors

What Is Restraining the Smart Transformer Market?

Supply constraints and cost are the main restraints for the Smart Transformer Market. The U.S. Department of Energy reports distribution transformer lead times rising from three to six months in 2019 to one to two years by 2024, and large power transformers commonly take 36 months. Supply-chain constraints in grain-oriented electrical steel, copper, and transformer components compound delivery delays. In 2019, imports accounted for more than 80% of U.S. large power transformer demand, highlighting the sector's exposure to overseas manufacturing and supply-chain disruptions.

Segmentation Analysis

2025 (USD Billion)
2035 (USD Billion)
Distribution transformers 2025: $2.15 Billion | 2035: $8.50 Billion
Distribution
Power transformers 2025: $1.74 Billion | 2035: $7.40 Billion
Power transf
Solid state transformers 2025: $0.17 Billion | 2035: $3.01 Billion
Solid state
Distribution transformers $2.15 Billion $8.50 Billion 12.8%
Power transformers $1.74 Billion $7.40 Billion 14.1%
Solid state transformers $0.17 Billion $3.01 Billion 24.8%

Which Transformer Type Leads and Which Grows Fastest?

Distribution transformers lead the Smart Transformer Market with USD 2.15 Billion in 2025, supported by large installed fleets, utility feeder digitalization and efficiency regulation, and they are projected to reach USD 8.50 Billion by 2035. Solid state transformers are the fastest growing type at 24.8% CAGR from 2026 to 2035, driven by data center, storage and renewable interconnection pilots. Power transformers grow at 14.1%, backed by utility asset health programs that tie monitoring to multi year replacement planning.

2025 (USD Billion)
2035 (USD Billion)
Hardware
Software and
Services
Segment Item 2025 (USD Billion) 2035 (USD Billion) CAGR
Hardware $10.0 USD Billion $40.0 USD Billion 15.0%
Software and analytics $17.1 USD Billion $51.1 USD Billion 9.0%
Services $24.2 USD Billion $62.2 USD Billion 19.0%

Segment-wise data is locked

Unlock complete segment-wise numbers for By Offering.

Unlock Full Data
2025 (USD Billion)
2035 (USD Billion)
Utilities
Renewable en
Industrial
Commercial a
Segment Item 2025 (USD Billion) 2035 (USD Billion) CAGR
Utilities $10.0 USD Billion $40.0 USD Billion 26.0%
Renewable energy producers $17.1 USD Billion $51.1 USD Billion 16.0%
Industrial $24.2 USD Billion $62.2 USD Billion 18.0%
Commercial and data centers $31.3 USD Billion $73.3 USD Billion 8.0%

Segment-wise data is locked

Unlock complete segment-wise numbers for By End User.

Unlock Full Data
2025 (USD Billion)
2035 (USD Billion)
North Americ
Canada
Mexico
Europe: UK
Germany
Segment Item 2025 (USD Billion) 2035 (USD Billion) CAGR
North America: U.S. $10.0 USD Billion $40.0 USD Billion 10.0%
Canada $17.1 USD Billion $51.1 USD Billion 8.0%
Mexico $24.2 USD Billion $62.2 USD Billion 18.0%
Europe: UK $31.3 USD Billion $73.3 USD Billion 8.0%
Germany $38.4 USD Billion $84.4 USD Billion 15.0%

Segment-wise data is locked

Unlock complete segment-wise numbers for By Region.

Unlock Full Data

Growth Opportunities

Our analysis shows that three whitespace opportunities are positioned to generate disproportionate revenue for vendors that invest ahead of buyer maturity in each category.

Can Sensor Ready Specifications Unlock the Installed Transformer Base?

In the Smart Transformer Market, the mechanism is sensor ready specifications in utility replacement tenders, so every new unit ships with monitoring and communication hardware. The U.S. Department of Energy reports about 66 million distribution transformers in service, with about 17.5 million beyond design life. This opportunity benefits the distribution transformers type and the utilities end user, which together carry the largest replacement pipeline.

Does Monitoring as a Service Create Recurring Revenue for Vendors?

Utilities with limited engineering staff increasingly prefer subscriptions covering sensors, analytics and expert diagnosis. The mechanism is multi year service contracts priced per monitored asset, which convert one time equipment sales into recurring income. Maschinenfabrik Reinhausen, Hyosung Heavy Industries and Schneider Electric already offer monitoring software alongside hardware. This opportunity benefits the services and software and analytics offerings, both of which outgrow hardware.

Will Data Center and Renewable Interconnections Create a Solid State Premium Segment?

Smart Transformer Market buyers such as data center operators and renewable developers need compact, controllable power conversion with built in diagnostics. The mechanism is solid state transformers that combine voltage conversion, power flow control and monitoring in one unit. Eaton's acquisition of Resilient Power Systems in August 2025 shows incumbents are buying capability. This opportunity benefits the solid state transformers type and the commercial and data centers end user, both of which grow well above the overall market rate.

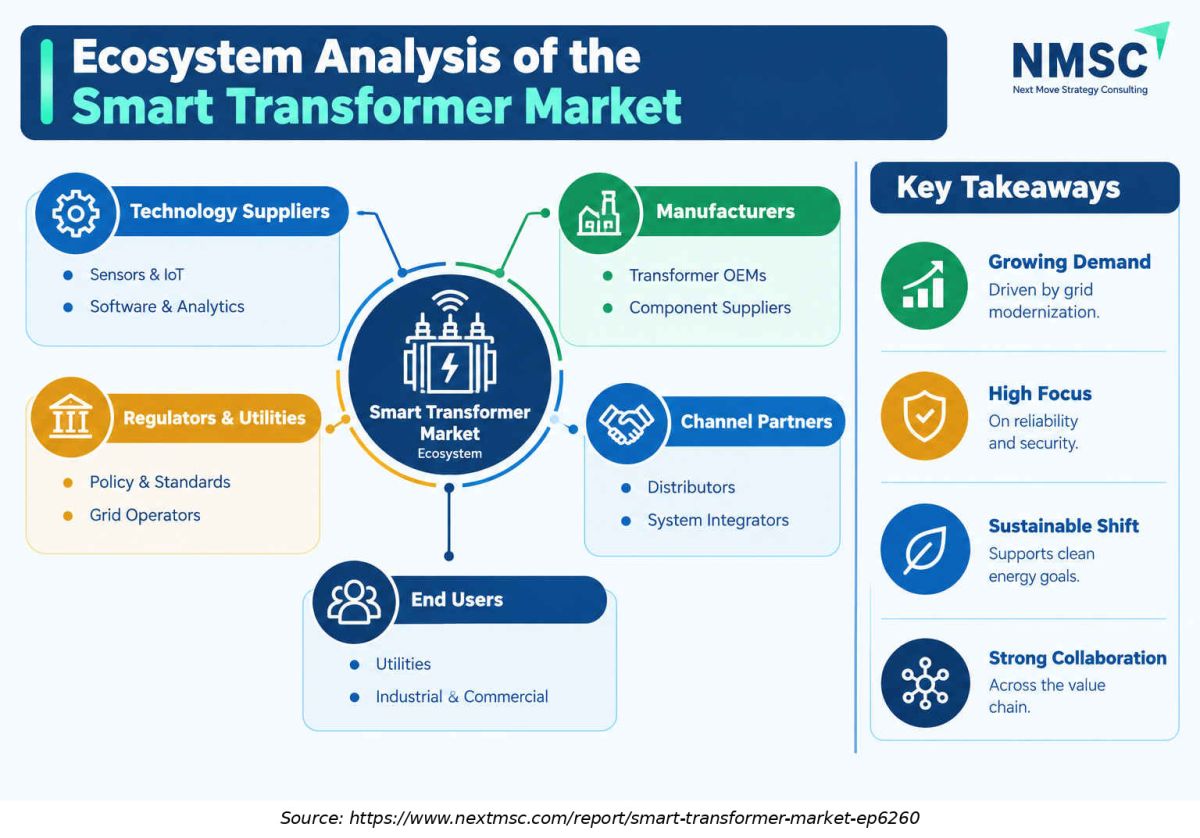
Ecosystem Analysis of the Smart Transformer Market

This infographic outlines the smart transformer market ecosystem, covering technology suppliers, manufacturers, regulators, utilities, channel partners, and end users. Sensors, IoT solutions, and analytics support intelligent transformer operations, while manufacturers and system integrators facilitate deployment. Growing grid modernization requirements, increasing emphasis on reliability and security, and clean energy objectives are strengthening collaboration across the value chain.

Regional Outlook

2025 (USD Billion)
2035 (USD Billion)
North Americ
Europe
Asia-Pacific
Middle East
Latin Americ
Region 2025 (USD Billion) 2035 (USD Billion) CAGR (%)
North America $10.0 USD Billion $40.0 USD Billion 9.0%
Europe $17.1 USD Billion $51.1 USD Billion 27.0%
Asia-Pacific $24.2 USD Billion $62.2 USD Billion 25.0%
Middle East & Africa $31.3 USD Billion $73.3 USD Billion 23.0%
Latin America $38.4 USD Billion $84.4 USD Billion 12.0%

Regional data is locked

Unlock complete regional numbers for this market.

Unlock Full Data

Competitive Landscape

Our assessment indicates that the industry features three competitive archetypes, integrated transformer OEMs, electrical and automation majors, and specialist monitoring suppliers, with competition intensifying as grid investment draws capital into capacity and digital offerings. The assessment below summarizes structure, innovation focus and consolidation, followed by four questions that explain how rivalry is evolving across product tiers and regions.

How Do Companies Compete in the Smart Transformer Market?

Companies in the Smart Transformer Market compete on sensor integration depth, analytics quality, delivery lead time, service coverage and compliance with efficiency rules, while pricing pressure is highest in distribution transformers. We found that capacity and geographic expansion now act as competitive weapons. Hitachi Energy and Siemens Energy have each committed new U.S. transformer capacity since February 2026, while Asia and India receive parallel investment.

Which Competitive Archetypes Dominate the Smart Transformer Market?

Integrated OEMs such as Hitachi, Siemens Energy, HD Hyundai Electric, Hyosung Heavy Industries, SGB-SMIT and WEG sell instrumented transformers with software. Electrical and automation majors, led by Eaton and Schneider Electric, emphasize IoT connectivity, protection relays and monitoring software. Specialist suppliers such as Maschinenfabrik Reinhausen, Wilson Transformer Company, Virginia Transformer and Efacec differentiate through monitoring modules, tap changer diagnostics and local service.

What Innovation and Differentiation Strategies Are Companies Pursuing?

We observed that leading suppliers pursue ecosystem strategies that connect sensors, gateways and analytics. Hitachi Energy offers TXpert, Siemens Energy offers Sensformer and Noedra solutions, Maschinenfabrik Reinhausen offers ISM and TESSA, SGB-SMIT offers its Transformer Operating System, and Efacec works with Doble Engineering on a digital asset management solution. Eaton extends the strategy into solid state designs, and Hitachi Energy launched HMAX Energy in March 2026.

What M&A and Partnership Activity Is Shaping the Market?

Our findings suggest that consolidation targets transformer capacity and power electronics capability. GE Vernova completed its USD 5.275 billion purchase of the remaining stake in Prolec GE on 2 February 2026, and Eaton completed its acquisition of Resilient Power Systems in August 2025. Partnerships between transformer makers and diagnostics specialists, such as Efacec with Doble Engineering, complement these deals and speed integration of analytics into new product lines.

Key Market Players

Based on research conducted by NMSC, the following 13 companies represent the validated leadership set across smart transformer manufacturing, monitoring hardware, analytics software and lifecycle services within this market. Entries appear in ranked order based on the strength of verifiable smart transformer evidence drawn from official company websites, filings and press releases.

Hitachi, Ltd. Siemens Energy AG Eaton Corporation plc Schneider Electric SE HD Hyundai Electric Co., Ltd. Hyosung Heavy Industries Corporation WEG S.A. Maschinenfabrik Reinhausen GmbH SGB-SMIT Group Elsewedy Electric Virginia Transformer Corp. Efacec Power Solutions Wilson Transformer Company

Latest Developments

During our market evaluation, we noticed that 2025–2026 activity combines transformer capacity expansion with digital monitoring launches and solid state technology purchases, which confirms that suppliers expect instrumented transformers to become standard. The table below lists the most relevant verified announcements for the period, ordered from the most recent to the oldest, so readers can follow capacity and technology moves.

Date Event
August 2026 Hitachi Energy announced a USD 300 million investment to expand power transformer and component manufacturing capacity in Hefei, China. The investment aims to strengthen production capabilities and support growing demand for electricity infrastructure, grid modernization, and reliable power transmission equipment.
June 2026 Hitachi Energy broke ground on a USD 457 million expansion of its South Boston, Virginia, campus to increase large power transformer manufacturing capacity. The project is expected to strengthen domestic transformer supply, support grid infrastructure development, and create approximately 825 long-term jobs. 
February 2026 Siemens Energy announced a USD 1 billion investment in U.S. manufacturing operations to expand domestic production and servicing capabilities for critical energy equipment. The broader investment includes grid infrastructure and transformer-related capacity, supporting electricity demand growth and efforts to strengthen the domestic energy supply chain.
February 2026 GE Vernova completed its acquisition of the remaining 50% stake in Prolec GE for an announced purchase price of USD 5.275 billion. The transaction gives GE Vernova full ownership of the transformer manufacturer, strengthening its position in power transmission and distribution equipment and expanding its ability to serve growing demand for grid infrastructure.

Investment Opportunities

Where Are Capital Inflows Concentrating in the Smart Transformer Market?

Capital is concentrating in Smart Transformer Market manufacturing capacity and digital service platforms. Hitachi Energy committed over a quarter of a billion dollars to transformer components from 2025 through 2027, and Siemens Energy pledged a billion dollars to U.S. manufacturing. We found that acquisitions, including GE Vernova's USD 5.275 billion Prolec GE purchase and Eaton's solid state transformer deal, show strategic buyers paying for capacity and power electronics expertise.
How Is Infrastructure Investment Shaping Market Capacity?

Public programs are expanding the addressable base. The U.S. Department of Energy's Grid Resilience and Innovation Partnerships program totals USD 10.5 billion across resilience, smart grid and innovation grants, and India's distribution scheme carries an outlay of Rs 3,03,758 crore. Our analysis shows that utilities funded by such programs specify monitoring and communication features in procurement, which raises the share of instrumented units in new orders.

What ESG Considerations Are Influencing Market Investment?

Efficiency and emissions goals influence capital allocation. The U.S. Department of Energy estimates its 2024 distribution transformer standard will deliver about USD 14 billion in energy cost savings and about 85 million metric tons of carbon dioxide reductions over 30 years. Monitoring supports these aims because loading data helps utilities right size equipment and avoid early failures, which also reduces oil and material waste from premature replacement.

Key Benefits for Stakeholders

How Does This Report Benefit Utility Leaders and Industrial Operators?

Utility executives, asset managers and industrial engineering leaders gain segment level Smart Transformer Market revenue forecasts and CAGR benchmarks across three segmentation axes and five regions, enabling procurement and replacement decisions grounded in consistent 2025–2035 figures. The offering and transformer type breakdowns provide evidence for choosing between hardware focused purchases and service based monitoring contracts.

How Does This Report Benefit Investors and Financial Analysts?

Investors and financial analysts gain a reconciled sizing model at USD 4.06 Billion in 2025, rising to USD 18.91 Billion by 2035, together with a view of the competitive landscape and tracked company developments. The contrast between services at 18.7% CAGR and hardware at 13.3% supports valuation work on recurring revenue quality, while the solid state segment at 24.8% highlights higher risk, higher growth exposure.

How Does This Report Benefit Technology Vendors and Product Teams?

Vendors and product teams gain visibility into which segments grow fastest, notably solid state transformers at 24.8% CAGR, commercial and data centers at 17.9% and software and analytics at 16.1%, informing roadmap and go to market priorities through 2035. The competitive analysis shows the sensing, communication and analytics capabilities that buyers now treat as baseline requirements.

Key Market Segments Evaluated

By Transformer Type

  • Distribution transformers
  • Power transformers
  • Solid state transformers

By Offering

  • Hardware
  • Software and analytics
  • Services

By End User

  • Utilities
  • Renewable energy producers
  • Industrial
  • Commercial and data centers

By Region

  • North America 
    • U.S.
    • Canada
    • Mexico
  • Europe 
    • UK
    • Germany
    • France
    • Italy
    • Spain
    • Sweden
    • Denmark
    • Finland
    • Netherlands
    • Rest of Europe
  • Asia-Pacific 
    • China
    • India
    • Japan
    • South Korea
    • Taiwan
    • Indonesia
    • Vietnam
    • Australia
    • Philippines
    • Malaysia
    • Rest of APAC
  • Middle East & Africa 
    • Saudi Arabia
    • UAE
    • Egypt
    • Israel
    • Turkey
    • Nigeria
    • South Africa
    • Rest of MEA
  • Latin America 
    • Brazil
    • Argentina
    • Chile
    • Colombia
    • Rest of LATAM

Conclusion & Recommendations

The Smart Transformer Market outlook is one of sustained double digit expansion, with revenue rising from USD 5.54 Billion in 2026 to USD 18.91 Billion in 2035. We observed that growth rests on structural needs rather than cyclical demand, since aging fleets, load growth and renewable connections all require more capacity from the grid. Mid decade growth should be led by monitoring hardware and services, while solid state platforms contribute a larger share toward 2035.

What Strategic Positioning Recommendations Does NMSC Offer?

NMSC recommends that manufacturers bundle sensors, communication and analytics into standard product lines, and that they price monitoring as a recurring service rather than a one time option. Suppliers should align designs with IEC 61850 and emerging efficiency rules, build service coverage in Asia-Pacific and the Middle East & Africa, and pursue partnerships with diagnostics specialists to shorten time to market.

What Is the Investment Attractiveness of the Smart Transformer Market?

Attractiveness is high but uneven. Services at 18.7% CAGR and software and analytics at 16.1% offer recurring revenue, while hardware at 13.3% offers scale and strategic importance. Our analysis shows that capacity constraints and lead times give incumbents pricing power, and that acquisitions such as Prolec GE and Resilient Power Systems indicate strategic appetite. Solid state transformers offer the highest growth but carry technology and adoption risk.

What Are the Market Shifts and Key Risks in the Smart Transformer Market?

Key shifts include the move from scheduled to condition based maintenance, the entry of electrical majors into transformer capacity, and rising data center demand. Risks include supply constraints in electrical steel and copper, cybersecurity exposure from connected assets, uneven data standards and policy changes, as seen in the June 2026 Department of Energy request for information on distribution transformer efficiency supply effects. Vendors with strong security practices will hold an advantage.

What Are the Primary Growth Pathways Through 2035?

Primary pathways include sensor ready replacement programs, monitoring as a service, solid state transformers for data centers and renewables, and regional expansion in the Middle East & Africa and Latin America, which grow at 19.2% and 18.6% CAGR respectively. We found that suppliers combining local manufacturing with digital services are best placed to capture these pathways before 2035.

FAQs

About the Author

Mihul Sharma

Mihul Sharma

Mihul Sharma is Research Associate at Next Move Strategy Consulting, where he has covered technology, industrial, and healthcare markets for 3 years. His work applies structured business research, market analysis, and secondary-source review to assess market trends, competitive developments, and growth opportunities. He supports report development by fully synthesizing industry data, company information, and market signals into concise findings for strategy and investment-focused research teams.

About the Reviewer

Supradip Baul

Supradip Baul

Supradip Baul is an accomplished business consultant and strategist with over a decade of rich experience in market intelligence, strategy, technology, and business transformation. His work has included rigorous qualitative and quantitative analysis across multiple industries, helping clients shape investment decisions and long-term roadmaps. Earlier in his career, he was associated with Gartner, where he contributed to industry-leading reports and market share analyses. He has worked with leading global companies and holds an MBA with a dual specialization in Marketing and Finance.

Download Free Sample

Semih Kavaklioglu

SEMIH KAVAKLIOGLU

Co-Founder & Sales Manager

Decortie

I work a lot in the marketing industry and I know that research is an essential part of any campaign. I have used Market research reports for my own products and I found them to be very informative and well-researched. The team here produces insightful reports for a good price

Kishu Kanda

KISHU KANDA

Strategy Analyst

Accenture

We purchased the AI Consumer Market Report from this company. Not only did they customize the report to meet our specific requirements, but they also showed great flexibility in accommodating our budget. The report we received fully met our expectations. Additionally, they provided prompt and thorough responses to both our pre-purchase and follow-up questions. We look forward to working with this company again in the future.

Kevin Coker

KEVIN COKER

Founder, CEO and Board Diector

Proxima Clinical Research

I have been using Next MSC reports for product positioning in a new geography for a long time. They have by far the best reports I have found and the price is reasonable too!

Henri Knyphausen

HENRI KNYPHAUSEN

Partner at Singulier [Ex-BCG]

Singulier

I recently engaged NEXTMSC.com for a commercial due diligence project within the intralogistics sector, and I am pleased to provide a reference based on my experience. In utilizing NEXTMSC.com's services, I found their report to offer valuable insights into market dynamics and key industry players. The initial report provided a solid foundation for our analysis. However, as we were investigating a smaller target in the market, and I had specific customization requests requiring additional research. These requests included detailed information on product portfolios of various players and sub-market sizes, both inclusive and exclusive of certain product categories. NEXTMSC.com demonstrated commendable responsiveness and agility in accommodating these customization requests. Within a timeframe of 1-2 weeks, they delivered a revised report that met our specific needs. Furthermore, they were receptive to my follow-up inquiries, ensuring clarity and understanding of the data provided. The final deliverable significantly contributed to our due diligence efforts. One of NEXTMSC.com's notable strengths lies in their qualitative research capabilities. However, for future engagements, I would recommend the inclusion of a quantified market model in Excel format. Such a model would offer the ability to conduct in-depth analyses and explore various market segments, including country-specific data and subcomponent breakdowns. Based on my positive experience, I would not hesitate to work with NEXTMSC.com again. Their responsiveness, willingness to accommodate customization requests, and commitment to delivering actionable insights make them a reliable partner for commercial research projects.

Gaurav Jaiswal

GAURAV JAISWAL

Founder & CEO

Yano Charge Private Limited

The EV Charging market research report provided by the NextMSC was exceptionally detailed and insightful. It offered a comprehensive analysis that proved to be a game-changer for our strategic planning. Truly a testament to the NextMSC’s expertise and thoroughness in EV market landscape & analysis.

Custom Market Research Services

We will customize the research for you if the listed report does not fully match your requirements.

Get 30% Free Customization

Select License

This website uses cookies to ensure you get the best experience on our website. Learn more

✖