Surfactants Market

Surfactants Market size was USD 53.79 Billion in 2025, projected to reach USD 85.17 Billion by 2035, growing at a CAGR of 4.58% from 2026 to 2035. Key drivers include binding biodegradability regulations, rising home care and personal care consumption, and expanding manufacturing capacity, with Asia-Pacific leading the market .

Download Free Sample PDF
Base Year (2025)
$53.79 Billion
Forecast (2035)
$85.17 Billion
CAGR (2026-2035)
4.6%
Top Country
Asia-Pacific

What Is the Surfactants Market Size?

The global market size reached USD 53.79 Billion in 2025. It is estimated at USD 56.93 Billion in 2026 and is forecast to reach USD 85.17 Billion by 2035. This reflects a CAGR of 4.58% between 2026 and 2035. Asia-Pacific leads the market with an approximate 42% share. Anionic Surfactants dominate the product-type segment at approximately 38% share in 2025.

We observed that binding EU biodegradability rules are reshaping formulation choices across the market. Producers are shifting toward oleochemical and fermentation-based feedstocks. This is pulling fermentation-based surfactant revenue ahead of the broader market, even as fossil-based chemistry remains the largest feedstock category overall.

Surfactants Market Revenue Forecast

Values in USD Billion

2025 $53.79 Billion
2025
2026 $56.93 Billion
2026
2027 $59.54 Billion
2027
2028 $62.26 Billion
2028
2029 $65.12 Billion
2029
2030 $68.10 Billion
2030
2031 $71.22 Billion
2031
2032 $74.48 Billion
2032
2033 $77.89 Billion
2033
2034 $81.46 Billion
2034
2035 $85.17 Billion
2035

Key Takeaways

By Product Type: Anionic Surfactants held the largest share, expanding from USD 20.45 billion in 2025 to USD 28.94 billion by 2035; Polymeric and Structured Surfactants are the fastest-growing sub-segment at 7.97% CAGR from 2026–2035.

By Feedstock Type: Fossil-Based held the largest share, expanding from USD 29.04 billion in 2025 to USD 40.03 billion by 2035; Fermentation-Based is the fastest-growing sub-segment at 11.85% CAGR from 2026–2035.

By End-User Application: Home Care held the largest share, expanding from USD 12.92 billion in 2025 to USD 18.71 billion by 2035; Pharmaceutical and Healthcare is the fastest-growing sub-segment at 9.41% CAGR from 2026–2035.

Dominant Region: Asia-Pacific dominated with approximately 42% revenue share in 2025.

Fastest-Growing Region: Middle East & Africa is expected to register the highest CAGR of 6.70% during 2026–2035.

Dominant Country: China led the market, anchored by concentrated surfactant manufacturing and strong downstream demand.

Fastest-Growing Country: India is the fastest-growing country, supported by rising home care and personal care consumption.

The market presents an absolute investment opportunity of approximately USD 28.24 Billion between 2026 and 2035. It positions oleochemical and fermentation-based surfactant capacity as a high-conviction category for specialty chemical investors.

According to NMSC analysis, the market's resilience stems from binding EU biodegradability regulation. This regulation is compelling producers to reformulate toward mono-material, readily biodegradable chemistries. The shift is converting regulatory compliance into a structural driver of premium-grade surfactant demand across home care and personal care applications.

What does the Surfactants Market Encompass?

The Surfactants Market covers anionic, nonionic , cationic, amphoteric, silicone, fluorinated, polymeric, and blended surfactant chemistries produced from fossil-based, oleochemical, fermentation-based, and mixed feedstocks. These products serve home care, personal care, industrial cleaning, agriculture, oilfield, and a wide range of other industrial applications. We observed that the market has evolved from a fossil-feedstock-dominated category into one where oleochemical and fermentation-based routes are gaining structural share.

Our findings suggest that the EU's new Detergents and Surfactants Regulation (EU) 2026/405, published in 2026 and set to apply from September 2029, is reshaping formulation priorities across the market. This regulation maintains and refines ultimate biodegradability requirements for all surfactants placed on the EU market. Technology adoption trends toward fermentation-derived biosurfactants are accelerating as producers prepare for the regulation's compliance deadline.

Market Drivers & Dynamics

Interactive Dataset
EU Detergents and Surfactants Regulation compliance reformulation driver +1.6% Europe 2026–2031
Rising home care and personal care consumption in Asia-Pacific driver +1.5% Asia-Pacific, Latin America 2026–2035
Growth of fermentation-based biosurfactant capacity driver +1.1% Europe, North America 2026–2033
Expanding industrial and institutional cleaning demand driver +0.7% Global 2026–2035
Rising oilfield and mining surfactant application driver +0.5% North America, Middle East & Africa 2026–2032
Volatility in petrochemical and palm oil feedstock pricing restraint −0.9% Global 2026–2035
1,4-dioxane and PFAS regulatory scrutiny raising compliance cost restraint −0.7% Europe, North America 2026–2030
Price competition from Asia-Pacific commodity producers restraint −0.5% Asia-Pacific 2026–2035
Long qualification cycles for reformulated personal care surfactants restraint −0.4% Global 2026–2031
Source: Next Move Strategy Consulting

Growth Drivers

What Is the Primary Growth Driver of the Surfactants Market ?

The primary growth driver for the market is binding biodegradability regulation. EU Regulation (EU) 2026/405, published and entered into force in 2026, requires all surfactants placed on the EU market to meet ultimate aerobic biodegradability criteria. This requirement applies from September 2029. It is compelling producers across the market to prioritize compliant chemistries ahead of the deadline.

How Is Rising Asia-Pacific Consumption Driving Surfactants Market Growth?

Our analysis shows that rising home care and personal care consumption across China and India is directly driving market growth. Asia-Pacific already holds approximately 42% share of the market in 2025. Expanding manufacturing capacity and growing middle-class consumption are reinforcing this regional lead through the forecast period.

Growth Inhibitors

What Is Restraining the Surfactants Market?

We found that the primary restraint on the market is volatility in petrochemical and palm oil feedstock pricing. This volatility directly affects both fossil-based and oleochemical surfactant production costs. Industry-derived estimates suggest that growing 1,4-dioxane and PFAS regulatory scrutiny is also raising compliance costs for nonionic and fluorinated surfactant producers.

Segmentation Analysis

2025 (USD Billion)
2035 (USD Billion)
Anionic Surf
Sulfonates
Linear Alkyl
Alpha Olefin
Methyl Ester
Segment Item 2025 (USD Billion) 2035 (USD Billion) CAGR
Anionic Surfactants $10.0 USD Billion $40.0 USD Billion 14.0%
Sulfonates $17.1 USD Billion $51.1 USD Billion 8.0%
Linear Alkylbenzene Sulfonates $24.2 USD Billion $62.2 USD Billion 14.0%
Alpha Olefin Sulfonates $31.3 USD Billion $73.3 USD Billion 20.0%
Methyl Ester Sulfonates $38.4 USD Billion $84.4 USD Billion 27.0%

Segment-wise data is locked

Unlock complete segment-wise numbers for By Product Type.

Unlock Full Data

Which Product Type Dominates the Surfactants Market?

Anionic Surfactants lead the market with USD 20.45 Billion in 2025. This segment will expand to USD 28.94 Billion by 2035. Anionic chemistry remains the workhorse category across home care and personal care formulations. Polymeric and Structured Surfactants form the fastest-growing product-type segment at a 7.97% CAGR. This growth reflects rising demand for gemini and dendritic surfactants in enhanced oil recovery and specialty coating applications.

2025 (USD Billion)
2035 (USD Billion)
Fossil-Based
Oleochemical
Fermentation
Mixed Feedst
Unclassified
Segment Item 2025 (USD Billion) 2035 (USD Billion) CAGR
Fossil-Based $10.0 USD Billion $40.0 USD Billion 25.0%
Oleochemical $17.1 USD Billion $51.1 USD Billion 11.0%
Fermentation-Based $24.2 USD Billion $62.2 USD Billion 25.0%
Mixed Feedstock $31.3 USD Billion $73.3 USD Billion 11.0%
Unclassified Feedstock $38.4 USD Billion $84.4 USD Billion 16.0%

Segment-wise data is locked

Unlock complete segment-wise numbers for By Feedstock Type.

Unlock Full Data

Which Feedstock Type Leads and Which Grows Fastest in the Surfactants Market?

Fossil-Based feedstock dominates the market at USD 29.04 Billion in 2025. This reflects the continued cost advantage of petrochemical routes for high-volume anionic and nonionic chemistries. Fermentation-Based feedstock is the fastest-growing category at an 11.85% CAGR, as biosurfactant production scales to meet demand from organic personal care brands and EU-facing formulators preparing for tightening biodegradability rules.

2025 (USD Billion)
2035 (USD Billion)
Home Care
Personal Car
Industrial &
Agriculture
Oilfield
Segment Item 2025 (USD Billion) 2035 (USD Billion) CAGR
Home Care $10.0 USD Billion $40.0 USD Billion 24.0%
Personal Care $17.1 USD Billion $51.1 USD Billion 22.0%
Industrial & Institutional Cleaning $24.2 USD Billion $62.2 USD Billion 20.0%
Agriculture $31.3 USD Billion $73.3 USD Billion 22.0%
Oilfield $38.4 USD Billion $84.4 USD Billion 13.0%

Segment-wise data is locked

Unlock complete segment-wise numbers for By End-User Application.

Unlock Full Data

Which End-User Application Dominates the Surfactants Market?

Home Care leads end-user demand within the market at USD 12.92 Billion in 2025. This segment benefits from steady global detergent and cleaning product consumption. Pharmaceutical and Healthcare is the fastest-growing end-user application at a 9.41% CAGR. This growth reflects rising use of pharmaceutical-grade surfactants in drug delivery and formulation applications.

2025 (USD Billion)
2035 (USD Billion)
Liquid
Paste
Powder
Granule
Flake
Segment Item 2025 (USD Billion) 2035 (USD Billion) CAGR
Liquid $10.0 USD Billion $40.0 USD Billion 27.0%
Paste $17.1 USD Billion $51.1 USD Billion 9.0%
Powder $24.2 USD Billion $62.2 USD Billion 19.0%
Granule $31.3 USD Billion $73.3 USD Billion 17.0%
Flake $38.4 USD Billion $84.4 USD Billion 18.0%

Segment-wise data is locked

Unlock complete segment-wise numbers for By Product Form.

Unlock Full Data
2025 (USD Billion)
2035 (USD Billion)
Direct Sales
Distributor
Online & E-C
Other Contra
Segment Item 2025 (USD Billion) 2035 (USD Billion) CAGR
Direct Sales $10.0 USD Billion $40.0 USD Billion 14.0%
Distributor Sales $17.1 USD Billion $51.1 USD Billion 24.0%
Online & E-Commerce $24.2 USD Billion $62.2 USD Billion 22.0%
Other Contracted Channels $31.3 USD Billion $73.3 USD Billion 12.0%

Segment-wise data is locked

Unlock complete segment-wise numbers for By Sales Channel.

Unlock Full Data

Supply Chain Analysis of the Surfactants Market

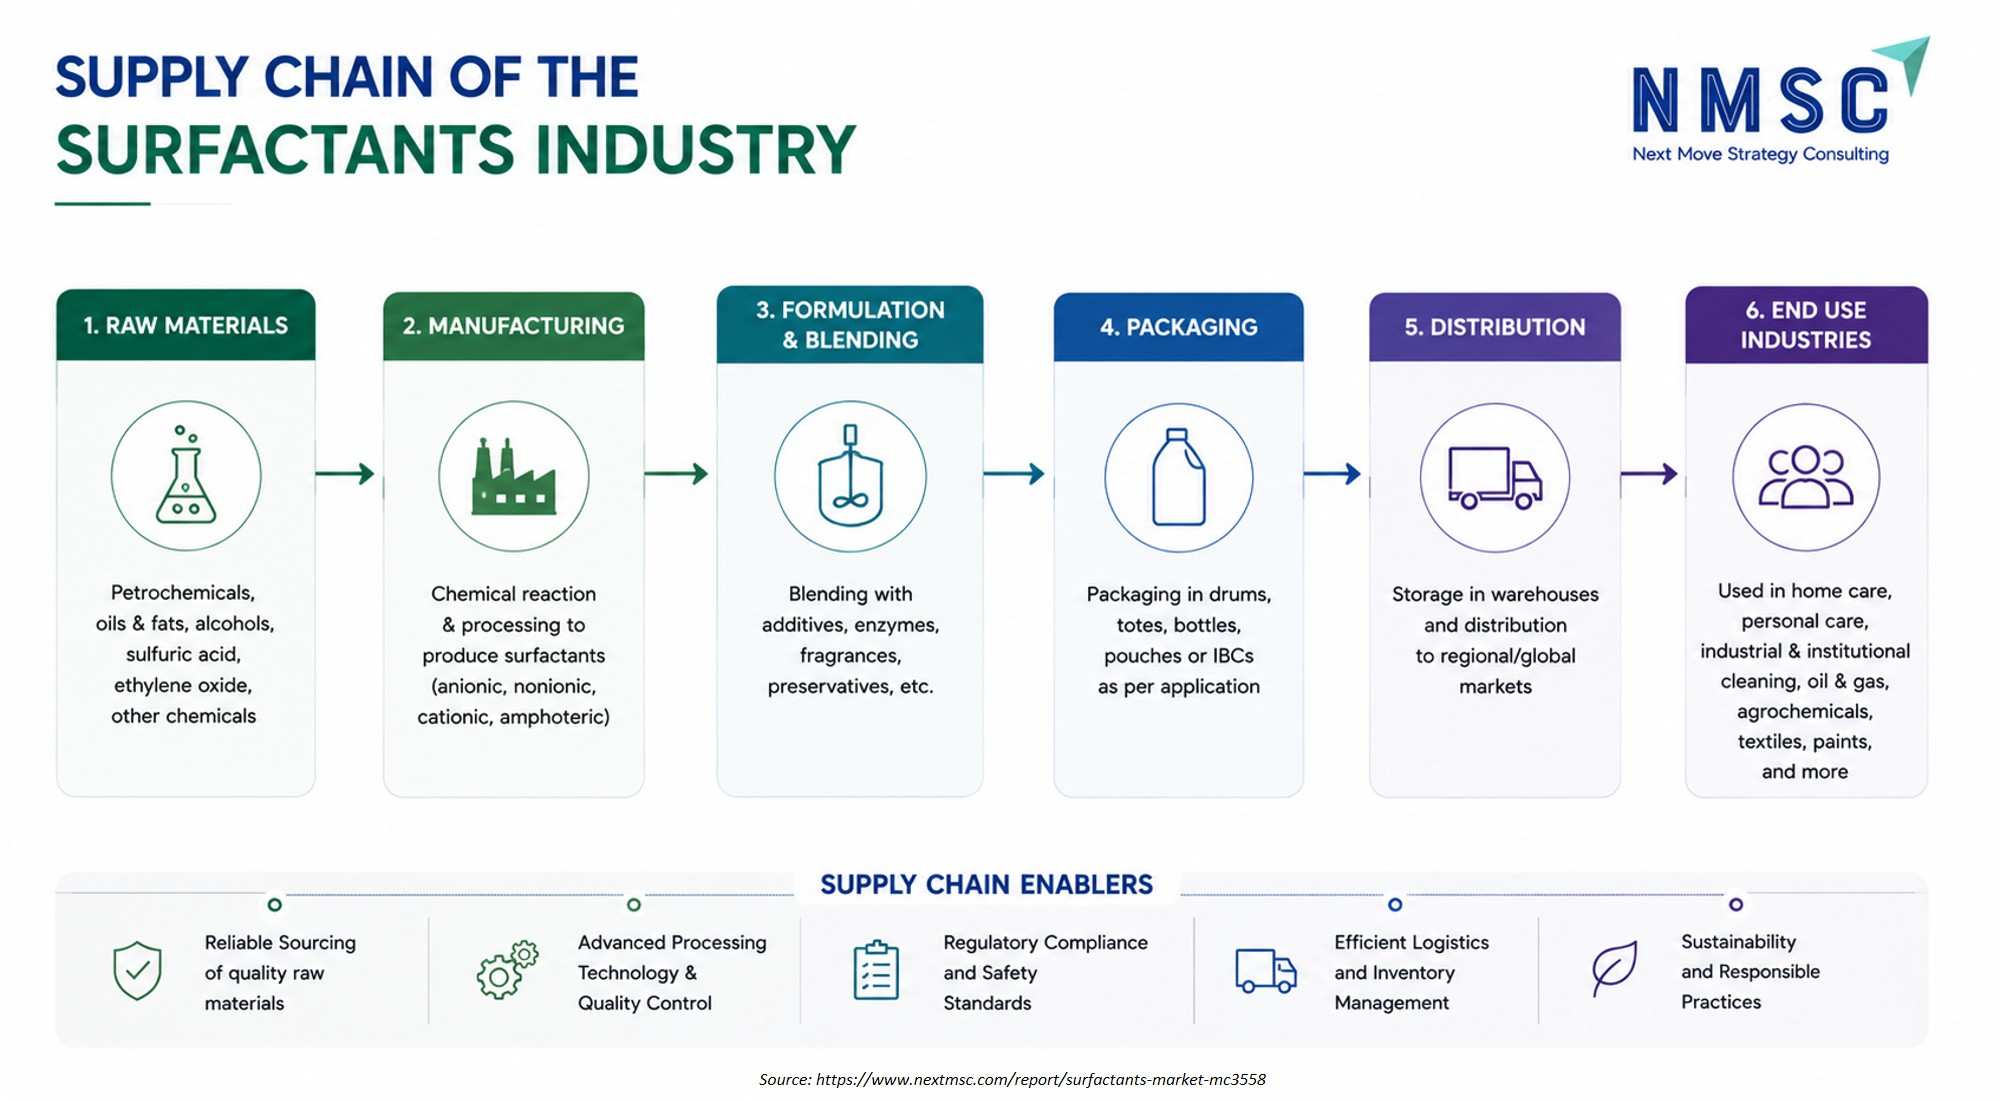
Supply Chain Analysis of the Surfactants Market
The above infographic illustrates the end-to-end supply chain of the Surfactants Market , outlining a six-step flow from raw materials to end-use industries. It details each stage, starting with petrochemicals and chemical manufacturing, moving through formulation, packaging, and distribution. The analysis further highlights critical supply chain enablers, such as reliable sourcing, regulatory compliance, and sustainability practices. Ultimately, it shows how these interconnected stages supply essential ingredients for diverse sectors like home care, agriculture, and industrial cleaning .

Growth Opportunities

Our analysis shows that three whitespace opportunities stand out for surfactant producers positioning ahead of 2035 demand.

Can Biosurfactant Capacity Expansion Unlock EU Compliance-Driven Demand?

Producers that scale fermentation-based biosurfactant capacity can capture reformulation demand from EU-facing brands preparing for the 2029 biodegradability compliance deadline. This benefits the Fermentation-Based feedstock segment and the Personal Care application as formulators lock in compliant supply chains early.

Does Sulfate -Free Personal Care Chemistry Create Value for Amphoteric Producers?

Producers with proven amino-acid-based and betaine surfactant chemistries can capture rising demand from mild, sulfate -free personal care formulations. This benefits the Amphoteric Surfactants segment as consumer preference for gentler cleansing products continues to expand beyond premium niches.

Can Water Treatment Surfactant Formulations Expand Industrial Demand?

Producers that develop specialized surfactant formulations for water treatment applications can capture rising demand tied to industrial wastewater management. This benefits the Water Treatment end-user segment, which is already among the fastest-growing categories within the market.

Regional Outlook

2025 (USD Billion)
2035 (USD Billion)
Asia-Pacific
North Americ
Europe
Latin Americ
Middle East
Region 2025 (USD Billion) 2035 (USD Billion) CAGR (%)
Asia-Pacific $10.0 USD Billion $40.0 USD Billion 9.0%
North America $17.1 USD Billion $51.1 USD Billion 27.0%
Europe $24.2 USD Billion $62.2 USD Billion 25.0%
Latin America $31.3 USD Billion $73.3 USD Billion 23.0%
Middle East & Africa $38.4 USD Billion $84.4 USD Billion 12.0%

Regional data is locked

Unlock complete regional numbers for this market.

Unlock Full Data

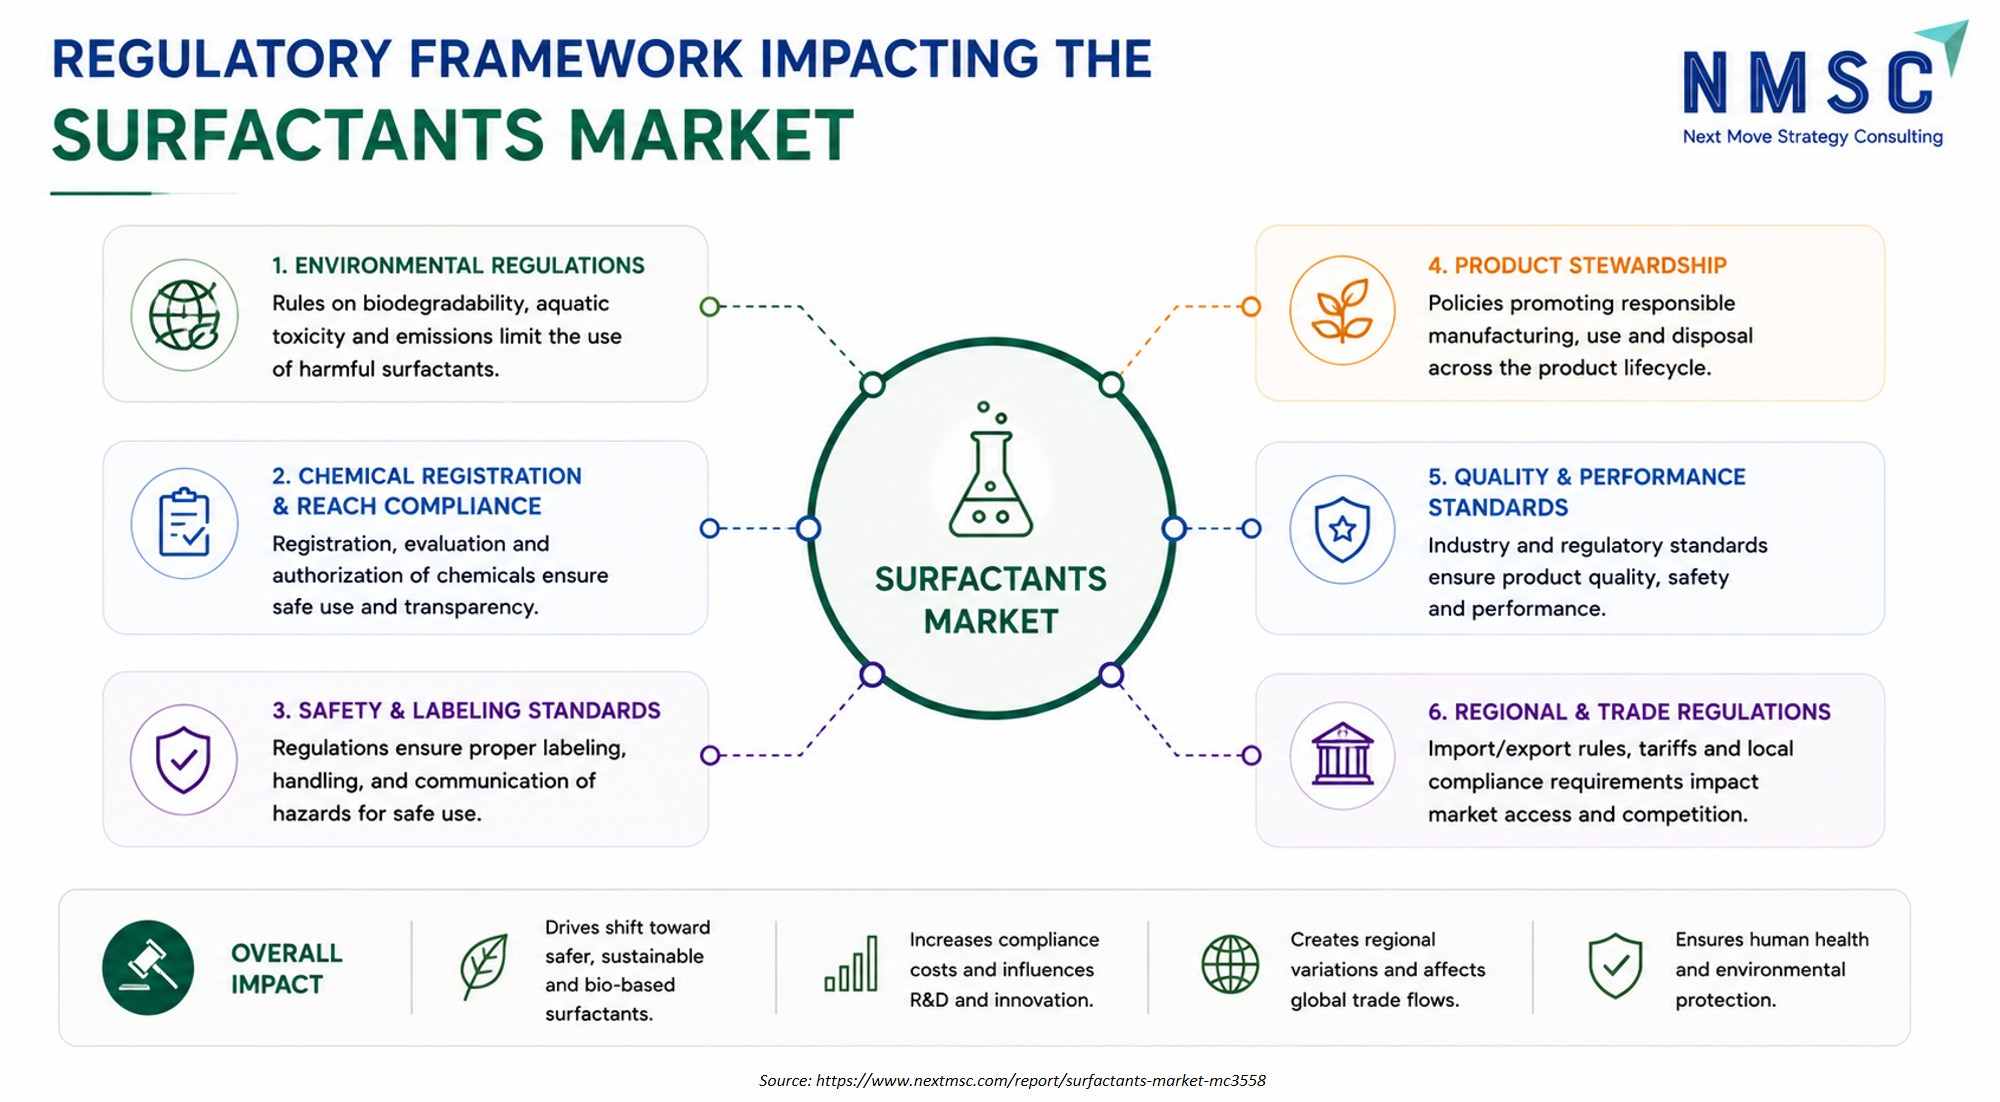
Regulatory Framework Impacting the Surfactants Industry

The above infographic outlines the regulatory framework impacting the surfactants market, identifying six key areas of compliance, including environmental regulations, chemical registration, and product stewardship. It illustrates how these regulations enforce safety, quality, and labeling standards while also shaping regional trade dynamics and market access. The analysis further highlights the overall impact of this framework, noting that it drives the shift toward safer, bio-based surfactants but also increases compliance costs. Ultimately, it emphasizes that these regulations are essential for ensuring human health, environmental protection, and sustainable industry innovation .

Competitive Landscape

Our assessment indicates that the market Industry spans diversified specialty chemical conglomerates, pureplay surfactant manufacturers, and regional oleochemical producers. Each competes on formulation breadth, feedstock integration, and regulatory compliance readiness. Key Takeaways Dimension | Assessment Market Structure | Moderately consolidated; top 10 companies hold the majority of Market Share, led by diversified specialty chemical producers Innovation Focus | Fermentation-based biosurfactants, mild personal care chemistries, and EU biodegradability compliance reformulation M&A Activity | Selective bolt-on acquisitions expanding specialty and biosurfactant capability rather than large-scale consolidation Source: www.nextmsc.com

Dimension Description
Market Structure Moderately consolidated; top 10 companies hold the majority of Market Share, led by diversified specialty chemical producers
Innovation Focus Fermentation-based biosurfactants, mild personal care chemistries, and EU biodegradability compliance reformulation
M&A Activity Selective bolt-on acquisitions expanding specialty and biosurfactant capability rather than large-scale consolidation

How Do Companies Compete in the Surfactants Market Industry?

Companies in the market compete primarily on formulation breadth across anionic, nonionic , and specialty chemistries. Feedstock integration and regulatory compliance readiness also matter. Our findings suggest that vendors with established biodegradability documentation hold a structural advantage over newer entrants, since qualification cycles for personal care surfactants remain lengthy.

Which Competitive Archetypes Dominate the Surfactants Market?

Diversified specialty chemical conglomerates such as BASF and Evonik dominate through integrated feedstock, formulation, and technical service platforms. Pure-play manufacturers , including Stepan Company and Galaxy Surfactants , differentiate through dedicated surfactant-only focus. Regional oleochemical producers such as Kuala Lumpur Kepong compete on palm-based feedstock integration underserved by petrochemical-focused competitors.

What Innovation and Differentiation Strategies Are Companies Pursuing?

We observed that leading producers in the market are investing in fermentation-based biosurfactants and mild personal care chemistries. This positions them ahead of EU compliance deadlines. Differentiation increasingly rests on documented biodegradability performance, since brand owners increasingly select surfactant suppliers based on regulatory readiness rather than cost alone.

What M&A and Partnership Activity Is Shaping the Surfactants Market?

Recent activity favors targeted bolt-on acquisitions expanding specialty and biosurfactant capability. Companies within the market Industry are prioritizing organic reformulation investment ahead of the 2029 EU compliance deadline. Our analysis shows that established producers favor internal innovation over large-scale consolidation given the clinical and regulatory validation intensity required for new surfactant chemistries.

Key Market Players

Based on research conducted by NMSC, the following companies represent the validated set of leading participants in the global market.

BASF SE Stepan Company Dow Inc. Nouryon Chemicals Holding B.V. Evonik Industries AG Clariant AG Indorama Ventures Public Company Limited Sasol Limited Kao Corporation Syensqo SA Galaxy Surfactants Limited Croda International Plc Arkema S.A. Godrej Industries Limited Innospec Inc. Kuala Lumpur Kepong Berhad The Lubrizol Corporation Pilot Chemical Company Colonial Chemical, Inc. Vantage Specialty Chemicals, Inc.

Latest Developments

We found that recent activity in the market reflects regulatory reform and continued specialty chemical investment among established producers.

Date Event
March 2026 BASF and Hannong Chemicals inaugurated a new non-ionic surfactant production site in Seosan, South Korea. The facility began trial operations in January 2026 and strengthens production capacity and supply reliability across Asia Pacific
February 2026 Syensqo launched Rhodasurf B7 UP, an ISCC PLUS-certified laureth-7 surfactant for liquid laundry detergents and hard-surface care. Manufactured in the Netherlands using bio-circular upcycled feedstocks, the product provides a drop-in alternative with more than 90% lower net CO ₂ footprint than conventional grades.
October 2025 Sasol commercialized LIVINEX IO 7, described as the first nonionic surfactant of its kind derived from insect oil. The palm- and deforestation-free ingredient is targeted at fabric care, home care, industrial and institutional cleaning markets
May 2025 Pilot Chemical announced an exclusive partnership with Novvi to bring biobased alpha olefin sulfonate surfactant technology to North America.

Expert Insights

Michael Fielding

Michael Fielding

CEO | Dot Ingredients

"“ Demand for surfactants is growing six times faster than the global population . The industry is crying out for a renewable feedstock which also decreases supply chain risks . ”"

Analyst Interpretation

The statement highlights the expanding requirement for renewable surfactant feedstocks and more resilient supply chains as downstream demand continues to increase. Next Move Strategy Consulting’s analysis indicates that manufacturers are diversifying away from conventional petrochemical inputs toward renewable and waste-derived feedstocks to address sustainability requirements while reducing exposure to feedstock volatility. Our findings suggest that scalable renewable raw materials, supply-chain resilience, and lower-impact surfactant technologies will remain important competitive factors across the global surfactants market .

Investment Opportunities

Where Are Capital Inflows Concentrating in the Surfactants Market?

Capital is concentrating in fermentation-based biosurfactant production and oleochemical feedstock integration. These are the two areas generating the strongest recent regulatory and consumer-demand momentum within the market. This activity signals sustained capital allocation toward compliant, sustainable surfactant chemistries ahead of the 2029 EU deadline.

How Is Infrastructure Investment Shaping Long-Term Capacity in the Surfactants Market?

Our findings suggest that infrastructure investment is shifting toward regional manufacturing capacity expansion in Asia-Pacific. This reflects proximity to the fastest-growing home care and personal care demand base. This shift favors producers with existing local formulation infrastructure that can scale alongside rising consumption in China and India.

What ESG Considerations Are Influencing Investment Decisions in the Surfactants Market?

Environmental, Social, and Governance considerations in the market center directly on biodegradability and responsible feedstock sourcing. This reflects surfactants' direct environmental release profile through wastewater. We found that investors increasingly favor producers demonstrating documented biodegradable product portfolios and sustainable palm oil sourcing certification.

Key Benefits for Stakeholders

How Does This Report Benefit Industry Leaders?

Industry leaders gain segment-level revenue forecasts and CAGR benchmarks across product type, feedstock type, and end-user application axes. These are grounded in the same 2025–2035 figures used consistently throughout this market analysis. Our findings on regional growth differentials further support manufacturing-capacity decisions.

How Does This Report Benefit Investors and Financial Analysts?

Investors and financial analysts gain a reconciled market sizing model, competitive-landscape assessment, and named-company development tracking that supports valuation decisions. The report's Growth Catalyst & Risk Assessment Matrix quantifies driver and restraint impact on CAGR, aiding scenario analysis for portfolio positioning.

How Does This Report Benefit Technology Vendors and Product Teams?

Technology vendors and product teams gain visibility into which market segments, such as Fermentation-Based feedstock and Pharmaceutical and Healthcare applications, are growing fastest. This informs where to prioritize formulation research through 2035.

Key Market Segments Evaluated

By Product Type

  • Anionic Surfactants
  • Nonionic Surfactants
  • Cationic Surfactants
  • Amphoteric Surfactants
  • Silicone Surfactants
  • Fluorinated Surfactants
  • Polymeric and Structured
  • Surfactant Blends

By Feedstock Type

  • Fossil-Based
  • Oleochemical
  • Fermentation-Based
  • Mixed Feedstock
  • Unclassified Feedstock

By End-User Application

  • Home Care
  • Personal Care
  • Industrial and Institutional Cleaning
  • Agriculture
  • Oilfield
  • Textile and Leather
  • Paints, Coatings and Adhesives
  • Plastics and Rubber
  • Pulp and Paper
  • Food Processing
  • Mining and Mineral Processing
  • Construction and Asphalt
  • Lubricants and Metalworking
  • Water Treatment
  • Pharmaceutical and Healthcare
  • Other Industrial Applications

By Product Form

  • Liquid
  • Paste
  • Powder
  • Granule
  • Flake
  • Aqueous Concentrate
  • Other Product Forms

By Sales Channel

  • Direct Sales
  • Distributor Sales
  • Online & E-Commerce
  • Other Contracted Channels

Conclusion & Recommendations

The long-term outlook for the market remains steadily positive. The market will expand from USD 56.93 Billion in 2026 to USD 85.17 Billion by 2035 at a 4.58% CAGR. This growth is driven by EU regulation and rising Asia-Pacific consumption. We observed that this trajectory is underpinned by durable regulatory and consumption cycles rather than speculative demand.

What Strategic Positioning Do We Recommend for the Surfactants Market?

Our assessment indicates that producers should prioritize fermentation-based biosurfactant development ahead of the 2029 EU compliance deadline. Companies without established oleochemical feedstock integration should pursue targeted partnerships rather than delayed investment. This reflects the market's clear shift toward sustainable, compliant chemistries.

How Attractive Is the Surfactants Market for Investment?

Investment attractiveness is high in Middle East & Africa and Latin America given superior CAGR profiles of 6.70% and 6.12% respectively. Asia-Pacific offers the largest absolute revenue base within the market. We found that fermentation-based and personal care revenue streams offer stronger margin profiles than mature commodity segments alone.

What Are the Key Market Shifts and Risks in the Surfactants Market?

Key risks include petrochemical and palm oil feedstock price volatility, alongside intensifying 1,4-dioxane and PFAS regulatory scrutiny. Our analysis shows that producers unable to complete biodegradability-compliant reformulation ahead of regulatory deadlines risk losing qualification with major brand owners in the market.

What Are the Primary Growth Pathways Through 2035 for the Surfactants Market?

Primary growth pathways for the market include fermentation-based biosurfactant expansion, mild personal care chemistry development, and oleochemical feedstock integration. We observed that producers combining all three pathways are best positioned to capture a disproportionate share of the USD 28.24 Billion absolute opportunity created between 2026 and 2035.

Delivered Customizations

We have successfully delivered the following deep-dive customizations:

Client Request Customization Delivered Value Adds
Historical Market & Sales Analysis
  • Historical surfactant revenue and volume analysis by product type (anionic, nonionic, cationic, amphoteric) and by feedstock type.
  • Identifies high-growth surfactant classes and feedstock shifts to guide portfolio and capacity priorities.
Import-Export Trade Assessment
  • Country-wise import and export analysis of key surfactant products and oleochemical and petrochemical intermediates.
  • Reveals trade dependencies and supply gaps to support sourcing, partner selection, and market entry.
Company-Level Product Share Analysis
  • Producer-wise share across surfactant product types and product forms, based on disclosed portfolios and segment reporting.
  • Highlights competitive positioning and white-space product categories for portfolio expansion.
Bio-Based vs Petrochemical Feedstock Economics
  • Comparison of palm, coconut, and other oleochemical feedstocks with petrochemical routes by price trends, supply exposure, and producer sourcing mix.
  • Supports feedstock sourcing strategy and hedging against raw material price volatility.
End-User Application Demand Mapping
  • Surfactant demand mapped across end-user applications (household and personal care, industrial cleaning, agrochemicals, oilfield, textiles, and others) by product type.
  • Prioritizes high-value application segments and guides targeted product development and customer outreach.
Regulatory & Sustainability Impact Assessment
  • Assessment of biodegradability, REACH, and palm-sourcing sustainability regulations and their effect on product type, feedstock, and product form choices.
  • Anticipates compliance-driven demand shifts and supports reformulation and green-surfactant investment decisions.

FAQs

About the Author

Mayurima Roy

Mayurima Roy

Mayurima Roy is Research Analyst at Next Move Strategy Consulting, where she has spent 4 years working across the firm's full industry coverage rather than a single fixed vertical. Her work centers on structured research, ongoing trend tracking, competitive assessment, and insight-led content development, translating complex market data into clear, decision-ready narratives that support informed client decision-making across diverse global industries, market sectors, and world regions every day.

About the Reviewer

Supradip Baul

Supradip Baul

Supradip Baul is an accomplished business consultant and strategist with over a decade of rich experience in market intelligence, strategy, technology, and business transformation. His work has included rigorous qualitative and quantitative analysis across multiple industries, helping clients shape investment decisions and long-term roadmaps. Earlier in his career, he was associated with Gartner, where he contributed to industry-leading reports and market share analyses. He has worked with leading global companies and holds an MBA with a dual specialization in Marketing and Finance.

Download Free Sample

Kishu Kanda

KISHU KANDA

Strategy Analyst

Accenture

We purchased the AI Consumer Market Report from this company. Not only did they customize the report to meet our specific requirements, but they also showed great flexibility in accommodating our budget. The report we received fully met our expectations. Additionally, they provided prompt and thorough responses to both our pre-purchase and follow-up questions. We look forward to working with this company again in the future.

Mohit Agarwal

MOHIT AGARWAL

Chief Manager

DryChem India Pvt. Ltd.

Next Move Strategy Consulting is an amazing team of consultants. We required a market study report for our investors on top priority and the team went above and beyond our expectations to deliver the same with ample supporting data within a short time span enabling us to secure the investments and keep our project timeline maintained. Their professionalism, attention to detail, and timely delivery of actionable recommendations have left a lasting impression on our organization.

Diana Trejo

DIANA TREJO

Assistant Manager

Sumitomo Corporation de Mexico, S.A. de C.V.

Recently, we purchased a report on the Mexico Data Center Market from Next Move Strategy Consulting. The service has been excellent, with support that is always timely and thoroughly professional. The information provided is interesting, highly useful, and delivered with clarity. I would highly recommend NextMSC for anyone seeking insightful and dependable analysis.

Kevin Coker

KEVIN COKER

Founder, CEO and Board Diector

Proxima Clinical Research

I have been using Next MSC reports for product positioning in a new geography for a long time. They have by far the best reports I have found and the price is reasonable too!

Gaurav Jaiswal

GAURAV JAISWAL

Founder & CEO

Yano Charge Private Limited

The EV Charging market research report provided by the NextMSC was exceptionally detailed and insightful. It offered a comprehensive analysis that proved to be a game-changer for our strategic planning. Truly a testament to the NextMSC’s expertise and thoroughness in EV market landscape & analysis.

Custom Market Research Services

We will customize the research for you if the listed report does not fully match your requirements.
Get 30% Free Customization

Select License

This website uses cookies to ensure you get the best experience on our website. Learn more

✖