Waste to Energy Market by Technology (Thermal Conversion, Biological Conversion, and Physical and Chemical Conversion) by Waste Type (Municipal Solid Waste (MSW), Industrial Waste, Agricultural Waste, Construction & Demolition (C&D) Waste, Medical Waste, Sewage and Sludge Waste and Others), By Energy Output (Electricity Generation, Heat Generation, and Others), and By Application (Waste Treatment and Energy Generation) - Global Opportunity Analysis and Industry Forecast 2021-2030
Industry: Energy & Power | Publish Date: 07-Apr-2025 | No of Pages: 431 | No. of Tables: 308 | No. of Figures: 253 | Format: PDF | Report Code : EP404
Market Definition
The global Waste to Energy Market was valued at USD 33.05 billion in 2019 and is predicted to reach USD 53.07 billion by 2030 with a CAGR of 4.4% from 2020-2030. Waste to energy is a process of generating energy in the form of electricity and heat, through combustion of waste into a fuel source.
Waste to energy processes produce various combustible fuels such as methane, ethanol, and synthetic fuel among others. It is an effective supplement to renewable energy-based power sources that reduces landfill requirements on urban areas and also generates revenue for municipalities and governments.
Waste to energy process causes low carbon emissions and thereby less air pollution as compared to coal-based energy plants. Therefore, it is widely being adopted as a potential energy diversification strategy across the globe.
Market Dynamics and Trends
The depletion of conventional waste resources and the rise in demand for energy are the key driving factors of the waste-to-energy market. Also, the increasing government regulation to limit carbon emissions, rising public concern towards health, and growing need for electricity among industries are the factors complementing the market growth.
In addition, the energy waste-to-energy market growth is propelled by the increasing municipal waste generation, the inclination of the public towards effective waste-to-energy techniques such as various biochemical treatments, aerobic and anaerobic digestion, and the imposition of government penalties for poorly managed waste.
However, lack of flexibility in handling waste, high initial cost for setting up the energy waste-to-energy plants and lack of skilled workforce are the factors hampering the growth of the market.
Also, concerns related to the associated environmental hazards and regulatory hurdles are hindering the growth of the market to some extent. On the contrary, increasing investment in various R&D activities to enhance the economic viability of anaerobic digestion facilities, growing demand for cleaner fuel and government initiatives to save the planet from global warming will provide lucrative growth opportunities for the market players in the coming years.
Market Segmentations and Scope of the Study
The waste-to-energy market report has been segmented on the basis of technology, waste type and geography. On the basis of technology, the market is categorized into thermal, biochemical and others. The thermal technology segment is further subdivided into incineration, pyrolysis, gasification and others. On the basis of waste type, the market is categorized into municipal solid waste (MSW), agricultural waste, and others. Based on geography, the market is segmented into North America, Europe, Asia Pacific and RoW.
Geographical Analysis
Europe holds the lion’s share of the global waste-to-energy market. This is attributed to factors such as favorable regulatory policies including landfill tax, carbon tax, and increasing focus on reducing greenhouse gases to control global warming.
On the other hand, North America also occupied a significant market share and is expected to continue this trend throughout the forecast period owing to the gradual climate change in this region and government emphasis on enhancing the utilization of clean electricity.
However, Asia Pacific is expected to experience the highest growth rate throughout the forecast period due to increasing government funding for managing municipal waste and growing awareness regarding waste to energy plants across various countries such as China, and India.
Competitive Landscape
Lucrative growth opportunities make the waste-to-energy industry more competitive. Some of the major players in the industry are Ramboll Group, Mitsubishi Power Ltd., Sweco AB, Atlantic Project Company, BioMRF Technologies Inc. , Sogliano Ambiente, Veolia Environnement SA, A2A Ambiente S.p.A, Babcock & Wilcox Enterprises, Inc., Acea Spa, AFRY AB, Hera S.p.A, Magaldi Power S.p.A., Fisia Italimpianti SpA, Valmet Corporation.
The leading players in the market are launching various new products and are focusing on making various agreements to strengthen their foothold in the industry. For instance, on December 4, 2020, Suez Environment S.A. introduced its first recycling plant Circular Polymer in Thailand to reverse the plastic pollution crisis in Asia. Also, on December 11, 2019, Covanta Energy Corporation signed a concession agreement with Zhao Country, China to build a new Energy-from-Waste facility that would deliver a sustainable waste solution to the county.
Key Benefits
-
The waste-to-power market report provides a quantitative analysis of the current market estimations through 2020-2030 that assists in identifying the prevailing market opportunities to capitalize on.
-
The study comprises a deep-dive analysis of the market, including the current and future trends for depicting the prevalent investment pockets in the industry.
-
The information related to key drivers, restraints, and opportunities and their impact on the waste-to-energy market is provided in the report.
-
The competitive analysis of the market players along with their market revenue in the waste-to-energy industry.
-
The SWOT analysis and Porter's Five Forces model are elaborated in the study.
-
Value chain analysis in the market study provides a clear picture of the stakeholders’ roles.
Waste to Energy Market Key Segments
By Technology
-
Thermal Conversion
-
Incineration
-
Gasification
-
Pyrolysis
-
Plasma Arc Gasification
-
-
Biological Conversion
-
Anaerobic Digestion
-
Fermentation
-
-
Physical and Chemical Conversion
-
Refuse-Derived Fuel (RDF)
-
Catalytic Processes
-
By Waste Type
-
Municipal Solid Waste (MSW)
-
Industrial Waste
-
Agricultural Waste
-
Construction & Demolition (C&D) Waste
-
Medical Waste
-
Sewage and Sludge Waste
-
Plastic Waste
-
Electronic Waste (E-Waste)
By Energy Output
-
Electricity Generation
-
Heat Generation
-
Biofuels
-
Hydrogen Production
By Application
-
Waste Treatment
-
Energy Generation
By Geography
-
North America
-
U.S.
-
Canada
-
Mexico
-
-
Europe
-
UK
-
Italy
-
Germany
-
Spain
-
Netherlands
-
Rest of Europe
-
-
Asia Pacific
-
China
-
Japan
-
India
-
Australia
-
South Korea
-
Taiwan
-
Vietnam
-
Rest of Asia-Pacific
-
-
RoW
-
Latin America
-
Middle East
-
Africa
-
Key Players
-
Ramboll Group
-
Mitsubishi Power Ltd.
-
Sweco AB
-
Atlantic Project Company
-
BioMRF Technologies Inc.
-
Sogliano Ambiente
-
Veolia Environnement SA
-
A2A Ambiente S.p.A
-
Babcock & Wilcox Enterprises, Inc.
-
Acea Spa
-
AFRY AB
-
Hera S.p.A
-
Magaldi Power S.p.A.
-
Fisia Italimpianti SpA
-
Valmet Corporation
REPORT SCOPE AND SEGMENTATION:
|
Parameters |
Details |
|
Analysis Period |
2020–2030 |
|
Base Year Considered |
2020 |
|
Forecast Period |
2021–2030 |
|
Market Size Estimation |
Billion (USD) |
|
Market Segmentation |
By Technology (Thermal, Biochemical, and Others) By Waste Type (Municipal Solid Waste (MSW), Agricultural Waste, Others) |
|
Geographical Segmentation |
North America (U.S., Canada, Mexico) Europe (UK, Italy, Germany, Spain, Netherlands, Rest of Europe), Asia-Pacific (China, Japan, India, Australia, South Korea, Taiwan, Vietnam, Rest of Asia Pacific), Rest of the World (Latin America, Middle East, Africa) |
|
Companies Profiled |
Abu Dhabi National Energy Company PJSC (TAQA), John Wood Group Plc, Babcock & Wilcox Enterprises, Inc., C&G Ltd., China Everbright International Limited, Covanta Holding Corporation, Suez, Veolia, Waste Management, Inc., and CNIM. |
")


About the Author
 Jayanta Das is an industry analyst and writer with a keen focus on emerging technologies and sustainable business practices. With a background in engineering and market research, he brings analytical depth to topics like renewable energy, green manufacturing, and industrial transformation. Jayanta is passionate about translating complex data into actionable insights for businesses navigating the shift toward eco-conscious operations.
About the Reviewer
 Supradip Baul is an accomplished business consultant and strategist with over a decade of rich experience in market intelligence, strategy, technology and business transformation. His work has included rigorous qualitative and quantitative analysis across multiple industries, helping clients shape investment decisions and long-term roadmaps. Earlier in his career, he was associated with Gartner, where he contributed to industry-leading reports and market share analyses. He has worked with leading global companies and holds an MBA with a dual specialization in Marketing and Finance.
At Next Move Strategy Consulting, we understand that insightful market research is the cornerstone of successful business decisions. That's why we employ a robust and multifaceted approach, combining various methodologies to deliver the most accurate and actionable data for our clients.
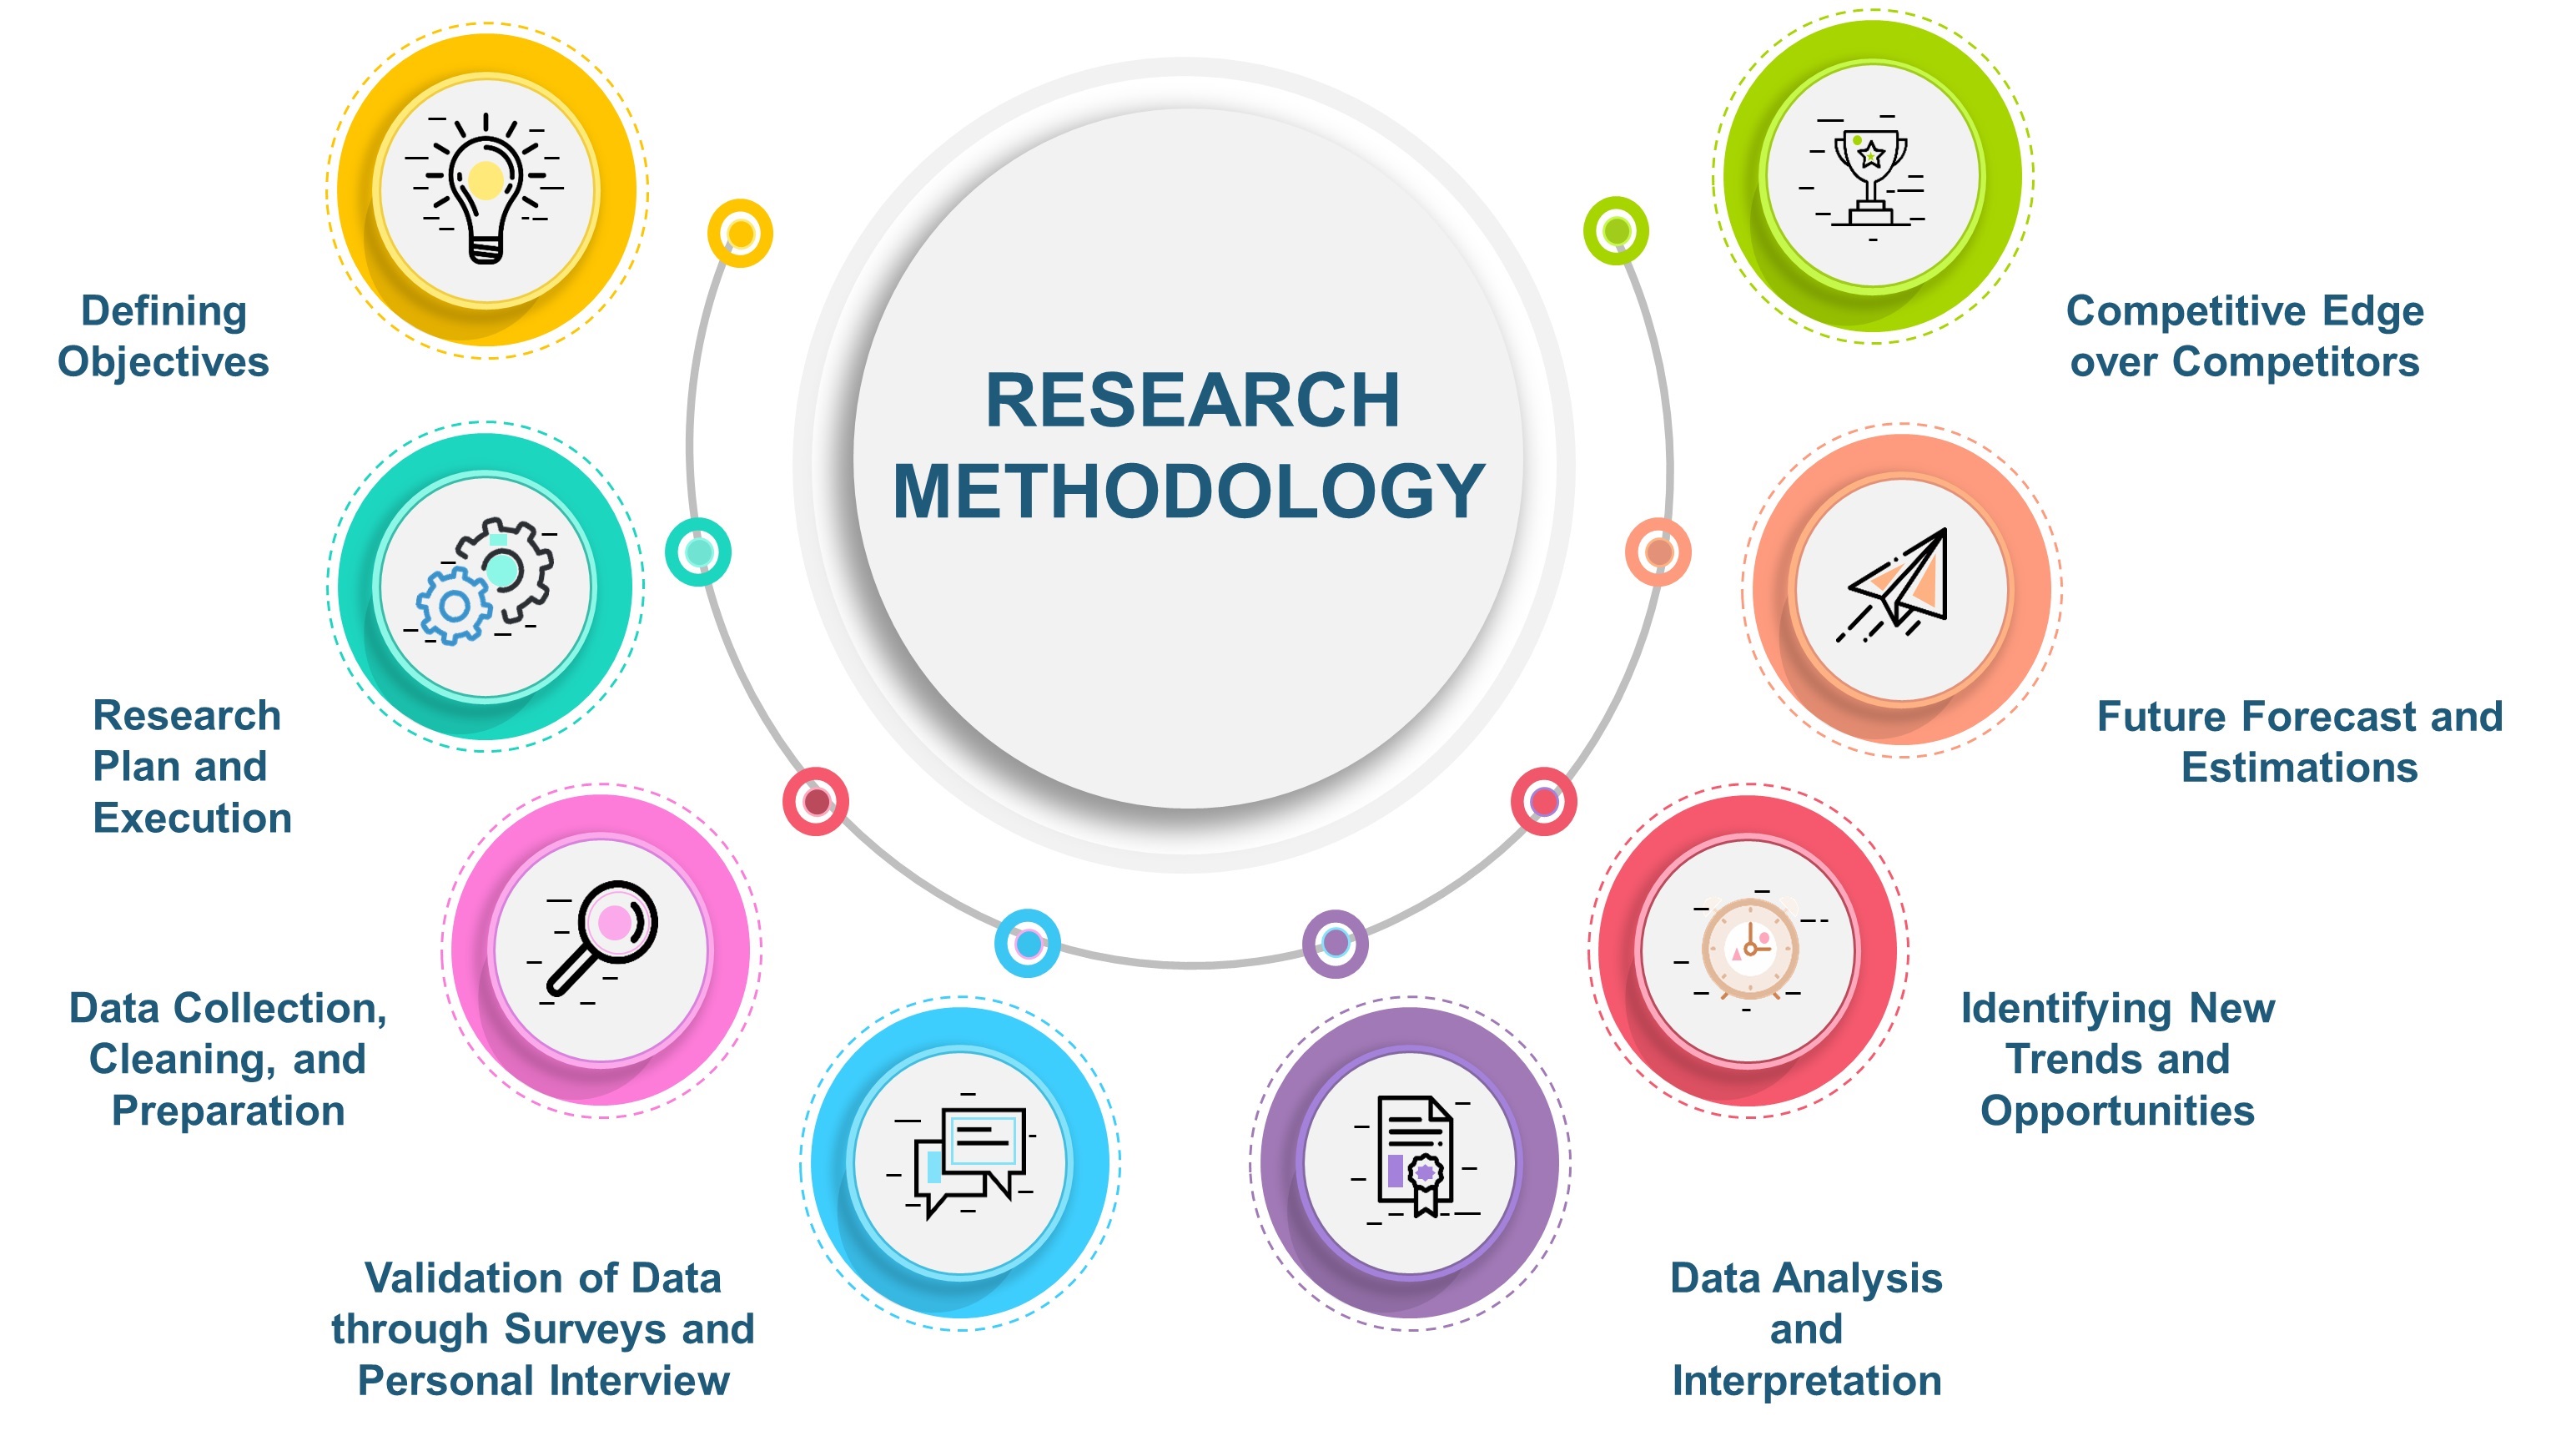
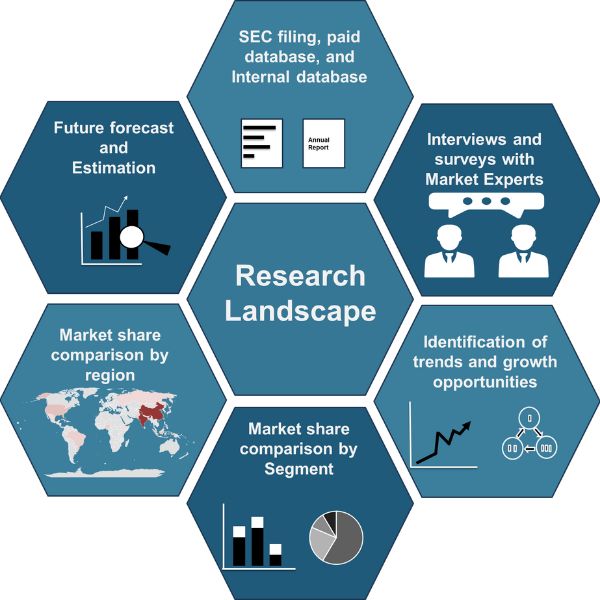
Research Landscape
We navigate the world of research with two primary approaches:
Qualitative Approach
Our qualitative research methodologies involve immersive techniques such as in-depth interviews, focus groups, and observational studies. By engaging directly with individuals and stakeholders, we uncover valuable insights that quantitative data alone may overlook.
Quantitative Research
In tandem with qualitative methodologies, NMSC leverages the power of Quantitative Research to provide a robust foundation of numerical insights. Through systematic data collection and analysis, we quantify patterns, preferences, and market trends, offering a comprehensive view of the business landscape.
Our quantitative research approach employs diverse tools, including surveys, experiments, and statistical modelling. These methodologies enable us to gather data from a large and representative sample, ensuring the statistical significance of our findings. By employing structured questionnaires and standardized data collection methods, we guarantee the reliability and validity of the information we present to our clients.
Quantitative research is particularly effective in measuring the prevalence of trends, assessing market size, and gauging the impact of various factors on consumer behavior. The numerical precision attained through this approach equips our clients with actionable insights, facilitating data-driven decision-making and strategy formulation.
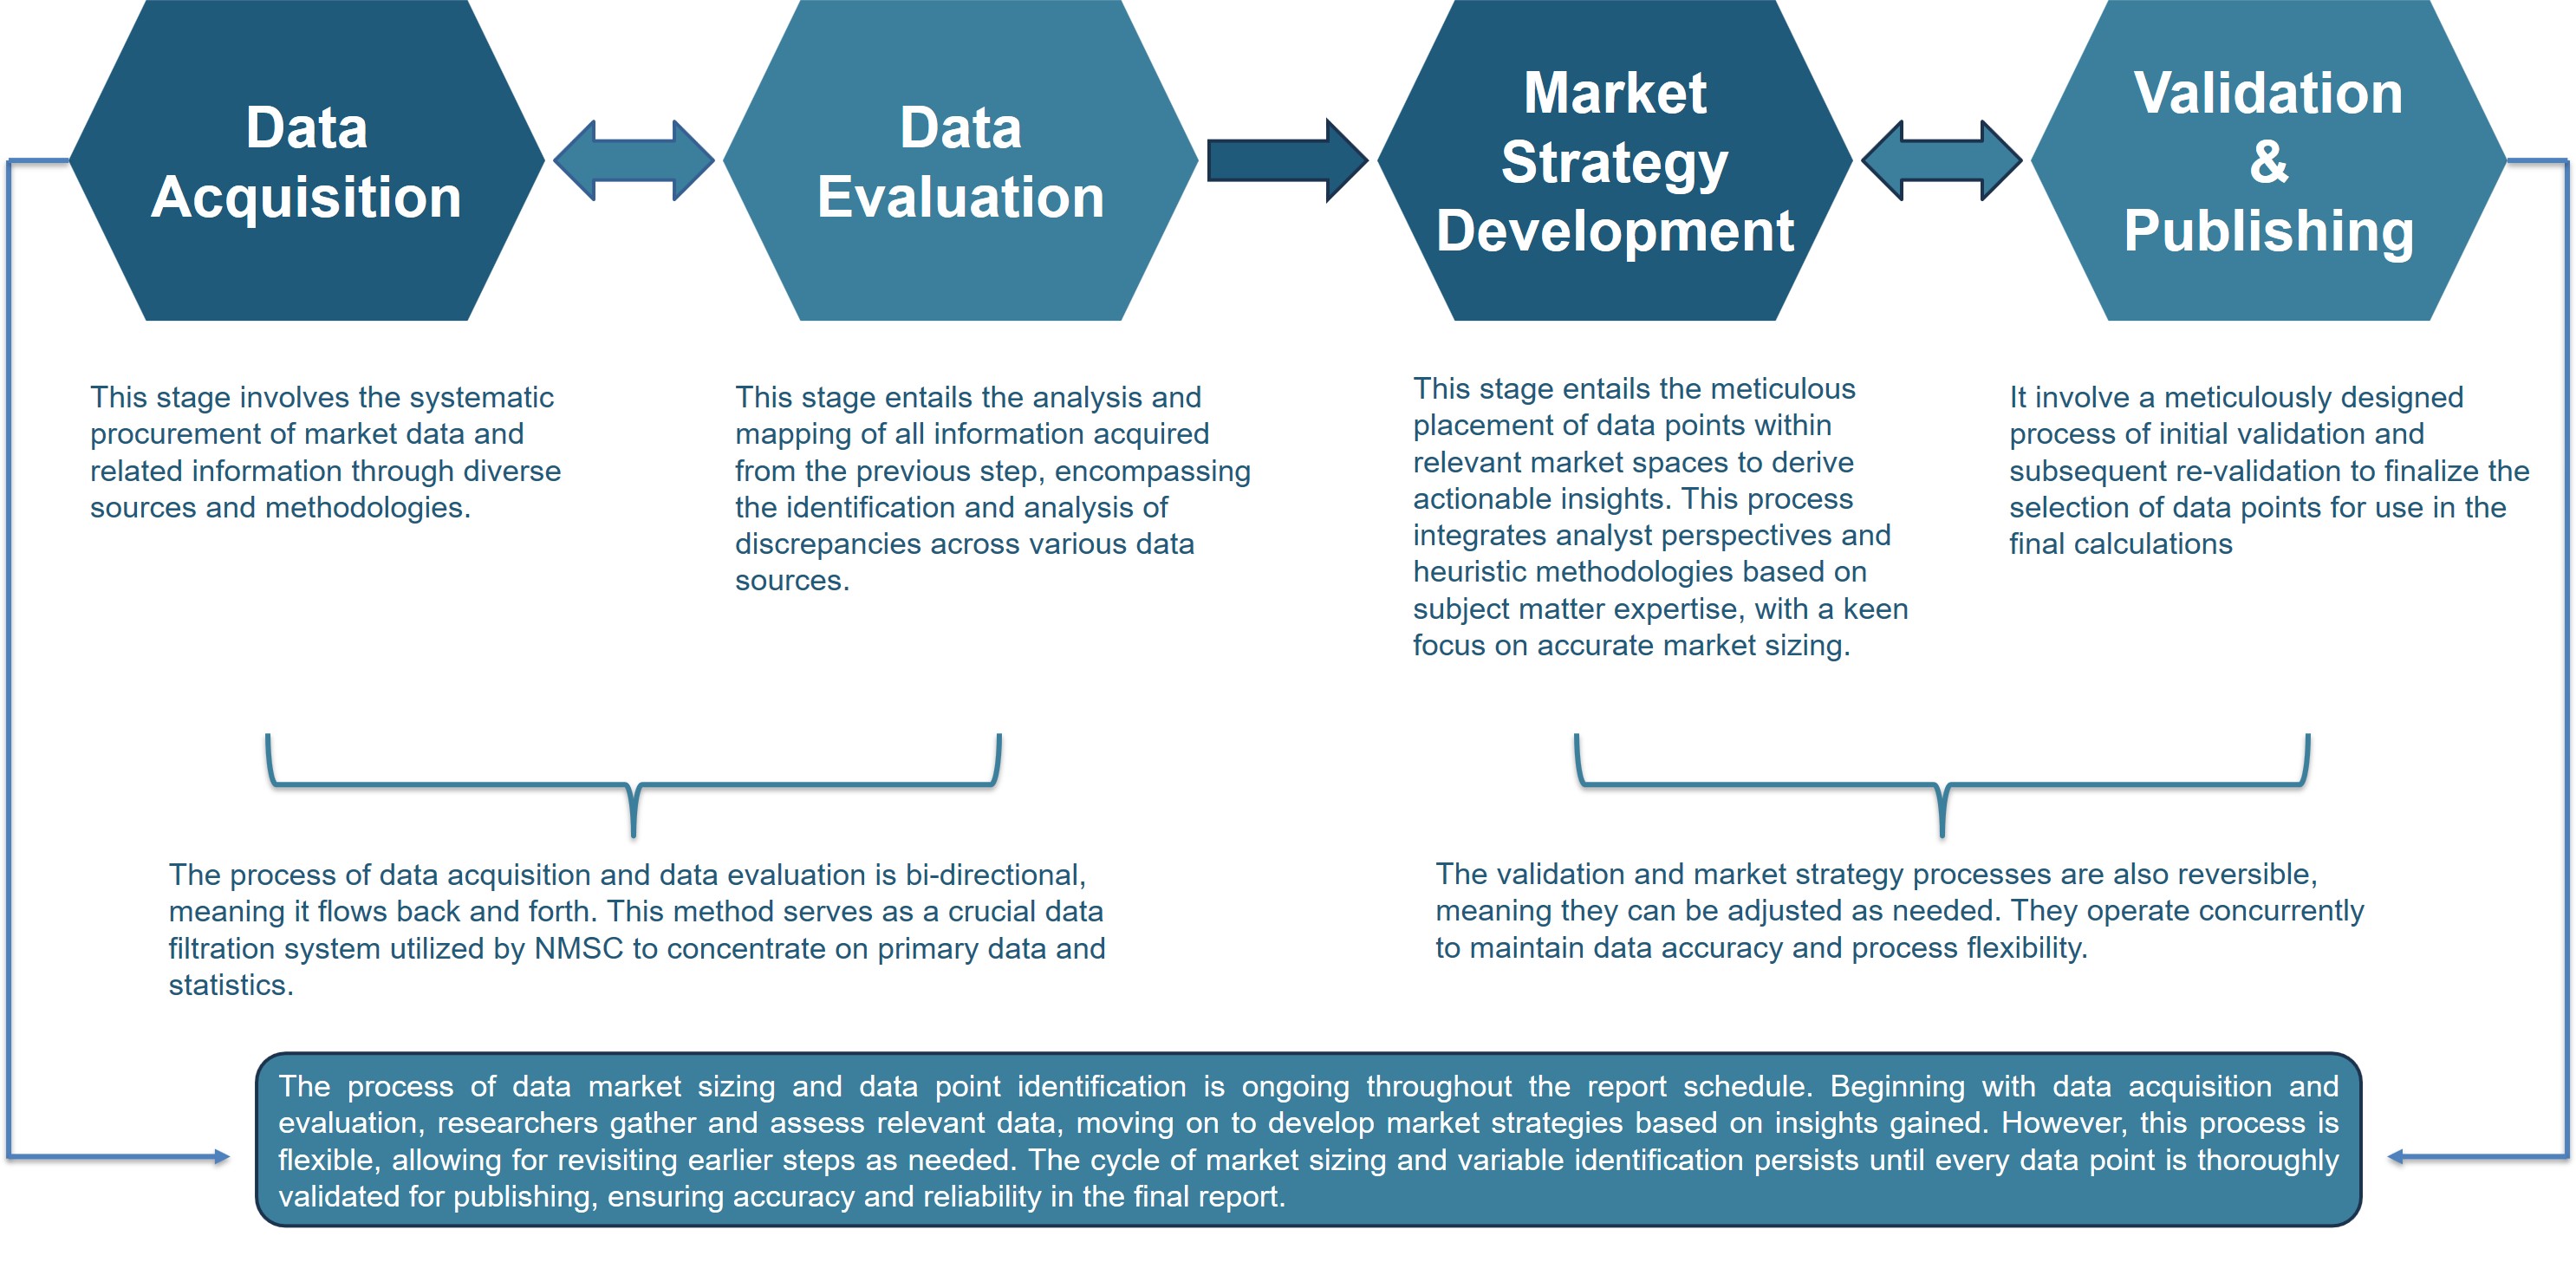
Our Specialized Toolbox for Industry-Specific Market Research
We deploy a specialized arsenal of techniques tailored to meet your unique requirements. Here's a glimpse into our comprehensive toolbox:

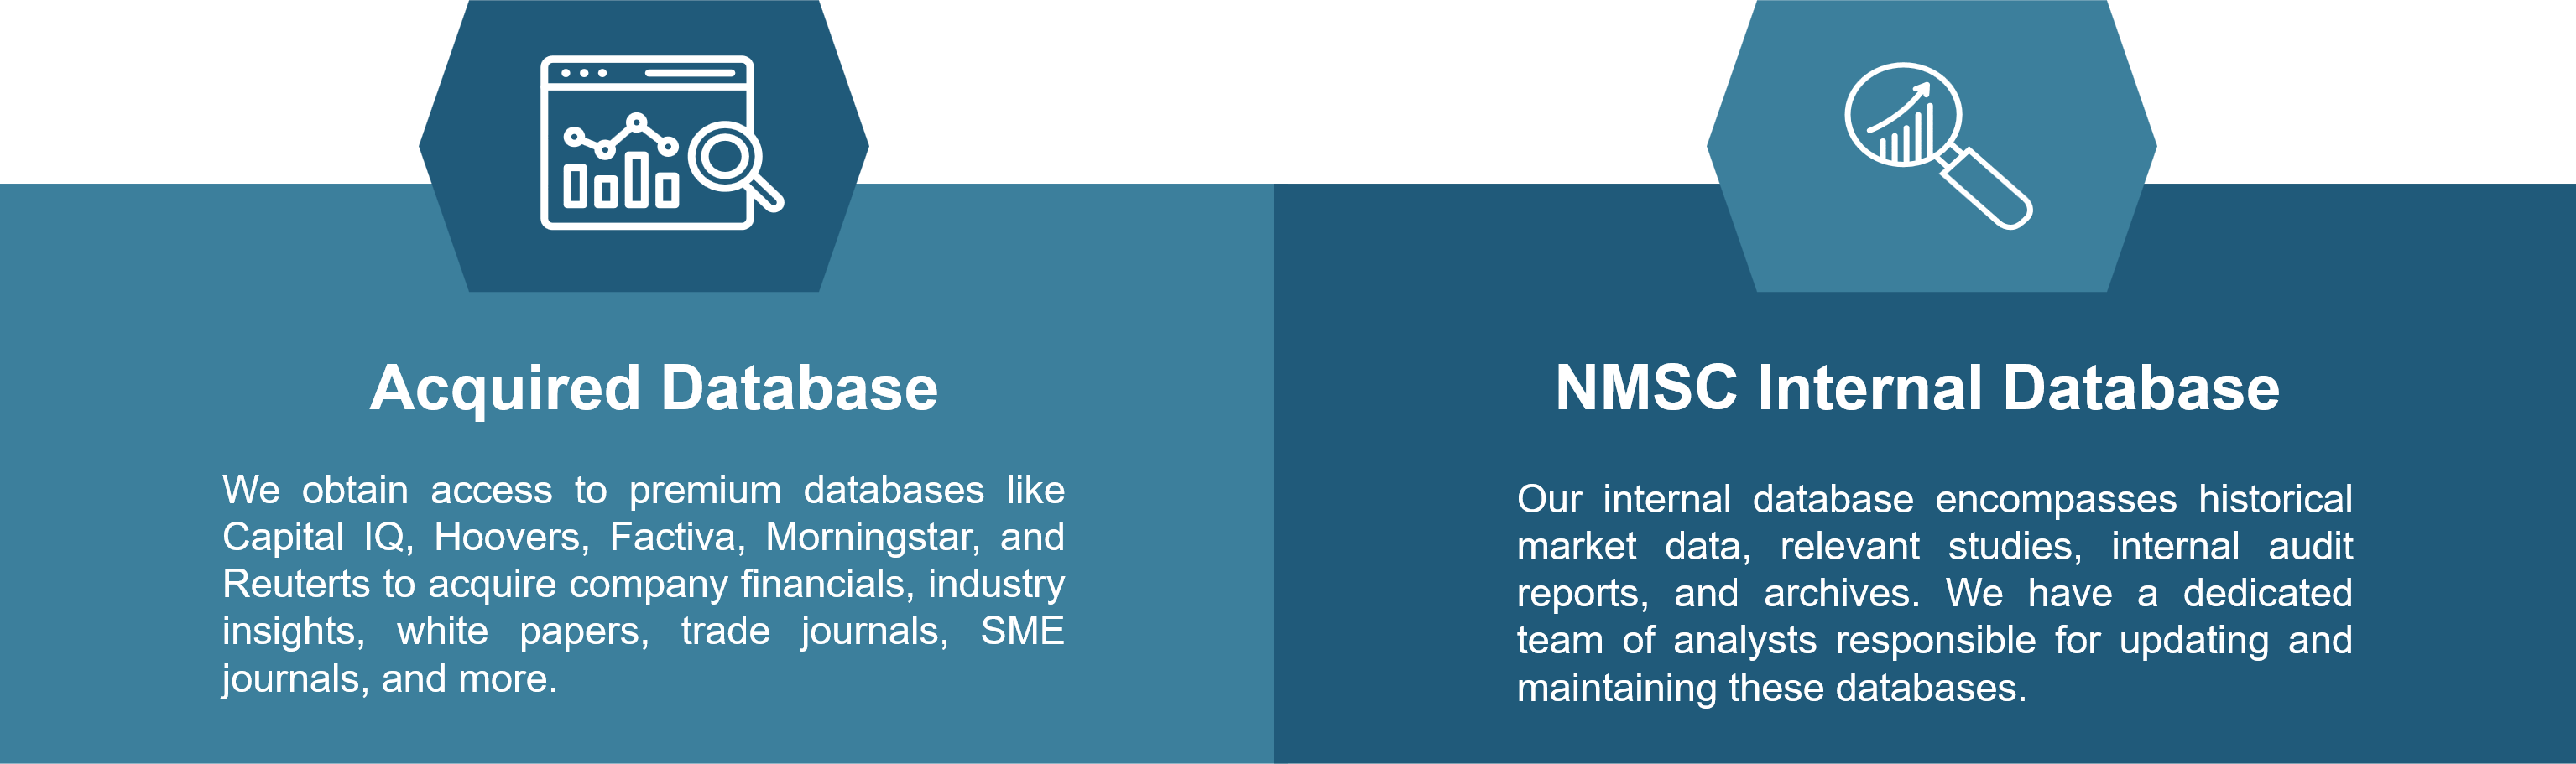
Information Procurement
The stage entails acquiring market data or relevant information through various sources and methodologies.
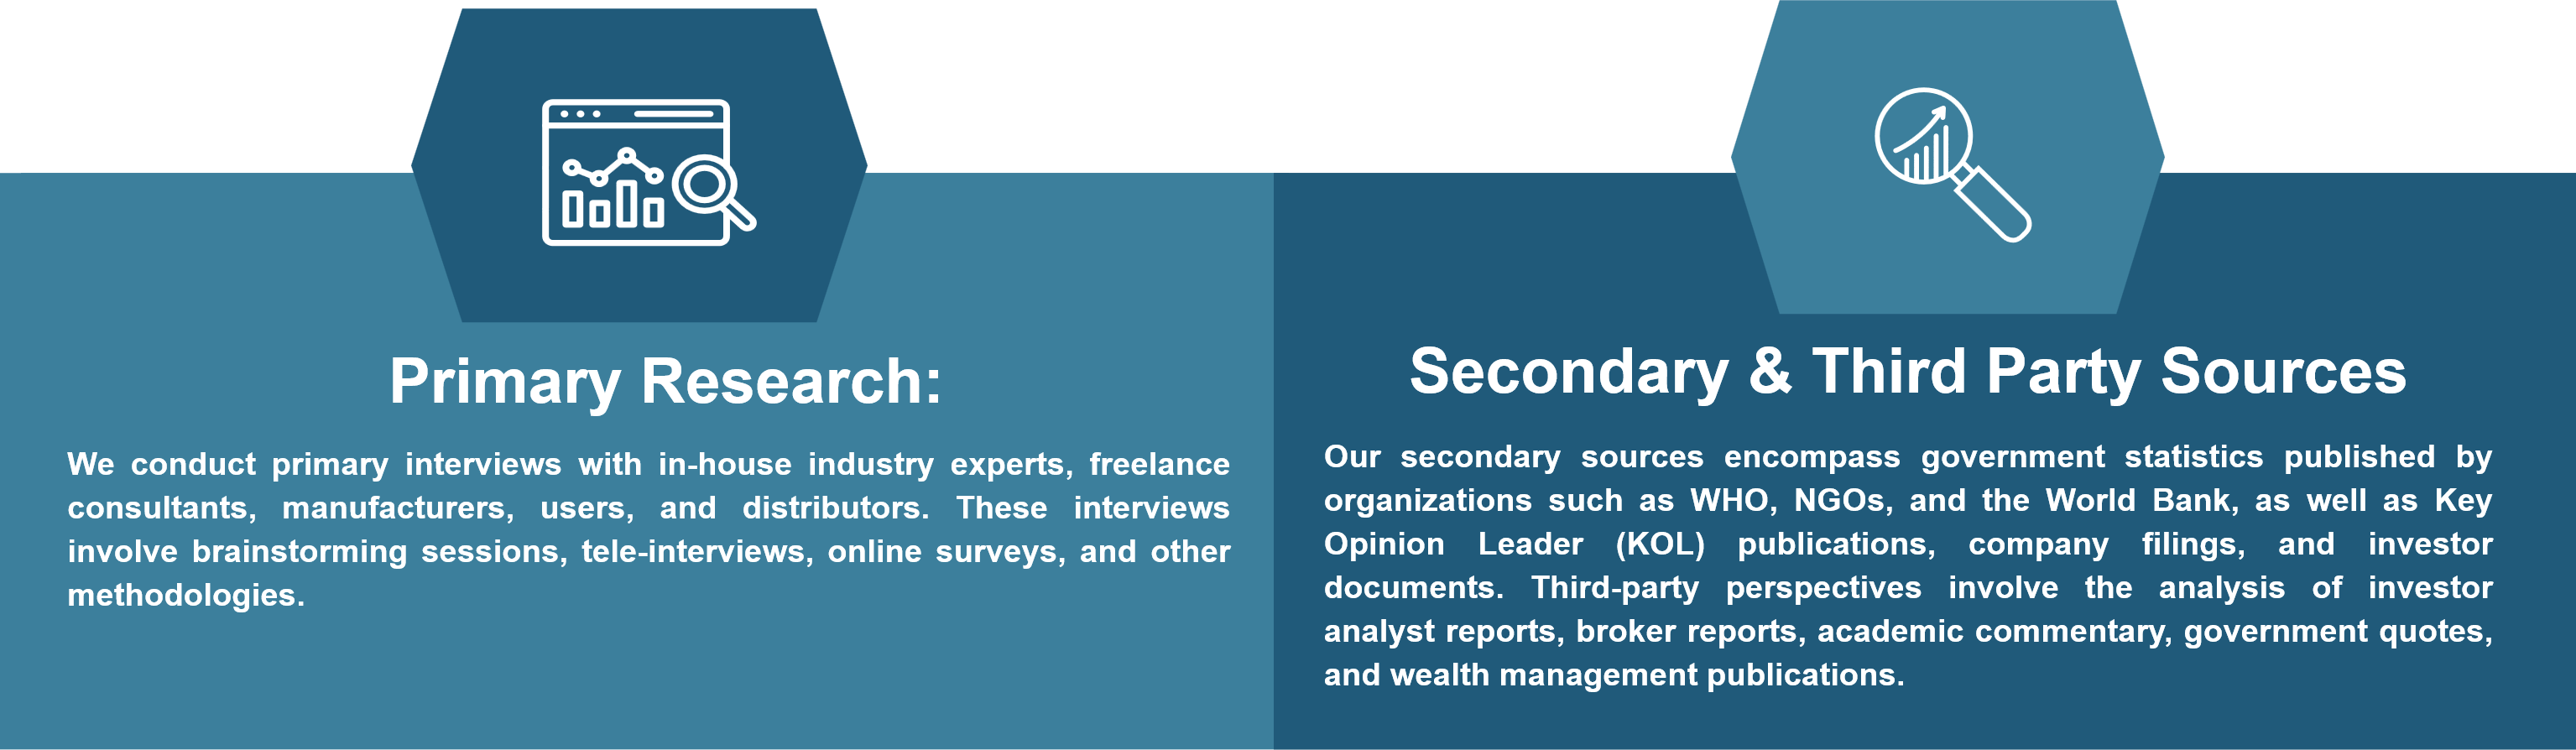
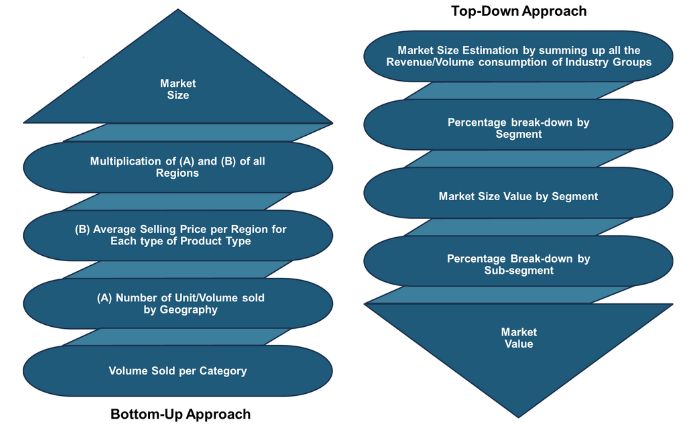
Market Research Approach
We utilize both top-down and bottom-up approaches in market research analysis to achieve a comprehensive understanding of the market dynamics, leveraging the broad perspective of industry trends and macroeconomic factors alongside detailed insights from specific segments and individual companies.
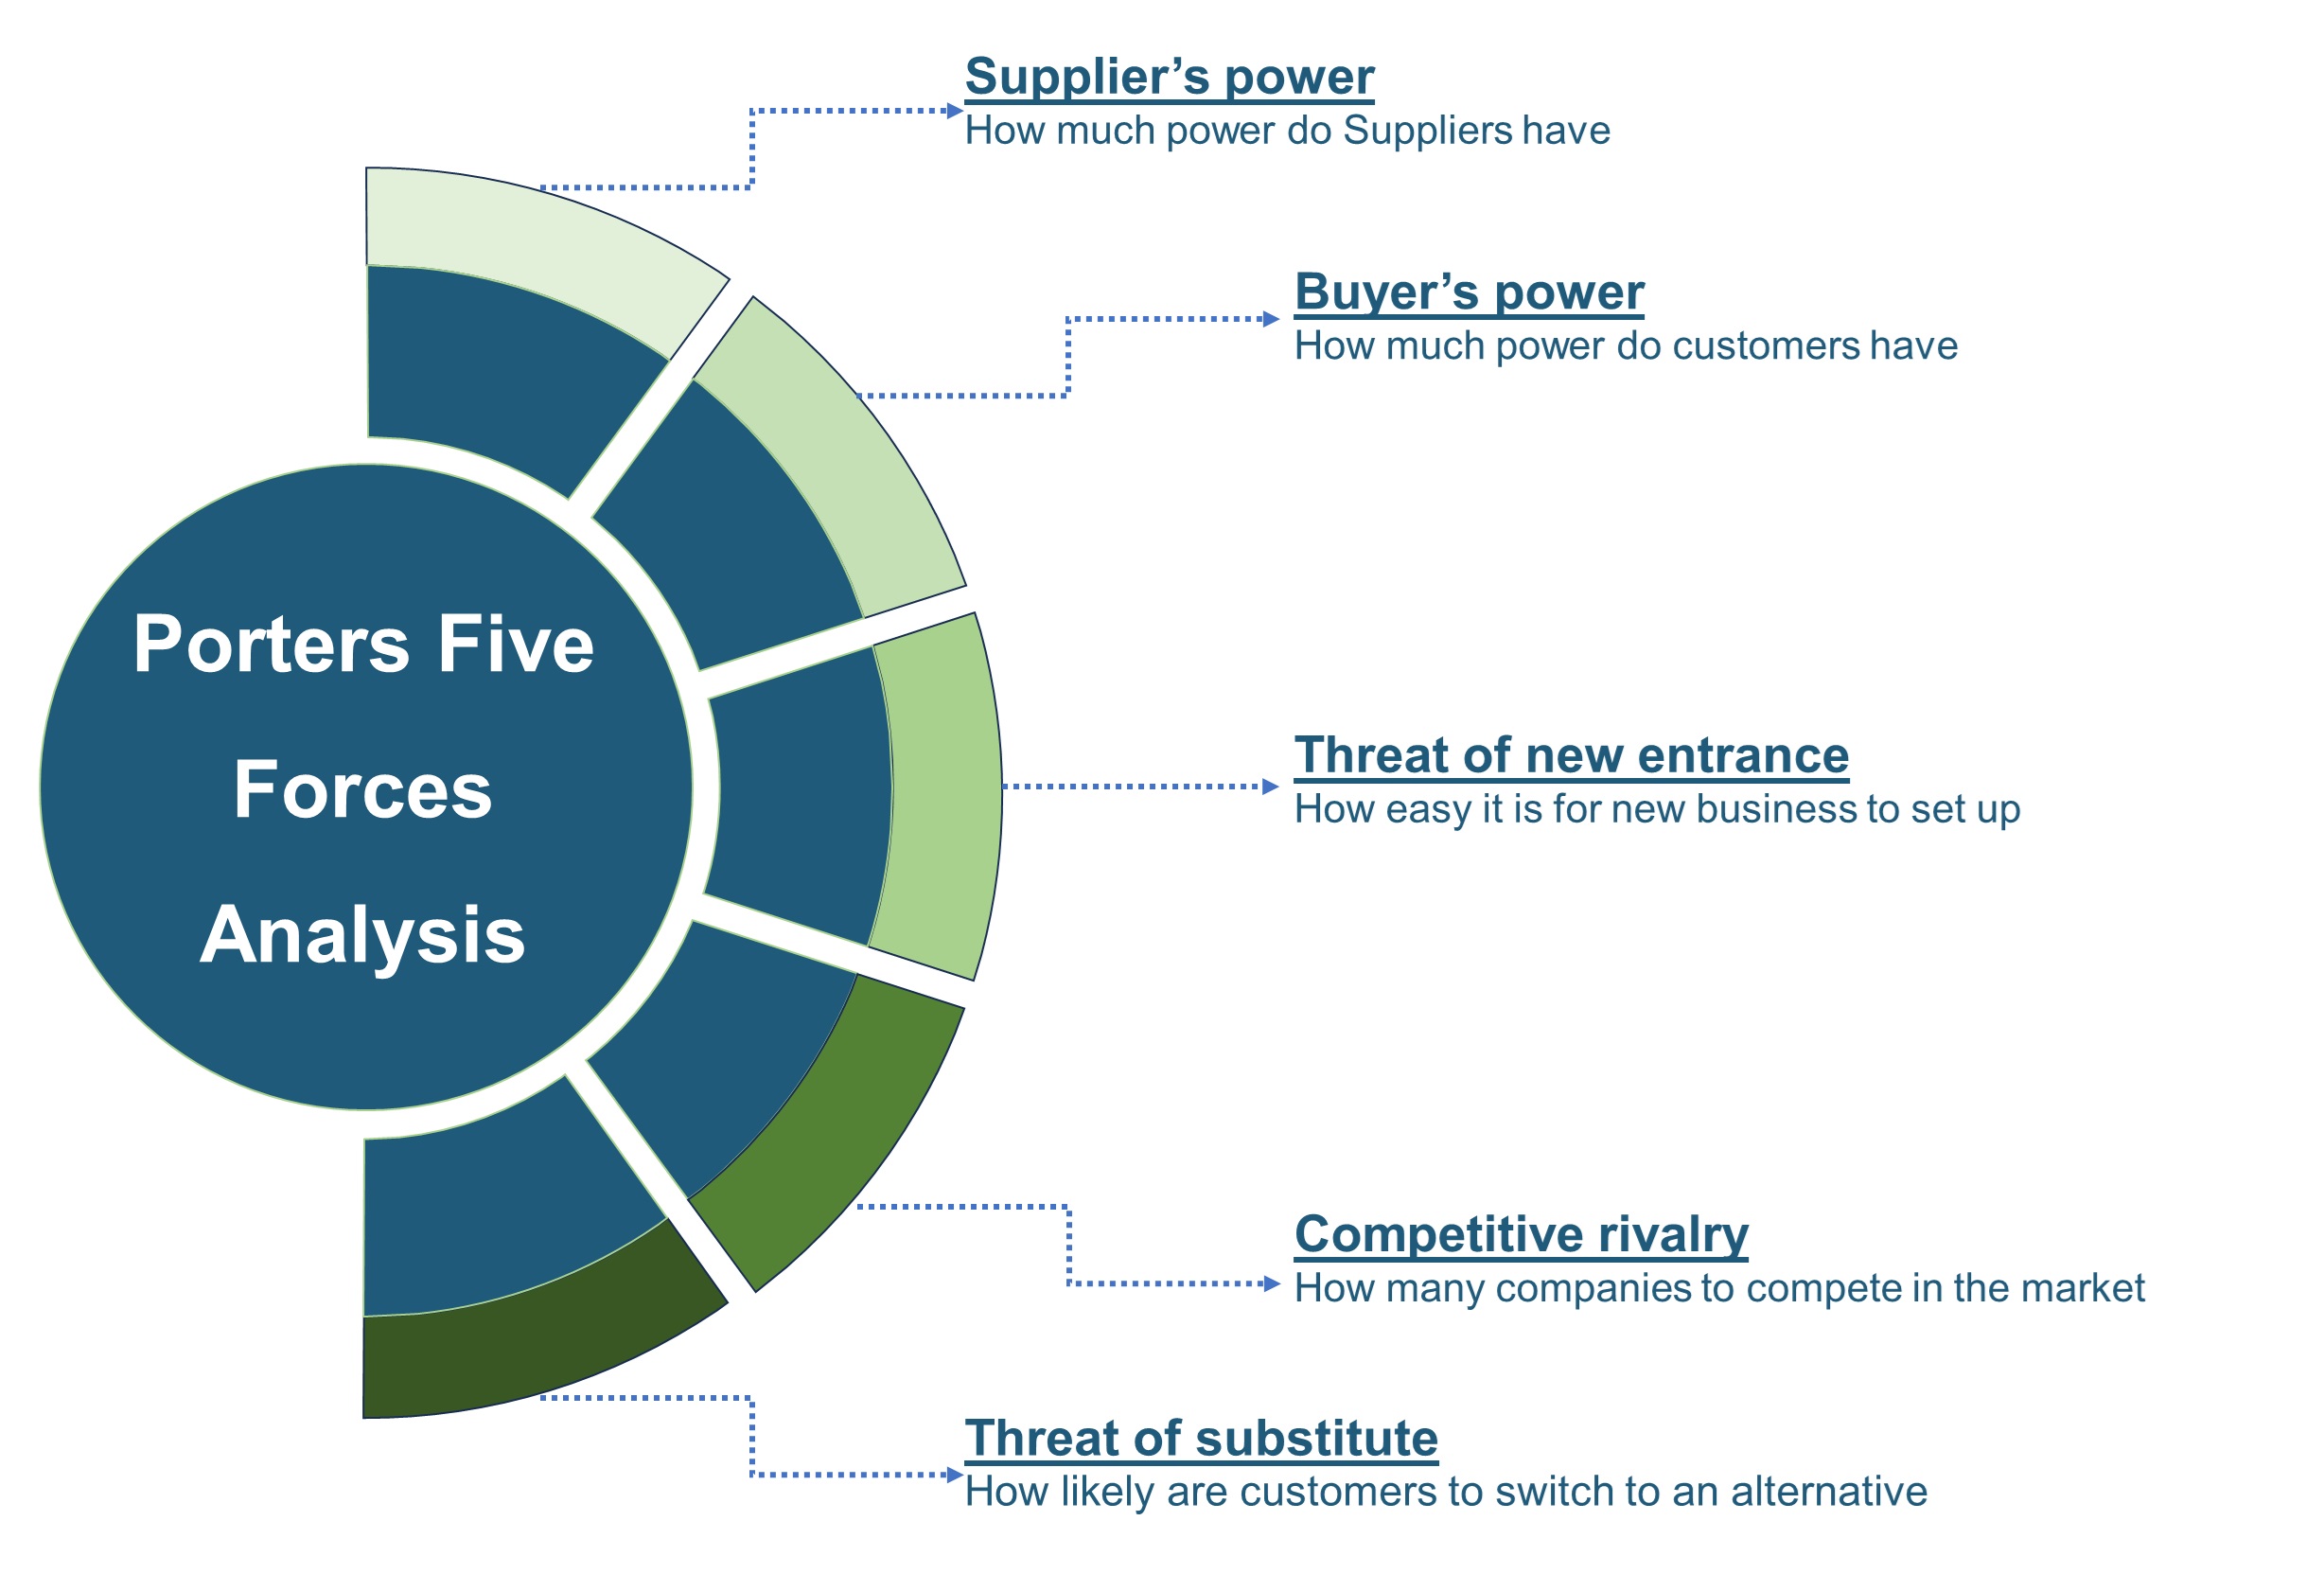
Porters Five Forces Analysis
We conduct Porter's Five Forces analysis to evaluate the competitive landscape of an industry, providing us with insights into factors that affect profitability and strategic positioning.
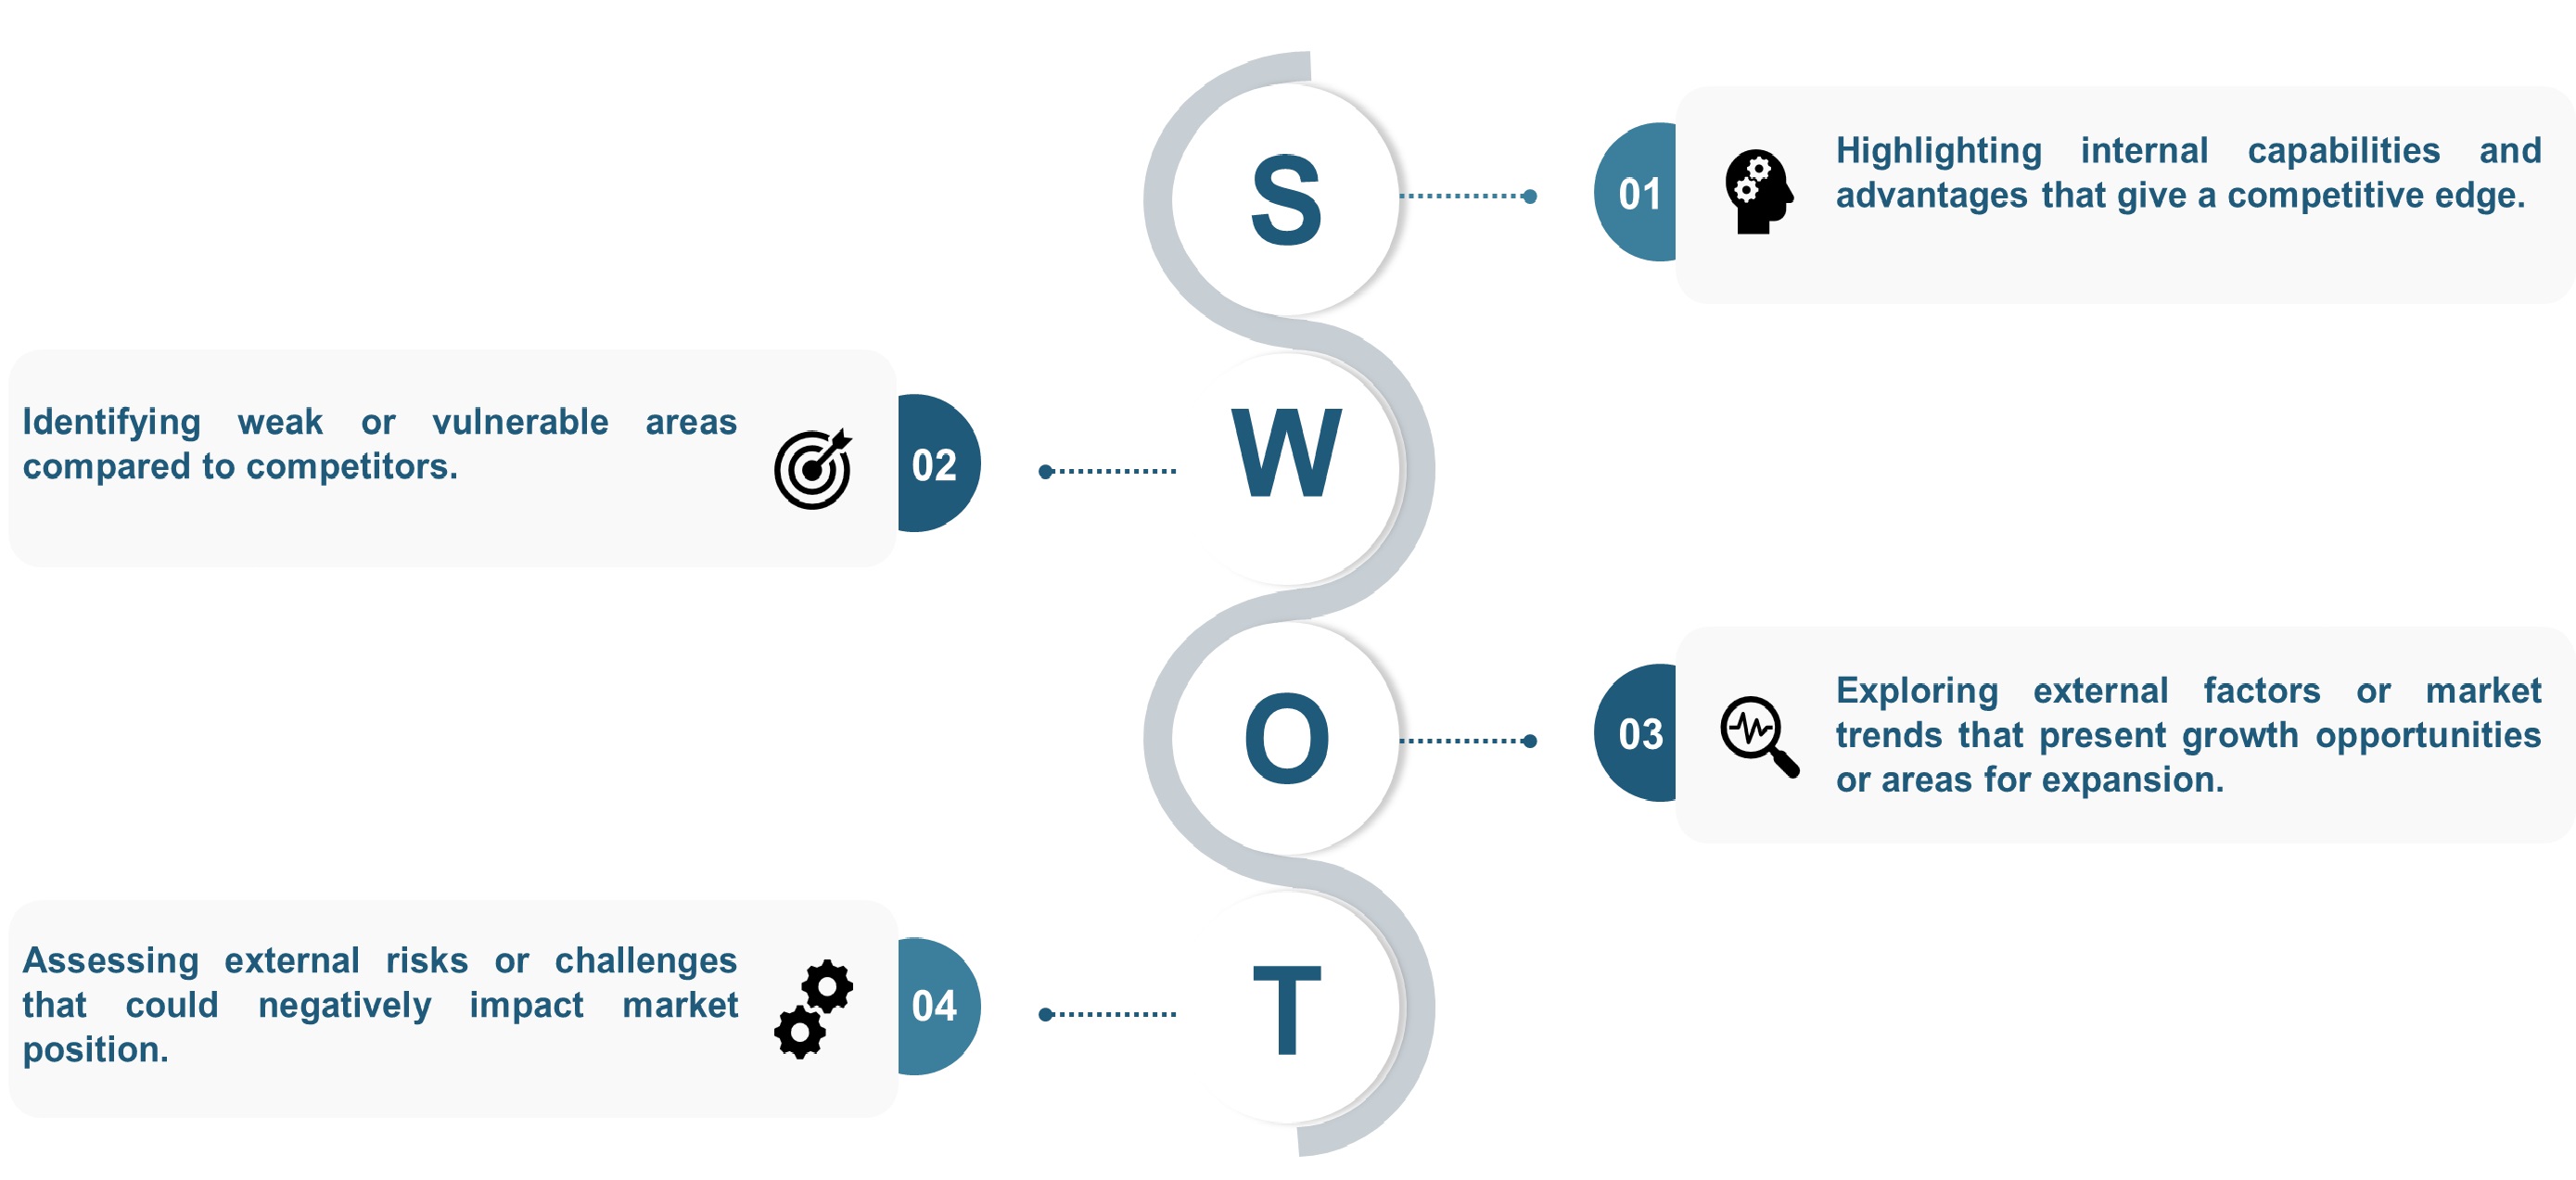
SWOT Analysis
We conduct SWOT analysis to understand market trends, identify potential threats, capitalize on opportunities, and assess our strengths and weaknesses.
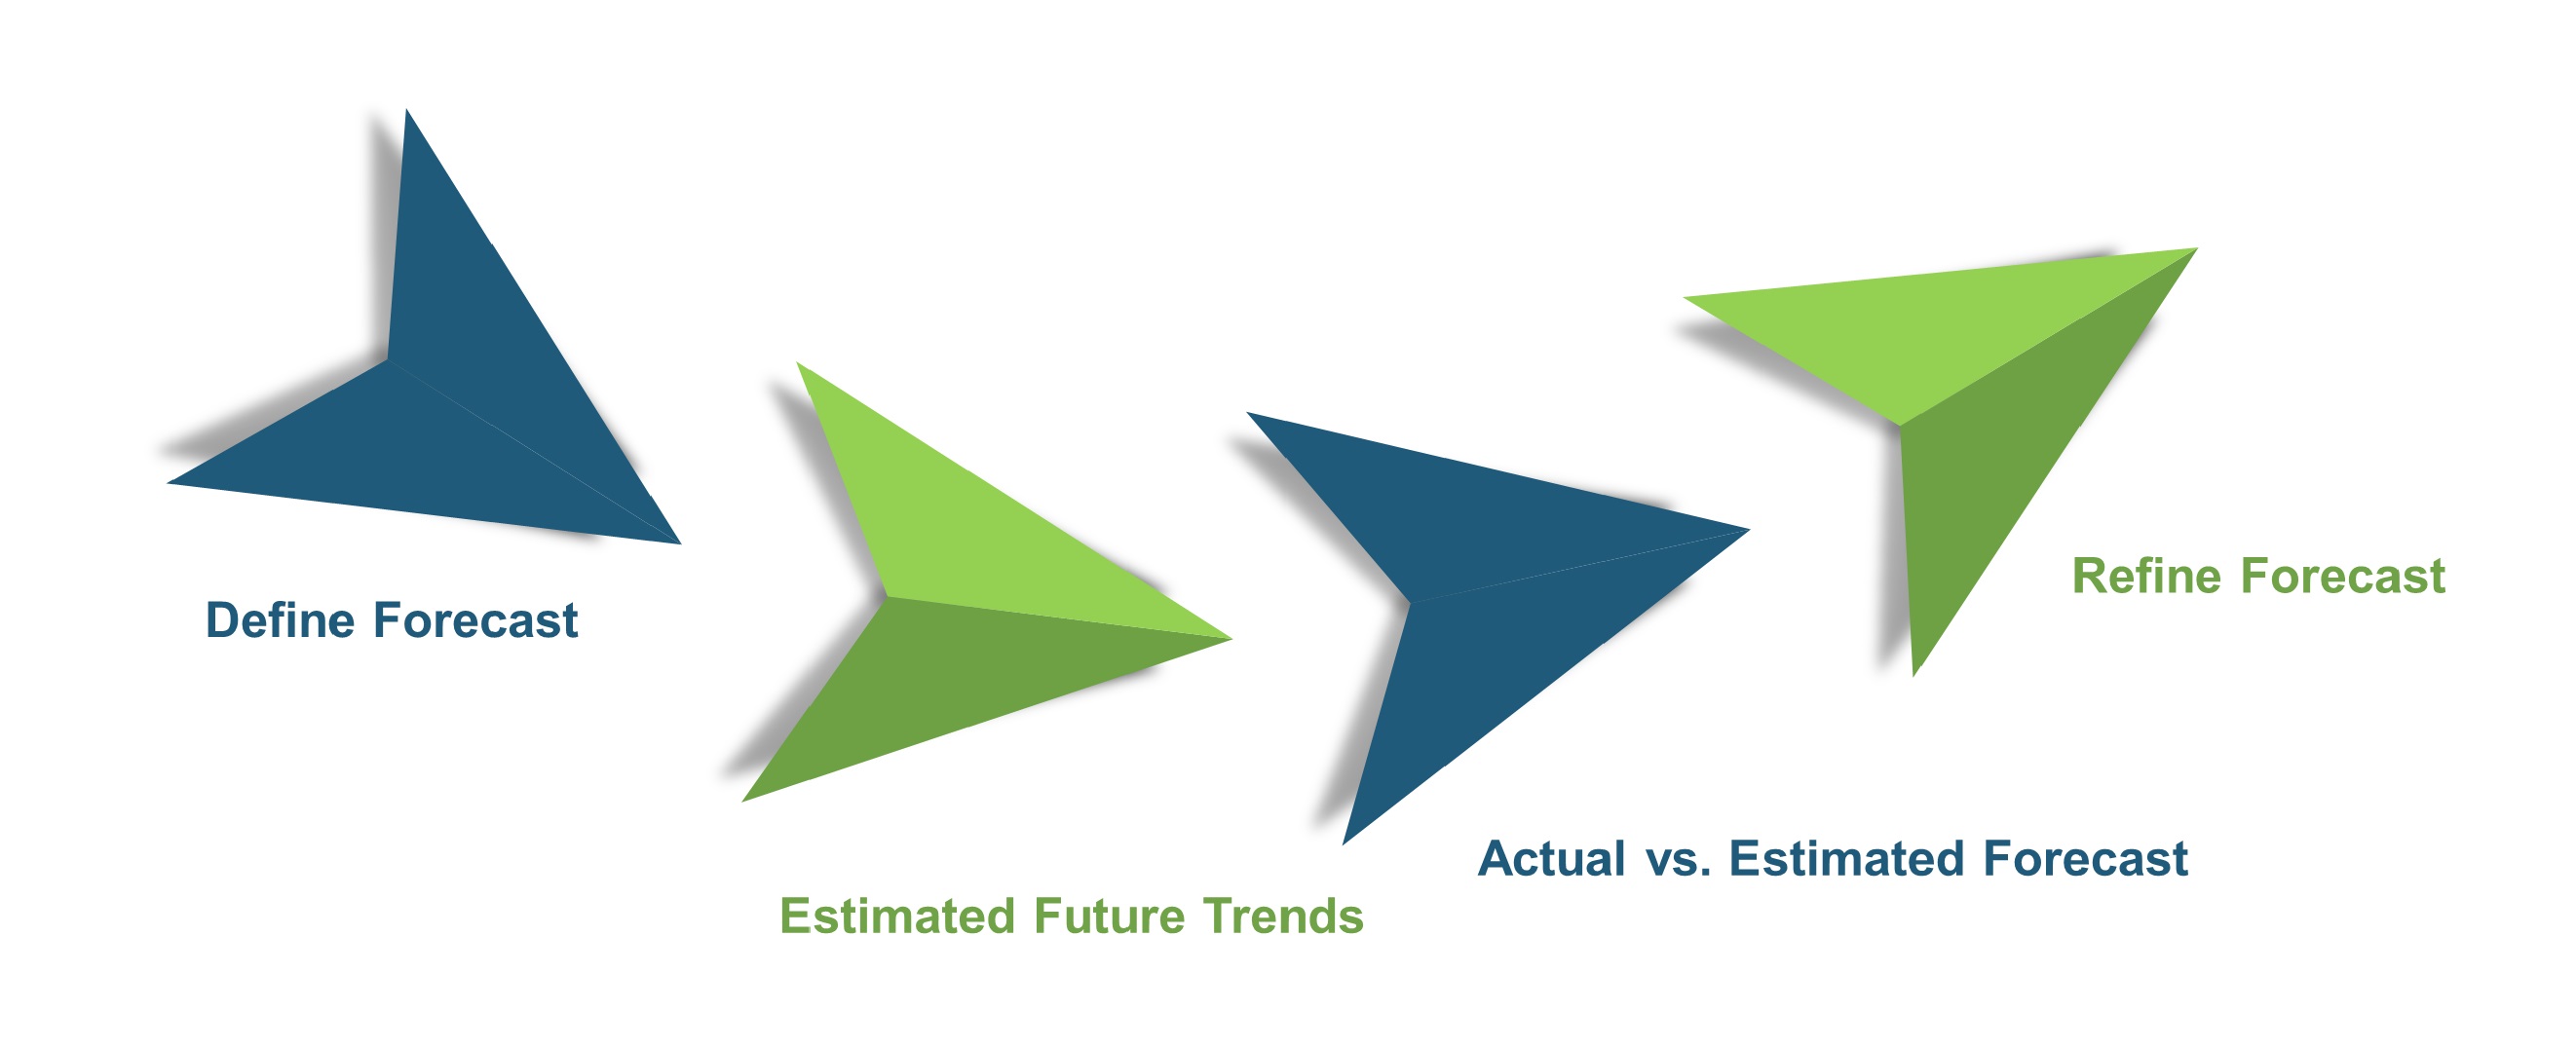
Forecasting
We utilize a forecasting model to predict future consumption by considering parameters like population, economics, regulations, market competition, drivers, constraints, technology, and pricing. We also employ statistical techniques such as multilinear regression, exponential smoothing, moving average, ARIMA, and Monte Carlo simulations for accurate predictions. In econometric forecasting, we analyzed short-term and long-term event impacts, attributing values based on regulatory frameworks, economic factors, and market events.


 Speak to Our Analyst


 Market")