Wave Energy Converters Market Global Industry Analysis and Forecast (2026–2035)

Wave Energy Converters Market size was USD 35.00 Million in 2025 and is projected to reach USD 360.00 Million by 2035, growing at a 25.99% CAGR. Key drivers include improved device survivability, larger demonstration arrays, and dedicated testing infrastructure.

Download Free Sample PDF
Base Year (2025)
$35.0 Million
Forecast (2035)
$360.0 Million
CAGR (2026-2035)
26.0%
Top Region
North America

What Is the Wave Energy Converters Market Size?

The global Wave Energy Converters Market was estimated at USD 35.00 Million in 2025 and USD 45.00 Million in 2026; annual wave-energy system-supplier revenue is forecast to reach USD 360.00 Million by 2035, implying a 25.99% CAGR from 2026 to 2035. North America led with 28.00% in 2025, while point absorbers accounted for 34.00% of converter-technology revenue.

We observed that market development is being shaped less by replacement cycles than by the passage of devices through open-water validation, certification, and repeatable manufacturing. The investment case depends on whether suppliers can turn project-specific prototypes into repeatable systems with credible energy-yield, survivability, and maintenance records.

Wave Energy Converters Market Global Industry Analysis and Forecast (2026–2035) Revenue Forecast

Values in USD Million

2025 $35.0 Million
2025
2026 $45.0 Million
2026
2027 $56.7 Million
2027
2028 $71.4 Million
2028
2029 $90.0 Million
2029
2030 $113.4 Million
2030
2031 $142.9 Million
2031
2032 $180.0 Million
2032
2033 $226.8 Million
2033
2034 $285.7 Million
2034
2035 $360.0 Million
2035

Key Takeaways

By Converter Technology: Point absorber held the largest share, moving from USD 11.90 Million in 2025 to USD 108.00 Million by 2035; Other conversion types are the fastest-growing at 29.98% CAGR from 2026–2035.

By System Configuration: Offshore floating held the largest share, moving from USD 12.25 Million in 2025 to USD 115.20 Million by 2035; Onshore and coastal integrated is the fastest-growing at 28.80% CAGR from 2026–2035.

By Rated Power Band: Demonstrator above 100 kW to 1 MW held the largest share, moving from USD 12.25 Million in 2025 to USD 82.80 Million by 2035; Commercial array above 5 MW is the fastest-growing at 39.50% CAGR from 2026–2035.

By Application: Grid-connected utility and community power held the largest share, moving from USD 14.00 Million in 2025 to USD 172.80 Million by 2035; Grid-connected utility and community power is the fastest-growing at 28.29% CAGR from 2026–2035.

By Buyer Type: Wave project developers held the largest share, moving from USD 11.20 Million in 2025 to USD 100.80 Million by 2035; Utilities and independent power producers is the fastest-growing at 28.81% CAGR from 2026–2035.

By Product Offering: Complete WEC system held the largest share, moving from USD 21.00 Million in 2025 to USD 230.40 Million by 2035; Complete WEC system is the fastest-growing at 26.81% CAGR from 2026–2035.

By Project Stage: Pilot and demonstration systems held the largest share, moving from USD 15.75 Million in 2025 to USD 90.00 Million by 2035; Commercial arrays is the fastest-growing at 39.99% CAGR from 2026–2035.

By Sales Channel: Direct OEM contract held the largest share, moving from USD 20.30 Million in 2025 to USD 201.60 Million by 2035; Project consortium or EPC-led is the fastest-growing at 28.29% CAGR from 2026–2035.

By Region: North America held the largest share, moving from USD 9.80 Million in 2025 to USD 82.80 Million by 2035; Latin America is the fastest-growing at 28.79% CAGR from 2026–2035.

Dominant Region: North America led with USD 9.80 Million in 2025 and is forecast at USD 82.80 Million by 2035 (28.00% share in 2025).

Fastest-Growing Region: Latin America expands at 28.79% CAGR, from USD 5.54 Million in 2026 to USD 54.00 Million in 2035.

Dominant Country: The U.S. is the largest individually assessed country, at USD 6.20 Million in 2025 and USD 54.00 Million in 2035.

Fastest-Growing Country: India has the highest estimated country CAGR at 30.45%, with revenue increasing from USD 2.01 Million in 2026 to USD 22.00 Million by 2035.

The absolute opportunity is USD 315.00 Million between 2026 and 2035, reflecting the potential change from prototype and pilot procurement to pre-commercial array orders if projects clear cost, reliability, and permitting gates.

According to NMSC analysis, shore-integrated systems and small offshore power units commercialize through distinct pathways. Coastal infrastructure reduces marine installation exposure, while remote offshore customers prioritize energy autonomy over bulk electricity prices.

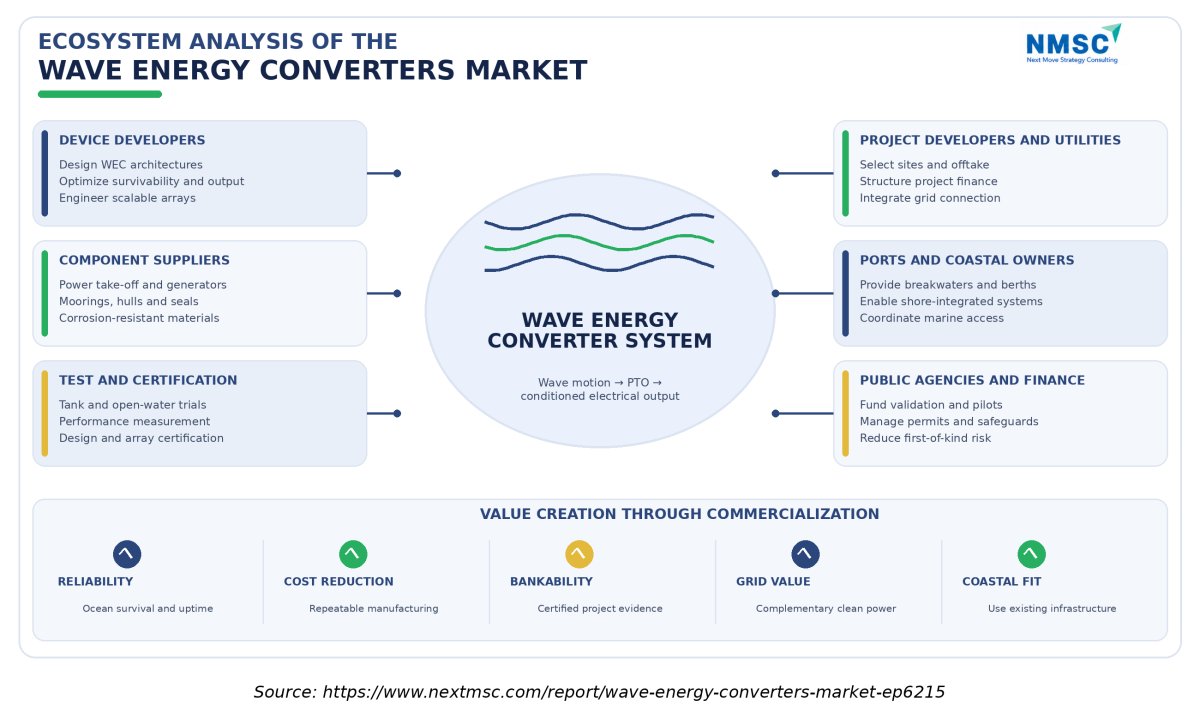
Ecosystem Analysis of the Wave Energy Converters Market Industry

Figure 1. Wave Energy Converters Market ecosystem and commercialization interfaces.
The above infographic links device design to component production, testing, project development, coastal infrastructure, and finance. The strategic constraint is coordination across those interfaces: a technically sound converter can still fail to reach repeat orders if permitting, mooring design, installation logistics, or energy-offtake terms remain unresolved. Participants that share validated operating data and standardize interfaces can reduce duplicated engineering and make later array procurement easier to finance.

What Does the Wave Energy Converters Market Encompass?
The Wave Energy Converters Market covers manufacturer revenue from complete systems and separately sold converter subsystems that transform ocean surface-wave motion into electricity. Included equipment comprises the primary absorber or chamber, power-take-off and generator equipment, control and power electronics, mooring or structural interfaces, and commissioning when supplied under the converter manufacturer’s contract. The measurement tier is the WEC supplier’s sale or system-supply revenue, counted once at the final converter-system sale.
The scope excludes tidal-stream, ocean thermal, salinity-gradient, offshore wind, and standalone monitoring buoys. Standalone project finance, electricity sales, grid upgrades, port civil works, and long-term O&M services are also excluded. The industry is in the growth stage: prototypes and demonstration systems are operating, while multiple suppliers are working toward repeatable arrays and formal performance certification.

Market Drivers & Dynamics

Interactive Dataset
Repeatable array procurement following successful demonstrations driver +4.00 pp Europe, North America, Asia-Pacific 2027–2035
Publicly funded open-water testing and validation driver +3.00 pp North America, Europe 2026–2031
Port and breakwater integration using existing assets driver +2.20 pp Europe, Asia-Pacific, Latin America 2026–2035
Remote offshore power demand and avoided service visits driver +1.60 pp North America, Europe, Asia-Pacific 2026–2035
Improved PTO controls, materials and digital modelling driver +1.00 pp Global 2026–2033
High up-front capital cost and limited repeat order history restraint −2.30 pp Global 2026–2035
Marine permits, environmental monitoring and grid access restraint −1.50 pp North America, Europe 2026–2035
Extreme-wave survivability and costly offshore maintenance restraint −0.80 pp Offshore sites globally 2026–2035
Source: Next Move Strategy Consulting

Growth Drivers

How Does Open-Water Validation Support Demand?

Public validation infrastructure lowers an important barrier: device developers need repeatable sea trials that can confirm performance and survivability before project lenders or utilities accept large arrays. The U.S. Department of Energy’s Oceans of Opportunity funding notice offered up to USD 112.5 million for wave-energy open-water testing and system validation, while PacWave South is designed to host up to 20 WECs and 20 MW across four berths. For buyers, better test access can narrow uncertainty in yield and maintenance assumptions; for manufacturers, it can accelerate design decisions and qualification.

Why Could Existing Coastal Infrastructure Expand the Buyer Base?

Port owners, breakwater operators, and coastal authorities offer an alternative to greenfield offshore power projects when the local wave regime and structural condition are suitable. Systems that attach to existing infrastructure can share access, work areas, and some civil assets, helping project sponsors assess wave power alongside maintenance or coastal-protection spending. The opportunity remains site-specific: structural loading, port safety, environmental effects, and grid connection still require engineering review. Suppliers benefit when they can provide a repeatable system design plus the documentation needed for the infrastructure owner’s approval process.

Growth Inhibitors

What Is the Primary Constraint on Commercial Adoption?

The primary restraint is the combination of high capital intensity and limited operating history across commercial arrays. Government and industry test records establish that devices can operate at sea, but project finance requires evidence about availability, failure rates, retrieval, repair, and energy yield over longer periods. Environmental review and marine licensing can add cost before fabrication begins, and grid access is not guaranteed at every coastal site. Buyers should therefore compare lifecycle cost and availability evidence rather than rely on nominal power rating or modelled annual output alone.

What Are the Growth Opportunities?

Can Port and Breakwater Projects Create a Repeatable Deployment Route?

Coastal structure integration offers a concrete pathway where ports or breakwaters already provide access and a wave-exposed edge. Eco Wave Power’s Portugal program is progressing toward a 1 MW project, while its 2026 purchase order with Bharat Petroleum begins a site-assessment phase for a potential Mumbai pilot. The commercial mechanism is bundled site assessment, device supply, and retrofit engineering. Realization depends on structural suitability, grid access, marine approvals, and a clear allocation of responsibility between the WEC supplier and infrastructure owner.

Can Remote Offshore Loads Support Early Commercial Sales?

Remote offshore systems can address subsea equipment, ocean monitoring, and isolated operations where fuel delivery or vessel visits are expensive. Mocean Energy markets Blue Star 10 as a commercially available offshore power system combining 10 kW of wave generation with solar generation and storage. This buyer group does not require utility-scale electricity economics, but it does require predictable availability and maintainable equipment. Suppliers can build repeat orders by demonstrating total installed cost, endurance, communications compatibility, and reduced intervention requirements for defined offshore use cases.

Will Multi-Megawatt Arrays Unlock Manufacturing Scale?

Pre-commercial arrays can standardize procurement, fabrication, installation, and service across multiple converters. CorPower Ocean’s 10 MW VianaWave project signals the scale of project needed to validate repeatable delivery, while Carnegie Clean Energy’s ACHIEVE program is testing CETO modules toward future array decisions. Suppliers benefit when designs use modular parts and established marine supply chains. Large arrays will depend on reliable operating data, insurance terms, grid and offtake arrangements, and evidence that maintenance costs do not rise disproportionately with device count.

Segmentation Analysis

2025 (USD Million)
2035 (USD Million)
Point absorber 2025: $11.9 Million | 2035: $108.0 Million
Point absorb
Oscillating water column 2025: $6.3 Million | 2035: $57.6 Million
Oscillating
Attenuator 2025: $4.2 Million | 2035: $39.6 Million
Attenuator
Oscillating wave surge converter 2025: $4.2 Million | 2035: $43.2 Million
Oscillating
Submerged pressure differential 2025: $3.5 Million | 2035: $46.8 Million
Submerged pr
Overtopping 2025: $2.1 Million | 2035: $25.2 Million
Overtopping
Other conversion types 2025: $2.8 Million | 2035: $39.6 Million
Other conver
Point absorber $11.9 Million $108.0 Million 24.43%
Oscillating water column $6.3 Million $57.6 Million 24.51%
Attenuator $4.2 Million $39.6 Million 24.88%
Oscillating wave surge converter $4.2 Million $43.2 Million 25.99%
Submerged pressure differential $3.5 Million $46.8 Million 29.28%
Overtopping $2.1 Million $25.2 Million 27.91%
Other conversion types $2.8 Million $39.6 Million 29.98%

Which Converter Technology Leads the Wave Energy Converters Market?

Point absorbers remain the largest technology category because the design family can be configured as surface floats or submerged buoys and has been pursued by multiple developers, including CorPower Ocean and Carnegie Clean Energy. Submerged pressure-differential concepts gain share in this estimate as coastal structures and protected submerged devices attract development attention. Technology choice remains site-dependent; suppliers must match device response, survivability, mooring conditions, and power-take-off design to local wave resources.

2025 (USD Million)
2035 (USD Million)
Offshore flo
Offshore sub
Nearshore fi
Onshore and
Segment Item 2025 (USD Million) 2035 (USD Million) CAGR
Offshore floating $10.0 USD Million $40.0 USD Million 25.0%
Offshore submerged $17.1 USD Million $51.1 USD Million 11.0%
Nearshore fixed $24.2 USD Million $62.2 USD Million 9.0%
Onshore and coastal integrated $31.3 USD Million $73.3 USD Million 27.0%

Segment-wise data is locked

Unlock complete segment-wise numbers for By System Configuration.

Unlock Full Data
2025 (USD Million)
2035 (USD Million)
Prototype an
Demonstrator
Pre-commerci
Commercial a
Segment Item 2025 (USD Million) 2035 (USD Million) CAGR
Prototype and pilot up to 100 kW $10.0 USD Million $40.0 USD Million 11.0%
Demonstrator above 100 kW to 1 MW $17.1 USD Million $51.1 USD Million 17.0%
Pre-commercial array above 1 MW to 5 MW $24.2 USD Million $62.2 USD Million 27.0%
Commercial array above 5 MW $31.3 USD Million $73.3 USD Million 21.0%

Segment-wise data is locked

Unlock complete segment-wise numbers for By Rated Power Band.

Unlock Full Data

Which Power Rating Is Expected to Scale Fastest?

Commercial arrays above 5 MW represent the fastest-growing capacity band in the model at 39.50% CAGR from 2026 to 2035, although the forecast begins from a small base. Pre-commercial arrays above 1 MW to 5 MW provide the transition stage by generating performance, availability, and maintenance evidence across multiple devices. Further commercial expansion depends on surviving severe sea states, predictable retrieval and repair, and financing evidence from first multi-megawatt projects. Prototype and pilot systems remain necessary for engineering iteration as suppliers standardize products and supply chains.

2025 (USD Million)
2035 (USD Million)
Grid-connect
Island and c
Remote offsh
Port and coa
Segment Item 2025 (USD Million) 2035 (USD Million) CAGR
Grid-connected utility and community power $10.0 USD Million $40.0 USD Million 18.0%
Island and coastal microgrids $17.1 USD Million $51.1 USD Million 16.0%
Remote offshore power $24.2 USD Million $62.2 USD Million 22.0%
Port and coastal structure integration $31.3 USD Million $73.3 USD Million 12.0%

Segment-wise data is locked

Unlock complete segment-wise numbers for By Application.

Unlock Full Data

Which Application Has the Largest Long-Term Opportunity?

Grid-connected utility and community power is the largest application and increases its revenue share as projects move toward arrays. Remote offshore power remains a distinct, smaller market where the value proposition includes reduced vessel visits and dependable power for subsea systems. Port and coastal structure integration can benefit from existing civil infrastructure, but project feasibility depends on site wave conditions, breakwater geometry, asset life, and marine permitting. The application mix therefore reflects differing economics rather than a universal best deployment setting.

2025 (USD Million)
2035 (USD Million)
Utilities an
Wave project
Ports and co
Offshore ene
Public resea
Segment Item 2025 (USD Million) 2035 (USD Million) CAGR
Utilities and independent power producers $10.0 USD Million $40.0 USD Million 22.0%
Wave project developers $17.1 USD Million $51.1 USD Million 12.0%
Ports and coastal infrastructure owners $24.2 USD Million $62.2 USD Million 14.0%
Offshore energy operators $31.3 USD Million $73.3 USD Million 12.0%
Public research and test institutions $38.4 USD Million $84.4 USD Million 15.0%

Segment-wise data is locked

Unlock complete segment-wise numbers for By Buyer Type.

Unlock Full Data
2025 (USD Million)
2035 (USD Million)
Complete WEC
Power take-o
Controls and
Mooring and
Segment Item 2025 (USD Million) 2035 (USD Million) CAGR
Complete WEC system $10.0 USD Million $40.0 USD Million 8.0%
Power take-off and generator modules $17.1 USD Million $51.1 USD Million 18.0%
Controls and power electronics $24.2 USD Million $62.2 USD Million 24.0%
Mooring and structural modules $31.3 USD Million $73.3 USD Million 26.0%

Segment-wise data is locked

Unlock complete segment-wise numbers for By Product Offering.

Unlock Full Data
2025 (USD Million)
2035 (USD Million)
Prototype an
Pilot and de
Pre-commerci
Commercial a
Segment Item 2025 (USD Million) 2035 (USD Million) CAGR
Prototype and research systems $10.0 USD Million $40.0 USD Million 12.0%
Pilot and demonstration systems $17.1 USD Million $51.1 USD Million 14.0%
Pre-commercial arrays $24.2 USD Million $62.2 USD Million 12.0%
Commercial arrays $31.3 USD Million $73.3 USD Million 22.0%

Segment-wise data is locked

Unlock complete segment-wise numbers for By Project Stage.

Unlock Full Data
2025 (USD Million)
2035 (USD Million)
Direct OEM c
Project cons
Publicly fun
Segment Item 2025 (USD Million) 2035 (USD Million) CAGR
Direct OEM contract $10.0 USD Million $40.0 USD Million 24.0%
Project consortium or EPC-led $17.1 USD Million $51.1 USD Million 10.0%
Publicly funded test procurement $24.2 USD Million $62.2 USD Million 8.0%

Segment-wise data is locked

Unlock complete segment-wise numbers for By Sales Channel.

Unlock Full Data
2025 (USD Million)
2035 (USD Million)
North Americ
Canada
Mexico
Europe: UK
Germany
Segment Item 2025 (USD Million) 2035 (USD Million) CAGR
North America: U.S. $10.0 USD Million $40.0 USD Million 10.0%
Canada $17.1 USD Million $51.1 USD Million 8.0%
Mexico $24.2 USD Million $62.2 USD Million 18.0%
Europe: UK $31.3 USD Million $73.3 USD Million 8.0%
Germany $38.4 USD Million $84.4 USD Million 15.0%

Segment-wise data is locked

Unlock complete segment-wise numbers for By Region.

Unlock Full Data

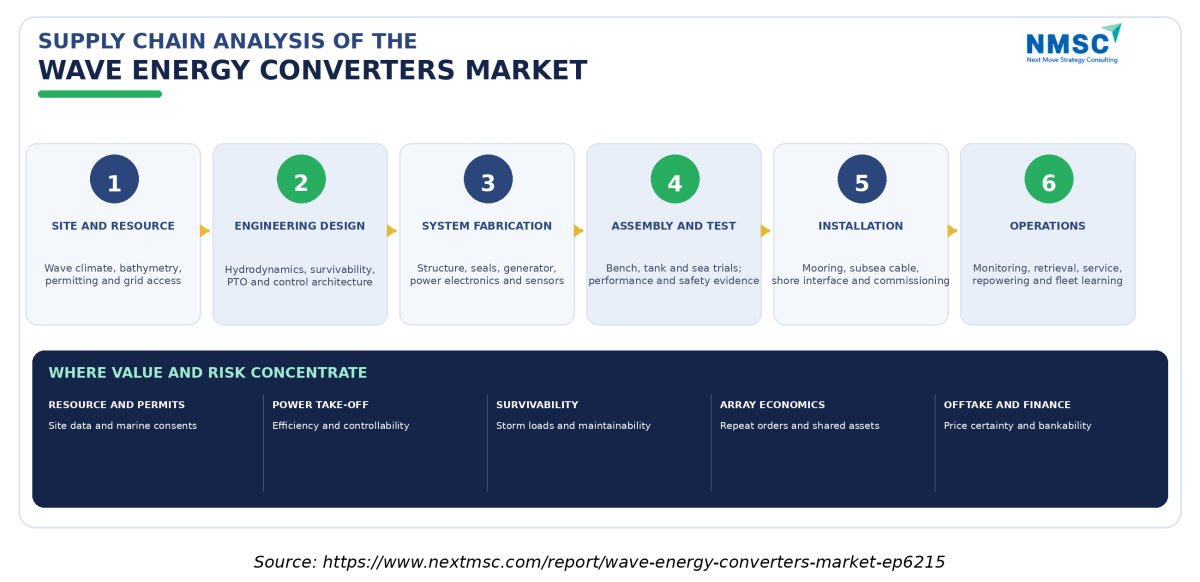
Supply Chain Analysis of the Wave Energy Converters Market Industry

Supply Chain Analysis of the Wave Energy Converters Market Industry
Figure 2. WEC equipment supply chain from resource assessment through operation.
The above infographic emphasizes that WEC supplier revenue is created through tightly coupled engineering and delivery stages, not by hardware alone. Project owners need the converter, power-take-off, controls, anchoring, installation plan, and performance evidence to work as one system. Suppliers that design for transport, retrieval, inspection, and repeatable assembly can lower downstream uncertainty. Procurement teams should validate interface responsibilities early so that a low-priced component does not create higher integration or maintenance costs later.

Growth Opportunities

The clearest opportunities lie where WEC designs can reuse existing assets, supply valuable niche loads, or move from validated single units into repeatable arrays.

Can Port and Breakwater Projects Create a Repeatable Deployment Route?

Coastal structure integration offers a concrete pathway where ports or breakwaters already provide access and a wave-exposed edge. Eco Wave Power’s Portugal program is progressing toward a 1 MW project, while its 2026 purchase order with Bharat Petroleum begins a site-assessment phase for a potential Mumbai pilot. The commercial mechanism is bundled site assessment, device supply, and retrofit engineering. Realization depends on structural suitability, grid access, marine approvals, and a clear allocation of responsibility between the WEC supplier and infrastructure owner.

Can Remote Offshore Loads Support Early Commercial Sales?

Remote offshore systems can address subsea equipment, ocean monitoring, and isolated operations where fuel delivery or vessel visits are expensive. Mocean Energy markets Blue Star 10 as a commercially available offshore power system combining 10 kW of wave generation with solar generation and storage. This buyer group does not require utility-scale electricity economics, but it does require predictable availability and maintainable equipment. Suppliers can build repeat orders by demonstrating total installed cost, endurance, communications compatibility, and reduced intervention requirements for defined offshore use cases.

Will Multi-Megawatt Arrays Unlock Manufacturing Scale?

Pre-commercial arrays can standardize procurement, fabrication, installation, and service across multiple converters. CorPower Ocean’s 10 MW VianaWave project signals the scale of project needed to validate repeatable delivery, while Carnegie Clean Energy’s ACHIEVE program is testing CETO modules toward future array decisions. Suppliers benefit when designs use modular parts and established marine supply chains. Large arrays will depend on reliable operating data, insurance terms, grid and offtake arrangements, and evidence that maintenance costs do not rise disproportionately with device count.

Regional Outlook

2025 (USD Million)
2035 (USD Million)
North Americ
Europe
Asia-Pacific
Middle East
Latin Americ
Region 2025 (USD Million) 2035 (USD Million) CAGR (%)
North America $10.0 USD Million $40.0 USD Million 9.0%
Europe $17.1 USD Million $51.1 USD Million 27.0%
Asia-Pacific $24.2 USD Million $62.2 USD Million 25.0%
Middle East & Africa $31.3 USD Million $73.3 USD Million 23.0%
Latin America $38.4 USD Million $84.4 USD Million 12.0%

Regional data is locked

Unlock complete regional numbers for this market.

Unlock Full Data

Competitive Landscape

Our assessment indicates that competitive differentiation comes from the ability to move through validation and repeatable delivery, rather than a public company market-share ranking. Market-specific revenue is not disclosed on a comparable basis by most developers, so the analysis emphasizes documented technical programs, deployment status, and product scope.

Dimension Description
Market Structure Fragmented, early-stage supplier field; revenue and operating-capacity disclosures are not comparable across developers.
Innovation Focus Survivability, power-take-off efficiency, controls, modular fabrication, coastal-structure integration, and array certification.
M&A Activity No sufficiently verified 2025–2026 acquisition changing the WEC supplier structure was identified in the primary-source research. Project collaborations and public R&D programs are more visible than consolidation.

How Do Companies Compete for Wave Energy Converter Projects?

Suppliers compete on energy capture, storm survival, maintainability, local installation complexity, and the credibility of their test records. Product ratings alone are insufficient because the same device may perform differently under different wave climates. CorPower’s C4 program, Carnegie’s CETO development, and Wave Swell Energy’s UniWave work illustrate distinct designs advancing through testing. Project owners should compare total installed cost, warranties, retrieval plans, output measurement, and supplier capacity to support a project over its lifecycle.

Which Competitive Archetypes Are Most Relevant?

Three archetypes are visible: full-system WEC developers selling proprietary designs; subsystem and power-take-off specialists that supply several architectures; and project integrators that package devices with marine works and electrical interfaces. OEM-native designs can simplify accountability but may limit flexibility; modular suppliers can create choice but increase interface-management risk. The strongest partner structure depends on whether a buyer values single-point responsibility, open component selection, or a local engineering partner able to support permitting and maintenance.

How Are Innovation and Differentiation Strategies Evolving?

Design teams are pursuing fewer moving parts underwater, modular system builds, improved power take-off, and controls that adapt to wave conditions. Coastal-integrated devices seek to use existing breakwaters, while submerged concepts seek lower visual impact and protection from some extreme surface conditions. Digital-twin tools can shorten design iteration but require validated sensor data. Buyers should evaluate measured availability and energy yield from sea trials alongside simulation results, particularly before purchasing arrays whose maintenance profile may differ from a single demonstrator.

What Is the Role of Partnerships and Consolidation?

Project partnerships currently provide visible routes to testing, financing, and deployment. Examples include publicly funded test infrastructure at PacWave, the EuropeWave procurement route used by Carnegie’s CETO program, and coastal-infrastructure collaborations for WEC installation. These arrangements distribute technical risk among developers, test-site operators, engineering firms, and hosts. No major 2025–2026 acquisition changing the market’s structure was verified from the primary-source set, so it would be premature to infer a broad consolidation cycle from partnership activity alone.

Key Market Players

Based on research conducted by NMSC, the ranked list below prioritizes documented product programs, project scale, open-water testing, and commercialization evidence. Market-specific revenue is not publicly comparable across the eligible supplier set, so the order is a qualitative scale-and-readiness assessment rather than a claimed revenue-share ranking.

CorPower Ocean AB Eco Wave Power Global AB (publ) Carnegie Clean Energy Limited Wave Swell Energy Limited OceanEnergy Limited Ocean Harvesting Technologies AB Mocean Energy Limited SEABASED AB AWS Ocean Energy Limited CalWave Power Technologies, Inc. Oscilla Power, Inc. Wavepiston A/S Dutch Wave Power B.V. SINN Power GmbH Bombora Wave Power Pty Ltd

Latest Developments

We found that current market developments are concentrated in site assessment, testing infrastructure, technical validation, and grant-supported pre-commercial projects. Only events with a direct link to WEC technology or deployment are included.

Date Event
29 Oct 2026 Eco Wave Power reported that Bharat Petroleum issued a purchase order for a site-assessment phase for a planned wave-energy pilot at Mumbai marine oil terminals. The work will assess site conditions and does not yet represent a commissioned plant.
29 Oct 2026 Carnegie Clean Energy reported fabrication completion for the CETO buoyant actuator; staged ocean deployment at BiMEP is planned to begin in November 2026, with grid connection targeted for spring 2027.
27 Aug 2026; published 1 Sep 2026 PacWave South opened as a pre-permitted, grid-connected U.S. wave-energy test site. The facility is designed for up to 20 WECs and 20 MW across four test berths, reducing access barriers for extended validation.
Event in 2026; published 24 Jul 2026 Wave Swell Energy reported completion of testing at Oregon State University for integrating its WEC with coastal protection structures. The work examines whether one structure can support both energy generation and coastal mitigation.
23 Jul 2025 CorPower Ocean secured a EUR 40 million EU Innovation Fund grant for the planned 10 MW VianaWave pre-commercial farm in Portugal, comprising 30 WECs, with operations targeted for 2028–2029.

Expert Insights

Nichole Fitzgerald

Nichole Fitzgerald

Director, Hydropower and Hydrokinetic Office | U.S. Department of Energy

"“The PacWave South facility will help reduce testing barriers for wave energy developers and spur innovation to America’s benefit for years to come.”"

Analyst Interpretation

We observed that test infrastructure creates value by lowering the time and cost required to collect evidence that lenders, insurers, utilities, and project hosts can evaluate. Pre-permitted grid connection is especially relevant because a device can be assessed in operating conditions without every developer independently building equivalent infrastructure. It does not remove device-level performance or environmental risk. Decision makers should monitor test-site utilization, measured availability, independent power-performance reports, and the share of tested designs that progress to repeat orders.

Investment Opportunities

Where Is Capital Concentrating Across the WEC Value Chain?

Capital signals are most visible in grant-supported demonstration projects, engineering validation, manufacturing readiness, and test facilities rather than in a broad installed asset base. CorPower Ocean’s EUR 40 million grant for a planned 10 MW farm and the U.S. Department of Energy’s USD 112.5 million open-water testing opportunity are verified examples of project and infrastructure support. NMSC interprets these as de-risking mechanisms, not proof of attractive returns; investors should test milestone discipline, co-funding, contracted order value, and follow-on financing needs.

How Can Infrastructure Investment Improve Capacity and Utilization?

Investment in grid-connected test berths, port access, retrieval equipment, and shared marine engineering can remove duplicated costs across developers. PacWave South illustrates the model of shared testing infrastructure, while coastal-structure integration can use a port or breakwater as part of the site design. NMSC’s interpretation is that infrastructure providers may earn value through specialist access and services even before large array manufacturing scales. The main conditions are test-site utilization, predictable scheduling, safe marine operations, and funding for ongoing maintenance.

Which ESG Factors Should Investors Evaluate?

ESG assessment should cover the full marine installation footprint, including seabed and coastal effects, materials, moorings, navigation, underwater noise where relevant, and end-of-life retrieval. Reusing coastal structures may reduce some construction requirements but does not remove site-level environmental obligations. Investors should request baseline surveys, monitoring plans, materials and corrosion strategies, retrieval provisions, and transparent incident reporting. NMSC’s interpretation is that measurable environmental performance and community acceptance can protect project schedules, while poor engagement can delay permits or damage the reputation of a technology class.

Key Benefits for Stakeholders

How Do Utilities and Project Developers Benefit?

Utilities and project developers can use the forecast to compare the timing of pilot and array procurement, but the central decision remains site-level energy yield and project bankability. The model allocates USD 360.00 Million of global WEC supplier revenue to 2035, with pre-commercial arrays above 1 MW to 5 MW growing faster than prototype sales. Stakeholders should stage commitments around measured performance, independent verification, grid access, and an offtake agreement that reflects the value and variability of output.

How Do Equipment Manufacturers and Engineering Suppliers Benefit?

Manufacturers can use the segmentation to prioritize power take-off efficiency, modular assembly, controls, seals, moorings, and corrosion-resistant structures. Complete WEC systems hold the largest estimated product-offering share, while pilot-to-array progression creates demand for repeatable parts and documented quality procedures. Component suppliers should avoid relying on theoretical resource estimates as a demand forecast. They should seek design-in opportunities, supplier qualification, standardized interface documentation, and contracts that specify testing, warranty, delivery, and retrieval responsibilities.

How Do Investors and Public Funding Bodies Benefit?

Investors and public agencies can distinguish technical progress from commercial orders by tracking the number of devices built, tested, connected, and subsequently repeated. The 25.99% modeled CAGR reflects an early-stage expansion scenario, not a public consensus forecast. Funding bodies can support shared testing and independent measurement, while investors can require milestone-based capital release, co-funding, and evidence that costs decline with repetition. Both groups should scrutinize project delays and the gap between pipeline capacity and commissioned revenue.

Key Market Segments Evaluated

By Converter Technology

  • Point absorber
  • Oscillating water column
  • Attenuator
  • Oscillating wave surge converter
  • Submerged pressure differential
  • Overtopping
  • Other conversion types

By System Configuration

  • Offshore floating
  • Offshore submerged
  • Nearshore fixed
  • Onshore and coastal integrated

By Rated Power Band

  • Prototype and pilot up to 100 kW
  • Demonstrator above 100 kW to 1 MW
  • Pre-commercial array above 1 MW to 5 MW
  • Commercial array above 5 MW

By Application

  • Grid-connected utility and community power
  • Island and coastal microgrids
  • Remote offshore power
  • Port and coastal structure integration

By Buyer Type

  • Utilities and independent power producers
  • Wave project developers
  • Ports and coastal infrastructure owners
  • Offshore energy operators
  • Public research and test institutions

By Product Offering

  • Complete WEC system
  • Power take-off and generator modules
  • Controls and power electronics
  • Mooring and structural modules

By Project Stage

  • Prototype and research systems
  • Pilot and demonstration systems
  • Pre-commercial arrays
  • Commercial arrays

By Sales Channel

  • Direct OEM contract
  • Project consortium or EPC-led
  • Publicly funded test procurement

By Region

  • North America 
    • U.S.
    • Canada
    • Mexico
  • Europe 
    • UK
    • Germany
    • France
    • Italy
    • Spain
    • Sweden
    • Denmark
    • Finland
    • Netherlands
    • Rest of Europe
  • Asia-Pacific 
    • China
    • India
    • Japan
    • South Korea
    • Taiwan
    • Indonesia
    • Vietnam
    • Australia
    • Philippines
    • Malaysia
    • Rest of APAC
  • Middle East & Africa 
    • Saudi Arabia
    • UAE
    • Egypt
    • Israel
    • Turkey
    • Nigeria
    • South Africa
    • Rest of MEA
  • Latin America 
    • Brazil
    • Argentina
    • Chile
    • Colombia
    • Rest of LATAM

Conclusion & Recommendations

The long-term outlook is for a transition from project-specific prototypes to repeatable pre-commercial and commercial arrays, with supplier revenue rising from USD 45.00 Million in 2026 to USD 360.00 Million by 2035 in NMSC’s modeled scenario. The 25.99% CAGR reflects a small starting base and should be assessed against project execution rather than resource potential. The strongest evidence of progress will be repeat unit orders, verified availability, lower installed cost, and financeable operation-and-maintenance plans.

What Strategic Positioning Recommendations Does NMSC Offer?

Suppliers should focus on one or two defensible deployment configurations, standardize power-take-off and control interfaces, and document survivability and retrieval procedures. Project developers should compare complete lifecycle cost rather than rated power alone. Buyers can use IEC power-performance and resource-assessment methods, together with appropriate third-party certification, to improve comparability. The estimated complete-system offering share rises from 60.00% in 2025 to 64.00% by 2035, supporting investment in integrated delivery capability without assuming every buyer needs the same device architecture.

How Attractive Is the Wave Energy Converters Market for Investment?

The modeled market increases by USD 315.00 Million between 2026 and 2035, but this opportunity is accompanied by technology, construction, marine-access, and financing risk. Capital is most defensible when attached to specific gates such as prototype testing, certification, pilot performance, repeat orders, and array financing. Shared test infrastructure and established coastal assets can reduce certain costs. Investors should not value a project pipeline as realized revenue until contracts, deployment dates, and offtake terms are supported by evidence.

What Are the Key Market Shifts and Risks in the Wave Energy Converters Market?

The principal shift is from isolated demonstrations toward arrays and niche commercial applications such as remote offshore loads and coastal infrastructure. The primary risks are high capital intensity, severe sea states, long marine permitting cycles, and the small number of comparable long-term operating records. Public test facilities and standardized performance methods help lower evidence costs but cannot guarantee bankability. Stakeholders should monitor unplanned maintenance, survival in extreme events, energy-yield uncertainty, and the conversion rate from funded pilots to commissioned arrays.

What Are the Primary Growth Pathways Through 2035?

The primary pathways are pre-commercial arrays, shore-integrated devices at suitable ports, and compact WEC systems for remote offshore use. In the model, arrays above 1 MW to 5 MW gain share as the first larger projects mature, while grid-connected utility and community power remains the largest application in 2035. Expansion depends on suppliers standardizing manufacture and deployment while project sponsors secure permits, grid access, and appropriate offtake. A disciplined, evidence-led scale-up is more credible than assuming immediate parity with established renewable technologies.

FAQs

Sources & References

1.

European Commission Joint Research Centre

setis.ec.europa.eu
2.

European Commission Blue Economy Observatory

blue-economy-observatory.ec.europa.eu
3.

U.S. Department of Energy, Oceans of Opportunity

energy.gov
4.

U.S. Department of Energy, PacWave South

energy.gov
5.

U.S. Department of Energy, PacWave

energy.gov
6.

International Electrotechnical Commission

webstore.iec.ch
7.

International Electrotechnical Commission

webstore.iec.ch
8.

DNV

dnv.com
9.

Federal Energy Regulatory Commission

ferc.gov
10.

CorPower Ocean

corpowerocean.com
11.

CorPower Ocean

corpowerocean.com
12.

Eco Wave Power

ecowavepower.com
13.

Eco Wave Power

ecowavepower.com
14.

Eco Wave Power

ecowavepower.com
15.

Carnegie Clean Energy

investors.carnegiece.com
16.

Carnegie Clean Energy

carnegiece.com/ceto-technology
17.

Wave Swell Energy

waveswell.com/technology
18.

Wave Swell Energy

waveswell.com/news
19.

OceanEnergy Limited

oceanenergy.ie/oe-buoy
20.

Ocean Harvesting Technologies AB

oceanharvesting.com/our-technology
21.

Ocean Harvesting Technologies AB

oceanharvesting.com
22.

Bombora Wave Power Pty Ltd

bomborawave.com/mwave
23.

Mocean Energy

mocean.energy/technology
24.

AWS Ocean Energy

awsocean.com
25.
26.

CalWave

calwave.energy
27.

Wavepiston

wavepiston.com
28.

Dutch Wave Power

dutchwavepower.com
30.

SINN Power GmbH

sinnpower.com/en/r-d
31.
32.

National Laboratory of the Rockies / U.S. DOE program context

energy.gov

About the Author

Debashree Dey

Debashree Dey

Debashree Dey is Assistant Manager at Next Move Strategy Consulting, where she supports cross-vertical market content and communications across diverse industries for 6 years. Her professional background includes senior content writing, communications, and published manuscript authorship, with experience developing audience-focused business narratives and maintaining clear, consistent messaging. Her role supports research-led content development and editorial quality across NextMSC publications.

About the Reviewer

Supradip Baul

Supradip Baul

Supradip Baul is an accomplished business consultant and strategist with over a decade of rich experience in market intelligence, strategy, technology, and business transformation. His work has included rigorous qualitative and quantitative analysis across multiple industries, helping clients shape investment decisions and long-term roadmaps. Earlier in his career, he was associated with Gartner, where he contributed to industry-leading reports and market share analyses. He has worked with leading global companies and holds an MBA with a dual specialization in Marketing and Finance.

Download Free Sample

Kevin Coker

KEVIN COKER

Founder, CEO and Board Diector

Proxima Clinical Research

I have been using Next MSC reports for product positioning in a new geography for a long time. They have by far the best reports I have found and the price is reasonable too!

Amos Chang

AMOS CHANG

Strategy Consultant

Kardex Group

I have bought the intralogistics market reports from NMSC two times so far. Joseph and his team are always very helpful and flexible in responding to any customization requirements on the report. Their expertise in market reports really helps us steer the day-to-day business. I will definitely recommend and come back myself whenever there is a need.

Diana Trejo

DIANA TREJO

Assistant Manager

Sumitomo Corporation de Mexico, S.A. de C.V.

Recently, we purchased a report on the Mexico Data Center Market from Next Move Strategy Consulting. The service has been excellent, with support that is always timely and thoroughly professional. The information provided is interesting, highly useful, and delivered with clarity. I would highly recommend NextMSC for anyone seeking insightful and dependable analysis.

Nishant Awate

NISHANT AWATE

Business Development Global Sales

Zehnder Group Deutschland GmbH

Our experience working with Next Move Strategy Consulting was positive. The team was responsive, professional, and open to incorporating our specific requirements throughout the project. The India AHU market study was comprehensive and well structured, covering market value and volume forecasts, product and application segments, and key industry trends. The inclusion of both AHU and residential MVHR market insights made the study particularly relevant for our strategic market assessment. Overall, the report provides a solid foundation for evaluating market potential, identifying priority segments, and supporting business-development decisions in India.

Semih Kavaklioglu

SEMIH KAVAKLIOGLU

Co-Founder & Sales Manager

Decortie

I work a lot in the marketing industry and I know that research is an essential part of any campaign. I have used Market research reports for my own products and I found them to be very informative and well-researched. The team here produces insightful reports for a good price

Custom Market Research Services

We will customize the research for you if the listed report does not fully match your requirements.

Get 30% Free Customization

Select License

This website uses cookies to ensure you get the best experience on our website. Learn more

✖