Clean and Renewable Energy Market Global Industry Analysis and Forecast (2026-2035)

Clean and Renewable Energy Market size was USD 700.12 Billion in 2025, projected to reach USD 1,181.65 Billion by 2035, growing at a CAGR of 5.32% from 2026 to 2035. Key drivers include declining solar PV and wind generation costs, expanding corporate renewable power purchase agreements, and rising investment in renewable energy projects, with Asia-Pacific leading the market .

Download Free Sample PDF
Base Year (2025)
$700.12 Billion
Forecast (2035)
$1,181.65 Billion
CAGR (2026-2035)
5.3%
Top Country
Asia-Pacific

What Is the Clean and Renewable Energy Market Size?

The Clean and Renewable Energy Market size was valued at USD 700.12 Billion in 2025 and is estimated at USD 747.67 Billion in 2026, forecast to reach USD 1,181.65 Billion by 2035, expanding at a 5.32% CAGR between 2026 and 2035. Asia-Pacific leads with approximately a 44% share, while Solar Energy dominates all energy sources with approximately a 30% share.

We observed that growth is broad-based across all clean energy technologies, with distributed solar and corporate power purchase agreements driving the sharpest structural shifts as project developers pivot from utility-dominated markets toward behind-the-meter and self-consumption models through 2035.

Clean and Renewable Energy Market Global Industry Analysis and Forecast (2026-2035) Revenue Forecast

Values in USD Billion

2025 $700.12 Billion
2025
2026 $747.67 Billion
2026
2027 $787.45 Billion
2027
2028 $829.34 Billion
2028
2029 $873.46 Billion
2029
2030 $919.93 Billion
2030
2031 $968.87 Billion
2031
2032 $1,020.41 Billion
2032
2033 $1,074.70 Billion
2033
2034 $1,131.87 Billion
2034
2035 $1,181.65 Billion
2035

Key Takeaways

By Energy Source: Solar Energy held the largest share of approximately 30% (USD 210.04 Billion) in 2025; Solar Energy and Geothermal Energy are also the fastest-growing sub-segments, both at 7.37% CAGR from 2026–2035.

By Deployment Model: Utility Scale held the largest share of approximately 72% (USD 504.09 Billion) in 2025; Distributed is the fastest-growing sub-segment at 6.03% CAGR from 2026–2035.

By Connection Model: Grid-Connected Front of Meter held the largest share of approximately 61% (USD 427.07 Billion) in 2025; Off-Grid is the fastest-growing sub-segment at 10.07% CAGR from 2026–2035.

By Ownership Model: Utility Owned held the largest share of approximately 36% (USD 252.04 Billion) in 2025; Corporate End User Owned is the fastest-growing sub-segment at 9.61% CAGR from 2026–2035.

By Offtaker Type: Utility and Wholesale held the largest share of approximately 48% (USD 336.06 Billion) in 2025; Commercial and Industrial is the fastest-growing sub-segment at 8.07% CAGR from 2026–2035.

By Offtake Arrangement: Power Purchase Agreement held the largest share of approximately 38% (USD 266.05 Billion) in 2025; Self Consumption is the fastest-growing sub-segment at 10.07% CAGR from 2026–2035.

Dominant Region: Asia-Pacific dominated with approximately 44% revenue share (USD 308.05 Billion) in 2025.

Fastest-Growing Region: Asia-Pacific is also expected to register the highest CAGR of 6.24% during 2026–2035.

Dominant Country: China led the market with approximately USD 135.46 Billion in 2025.

Fastest-Growing Country: India is expected to register the highest CAGR of approximately 9.1% during 2026–2035.

Market Opportunity: The Clean and Renewable Energy market is expected to create an absolute dollar opportunity of USD 433.98 Billion between 2026 and 2035, presenting significant investment potential across solar photovoltaic expansion, distributed energy models, and corporate clean power procurement.

According to NMSC analysis, the growing divergence between utility-scale and distributed deployment trajectories is reshaping procurement strategy, as corporate and industrial buyers increasingly secure dedicated clean power capacity through ownership and long-term self-consumption arrangements rather than relying solely on utility tariffs or merchant markets.

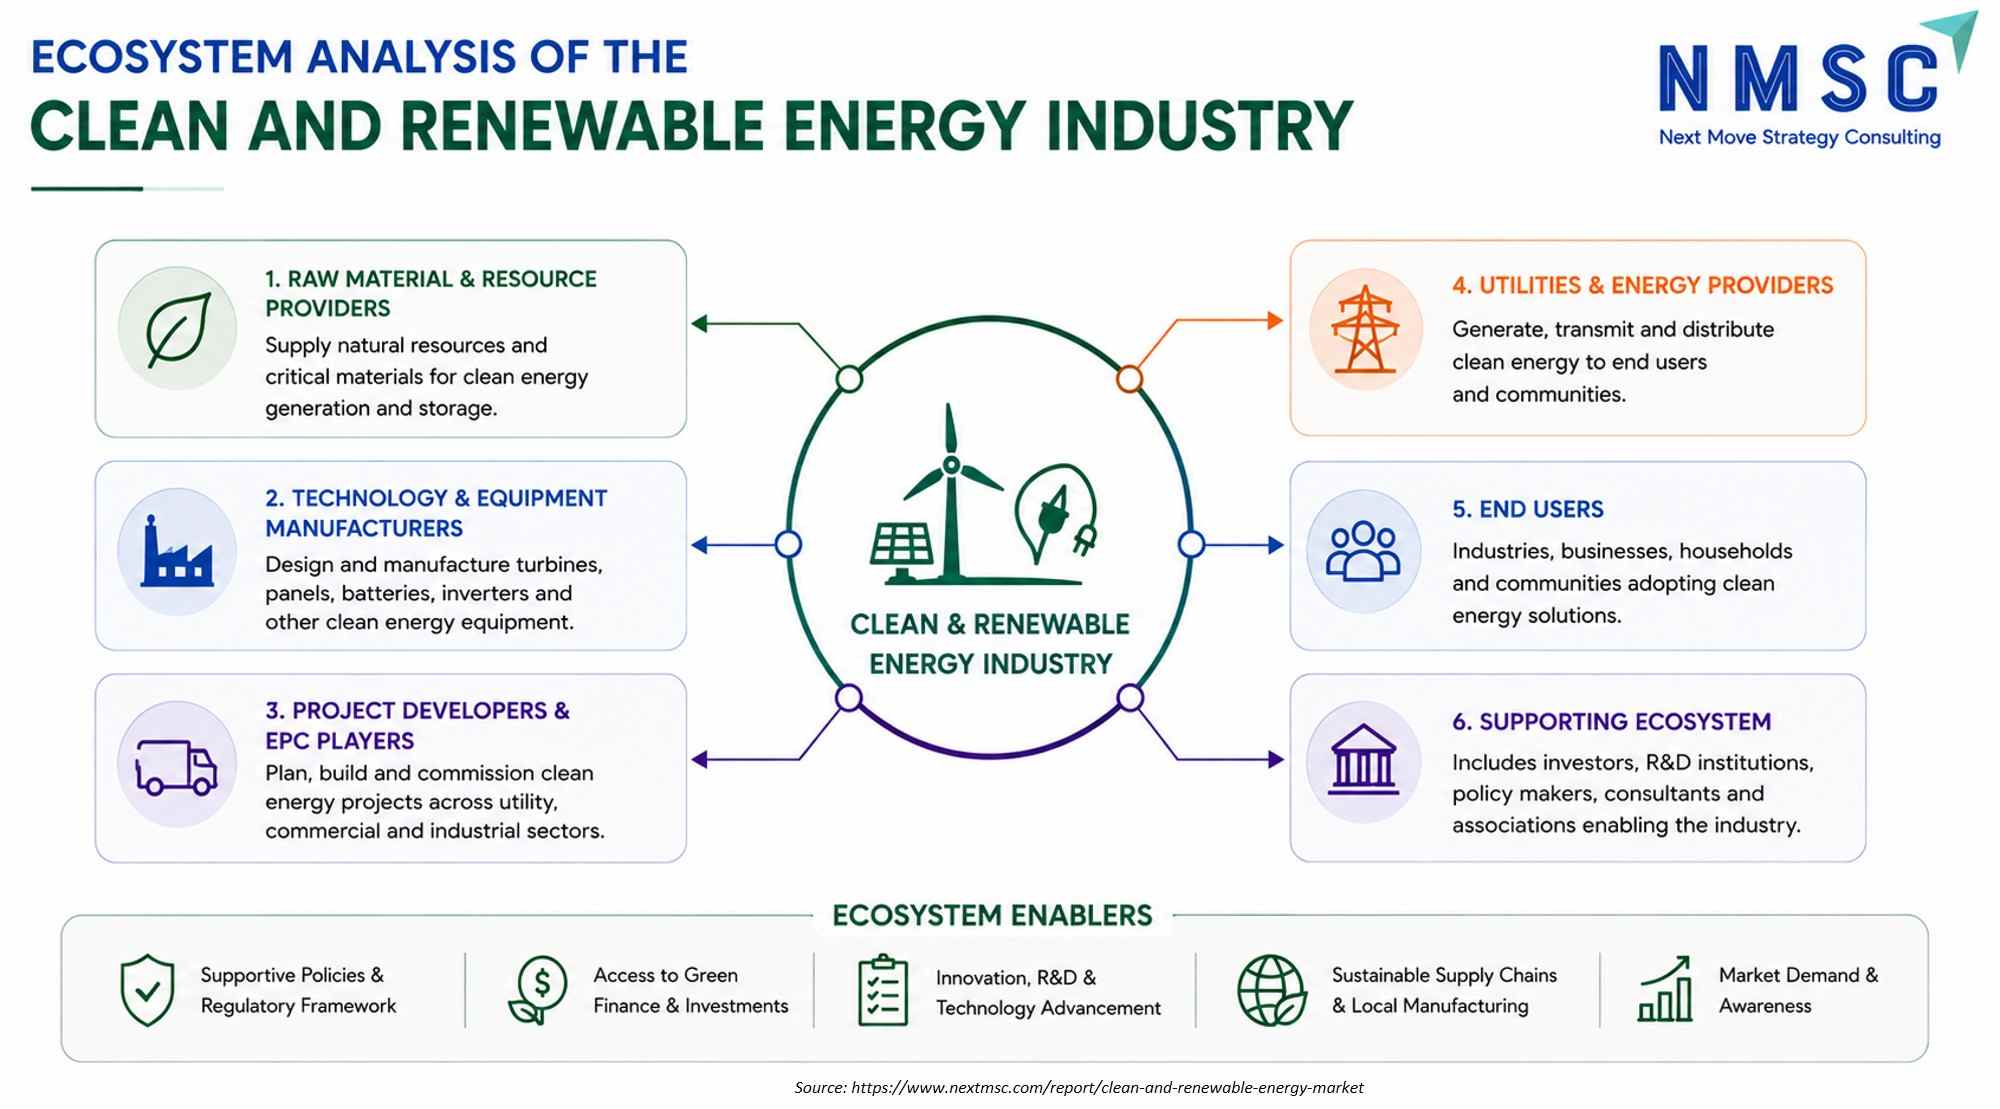
Ecosystem Analysis of the Clean and Renewable Energy Industry

The above infographic provides a detailed ecosystem analysis of the clean and renewable energy industry, mapping out six key segments from raw material providers to end users. It illustrates how technology manufacturers, project developers, and utilities interact within a connected network to generate and distribute sustainable power to industries, businesses, and communities. The analysis further highlights crucial ecosystem enablers, such as supportive policies, access to green finance, and technological innovation, that drive the industry forward. Ultimately, it demonstrates how this interconnected chain, supported by a robust framework, accelerates the global transition toward sustainable energy solutions .

What Does the Clean and Renewable Energy Market Encompass?

The Clean and Renewable Energy Market encompasses the electricity and heat generation revenue derived from solar photovoltaic, concentrated solar power, onshore and offshore wind, large and small hydropower, biomass and biogas, geothermal, and marine energy technologies operating across utility-scale and distributed deployment models worldwide. Our assessment indicates that the scope covers all commercial and institutional clean energy production, spanning grid-connected and off-grid systems owned by utilities, independent producers, corporate end users, public authorities, and community cooperatives.

Regulatory frameworks , including national renewable portfolio standards, carbon pricing mechanisms, and international climate commitments under the Paris Agreement , increasingly shape project approval timelines and offtake pricing across the market. We observed that technology adoption is accelerating for distributed solar photovoltaic and corporate power purchase agreement structures, while offshore wind and enhanced geothermal systems are entering commercial-scale deployment. NMSC's analysis indicates that this technology maturation, combined with declining levelized costs across most renewable categories, is redefining project economics across the clean and renewable energy value chain.

Market Drivers & Dynamics

Interactive Dataset
Declining solar PV and wind levelized costs enabling broader project economics driver +1.8% Global 2026-2035
Expanding corporate and C&I direct renewable power purchase agreements driver +1.3% North America, Europe, Asia-Pacific 2026-2035
National renewable energy targets aligned with net-zero commitments driver +1.1% Global 2026-2032
Rising distributed and behind-the-meter solar adoption driver +0.8% Asia-Pacific, Latin America 2026-2035
Growth of off-grid renewable deployment for energy-access markets driver +0.6% Middle East & Africa, Asia-Pacific 2028-2035
Grid interconnection backlogs constraining utility-scale project commissioning restraint -0.9% North America, Europe 2026-2032
Supply chain constraints for offshore wind components restraint -0.6% Europe, Asia-Pacific 2026-2030
Permitting and land-use regulatory delays for large onshore projects restraint -0.5% North America, Europe 2026-2032
Source: Next Move Strategy Consulting

Growth Drivers

What Is the Primary Growth Driver of the Clean and Renewable Energy Market?

Declining solar PV and wind levelized costs , enabling broader project economics , are the primary driver of the market. The International Renewable Energy Agency (IRENA) reported that the global weighted-average levelized cost of electricity from utility-scale solar PV fell approximately 90% between 2010 and 2023. We observed that this cost trajectory continues to expand the addressable project pipeline as renewable generation achieves cost parity with fossil fuel alternatives across an expanding set of geographies and market structures.

How Is Corporate Renewable Procurement Driving Market Growth?

Expanding corporate and commercial and industrial direct renewable power purchase agreements are accelerating market growth by diversifying offtake beyond utility procurement. We found that BNEF reports that corporate clean-energy PPA volume declined 10% in 2025 to 55.9 GW, following a record 62 GW in 2024 . Our assessment indicates that this structural demand expansion is compressing pricing and extending contract tenors for large renewable project developers.

Growth Inhibitors

What Is Restraining Clean and Renewable Energy Market Expansion?

Grid interconnection backlogs constraining utility-scale project commissioning represent the most significant near-term restraint on market expansion. The U.S. Federal Energy Regulatory Commission and national grid operators in Germany, the UK, and Australia have all documented multi-year queues for interconnection approval across their respective transmission systems. We found that this infrastructure constraint is delaying revenue recognition for contracted projects and compressing developer returns across the utility-scale segment.

What Are the Growth Opportunities?

How Can Off-Grid Deployment Unlock Energy-Access Markets for Renewable Developers?

Rising demand for reliable electricity in underserved communities and industrial sites across Africa and South Asia creates a mechanism for developers to deploy off-grid renewable microgrids under commercial service agreements. Developers with modular solar-plus-storage platforms stand to benefit most, capturing the Off-Grid connection model segment which is projected to expand at a 10.07% CAGR from 2026 to 2035.

What Opportunity Does Corporate End-User Ownership Create for Clean Energy Developers?

Growing corporate demand for direct ownership of renewable energy assets is creating opportunities for developers to serve large commercial buyers. This includes build-transfer and development-service agreements that support corporate sustainability commitments. Developers expanding portfolios of corporate-owned distributed and utility-scale assets are positioned to capture rising demand within the Corporate End User Owned segment, which is projected to expand at a 9.61% CAGR from 2026 to 2035 .

How Can Self-Consumption Models Capture Industrial Decarbonization Demand?

Rising industrial electricity costs and decarbonization commitments create a mechanism for developers to offer behind-the-meter and on-site renewable generation under self-consumption structures that reduce energy expenditure directly. Industrial and manufacturing facilities with high electricity loads stand to benefit most, within the Self-Consumption offtake arrangement projected to grow at a 10.07% CAGR, supporting broader demand for stationary energy storage integration alongside clean generation.

Segmentation Analysis

2025 (USD Billion)
2035 (USD Billion)
Solar Energy
Solar Photov
Concentrated
Wind Energy
Onshore Wind
Segment Item 2025 (USD Billion) 2035 (USD Billion) CAGR
Solar Energy $10.0 USD Billion $40.0 USD Billion 14.0%
Solar Photovoltaic $17.1 USD Billion $51.1 USD Billion 8.0%
Concentrated Solar Power $24.2 USD Billion $62.2 USD Billion 14.0%
Wind Energy $31.3 USD Billion $73.3 USD Billion 20.0%
Onshore Wind $38.4 USD Billion $84.4 USD Billion 27.0%

Segment-wise data is locked

Unlock complete segment-wise numbers for By Energy Source.

Unlock Full Data

Which Energy Source Dominates the Clean and Renewable Energy Market?

Solar Energy led the market with USD 210.04 Billion in 2025, supported by the continued rapid deployment of utility-scale and distributed solar photovoltaic capacity across Asia-Pacific, Europe, and North America. Solar Energy and Geothermal Energy are tied as the fastest-growing energy sources, both expanding at a 7.37% CAGR from 2026 to 2035, with geothermal's growth accelerating as enhanced geothermal systems technology opens new deployment regions previously limited to conventional hydrothermal resources.

2025 (USD Billion)
2035 (USD Billion)
Utility Scal
Distributed
Segment Item 2025 (USD Billion) 2035 (USD Billion) CAGR
Utility Scale $10.0 USD Billion $40.0 USD Billion 25.0%
Distributed $17.1 USD Billion $51.1 USD Billion 11.0%

Segment-wise data is locked

Unlock complete segment-wise numbers for By Deployment Model.

Unlock Full Data

Which Deployment Model Leads the Clean and Renewable Energy Market?

Utility-scale led the market with USD 504.09 Billion in 2025, supported by large government-backed procurement programs and the scale efficiencies of gigawatt-class solar and wind farms. Distributed deployment is the fastest-growing model, expanding at a 6.03% CAGR from 2026 to 2035, as rooftop solar, commercial-scale microgrids, and community renewable programs capture growing demand from commercial users and households seeking direct clean power access outside traditional utility supply channels.

2025 (USD Billion)
2035 (USD Billion)
Grid-Connect
Grid-Connect
Off-Grid
Segment Item 2025 (USD Billion) 2035 (USD Billion) CAGR
Grid-Connected Front of Meter $10.0 USD Billion $40.0 USD Billion 27.0%
Grid-Connected Behind the Meter $17.1 USD Billion $51.1 USD Billion 9.0%
Off-Grid $24.2 USD Billion $62.2 USD Billion 19.0%

Segment-wise data is locked

Unlock complete segment-wise numbers for By Connection Model.

Unlock Full Data
2025 (USD Billion)
2035 (USD Billion)
Independent
Utility Owne
Corporate En
Public Autho
Community an
Segment Item 2025 (USD Billion) 2035 (USD Billion) CAGR
Independent Producer Owned $10.0 USD Billion $40.0 USD Billion 14.0%
Utility Owned $17.1 USD Billion $51.1 USD Billion 24.0%
Corporate End User Owned $24.2 USD Billion $62.2 USD Billion 22.0%
Public Authority Owned $31.3 USD Billion $73.3 USD Billion 12.0%
Community and Cooperative Owned $38.4 USD Billion $84.4 USD Billion 27.0%

Segment-wise data is locked

Unlock complete segment-wise numbers for By Ownership Model.

Unlock Full Data
2025 (USD Billion)
2035 (USD Billion)
Utility and
Commercial a
Residential
Public Secto
Agriculture
Segment Item 2025 (USD Billion) 2035 (USD Billion) CAGR
Utility and Wholesale $10.0 USD Billion $40.0 USD Billion 24.0%
Commercial and Industrial $17.1 USD Billion $51.1 USD Billion 22.0%
Residential $24.2 USD Billion $62.2 USD Billion 20.0%
Public Sector $31.3 USD Billion $73.3 USD Billion 22.0%
Agriculture $38.4 USD Billion $84.4 USD Billion 13.0%

Segment-wise data is locked

Unlock complete segment-wise numbers for By Offtaker Type.

Unlock Full Data
2025 (USD Billion)
2035 (USD Billion)
Merchant Sal
Power Purcha
Regulated Ta
Self-Consump
Retail Suppl
Segment Item 2025 (USD Billion) 2035 (USD Billion) CAGR
Merchant Sales $10.0 USD Billion $40.0 USD Billion 23.0%
Power Purchase Agreement $17.1 USD Billion $51.1 USD Billion 9.0%
Regulated Tariff $24.2 USD Billion $62.2 USD Billion 19.0%
Self-Consumption $31.3 USD Billion $73.3 USD Billion 13.0%
Retail Supply $38.4 USD Billion $84.4 USD Billion 10.0%

Segment-wise data is locked

Unlock complete segment-wise numbers for By Offtake Arrangement.

Unlock Full Data

Growth Opportunities

Our analysis shows that three forward-looking whitespace opportunities stand out for stakeholders positioning within the Clean and Renewable Energy market over the 2026–2035 forecast period.

How Can Off-Grid Deployment Unlock Energy-Access Markets for Renewable Developers?

Rising demand for reliable electricity in underserved communities and industrial sites across Africa and South Asia creates a mechanism for developers to deploy off-grid renewable microgrids under commercial service agreements. Developers with modular solar-plus-storage platforms stand to benefit most, capturing the Off-Grid connection model segment which is projected to expand at a 10.07% CAGR from 2026 to 2035.

What Opportunity Does Corporate End-User Ownership Create for Clean Energy Developers?

Growing corporate demand for direct ownership of renewable energy assets is creating opportunities for developers to serve large commercial buyers. This includes build-transfer and development-service agreements that support corporate sustainability commitments. Developers expanding portfolios of corporate-owned distributed and utility-scale assets are positioned to capture rising demand within the Corporate End User Owned segment, which is projected to expand at a 9.61% CAGR from 2026 to 2035 .


How Can Self-Consumption Models Capture Industrial Decarbonization Demand?

Rising industrial electricity costs and decarbonization commitments create a mechanism for developers to offer behind-the-meter and on-site renewable generation under self-consumption structures that reduce energy expenditure directly. Industrial and manufacturing facilities with high electricity loads stand to benefit most, within the Self-Consumption offtake arrangement projected to grow at a 10.07% CAGR, supporting broader demand for stationary energy storage integration alongside clean generation.

Regional Outlook

2025 (USD Billion)
2035 (USD Billion)
Asia-Pacific
Europe
North Americ
Latin Americ
Middle East
Region 2025 (USD Billion) 2035 (USD Billion) CAGR (%)
Asia-Pacific $10.0 USD Billion $40.0 USD Billion 9.0%
Europe $17.1 USD Billion $51.1 USD Billion 27.0%
North America $24.2 USD Billion $62.2 USD Billion 25.0%
Latin America $31.3 USD Billion $73.3 USD Billion 23.0%
Middle East & Africa $38.4 USD Billion $84.4 USD Billion 12.0%

Regional data is locked

Unlock complete regional numbers for this market.

Unlock Full Data

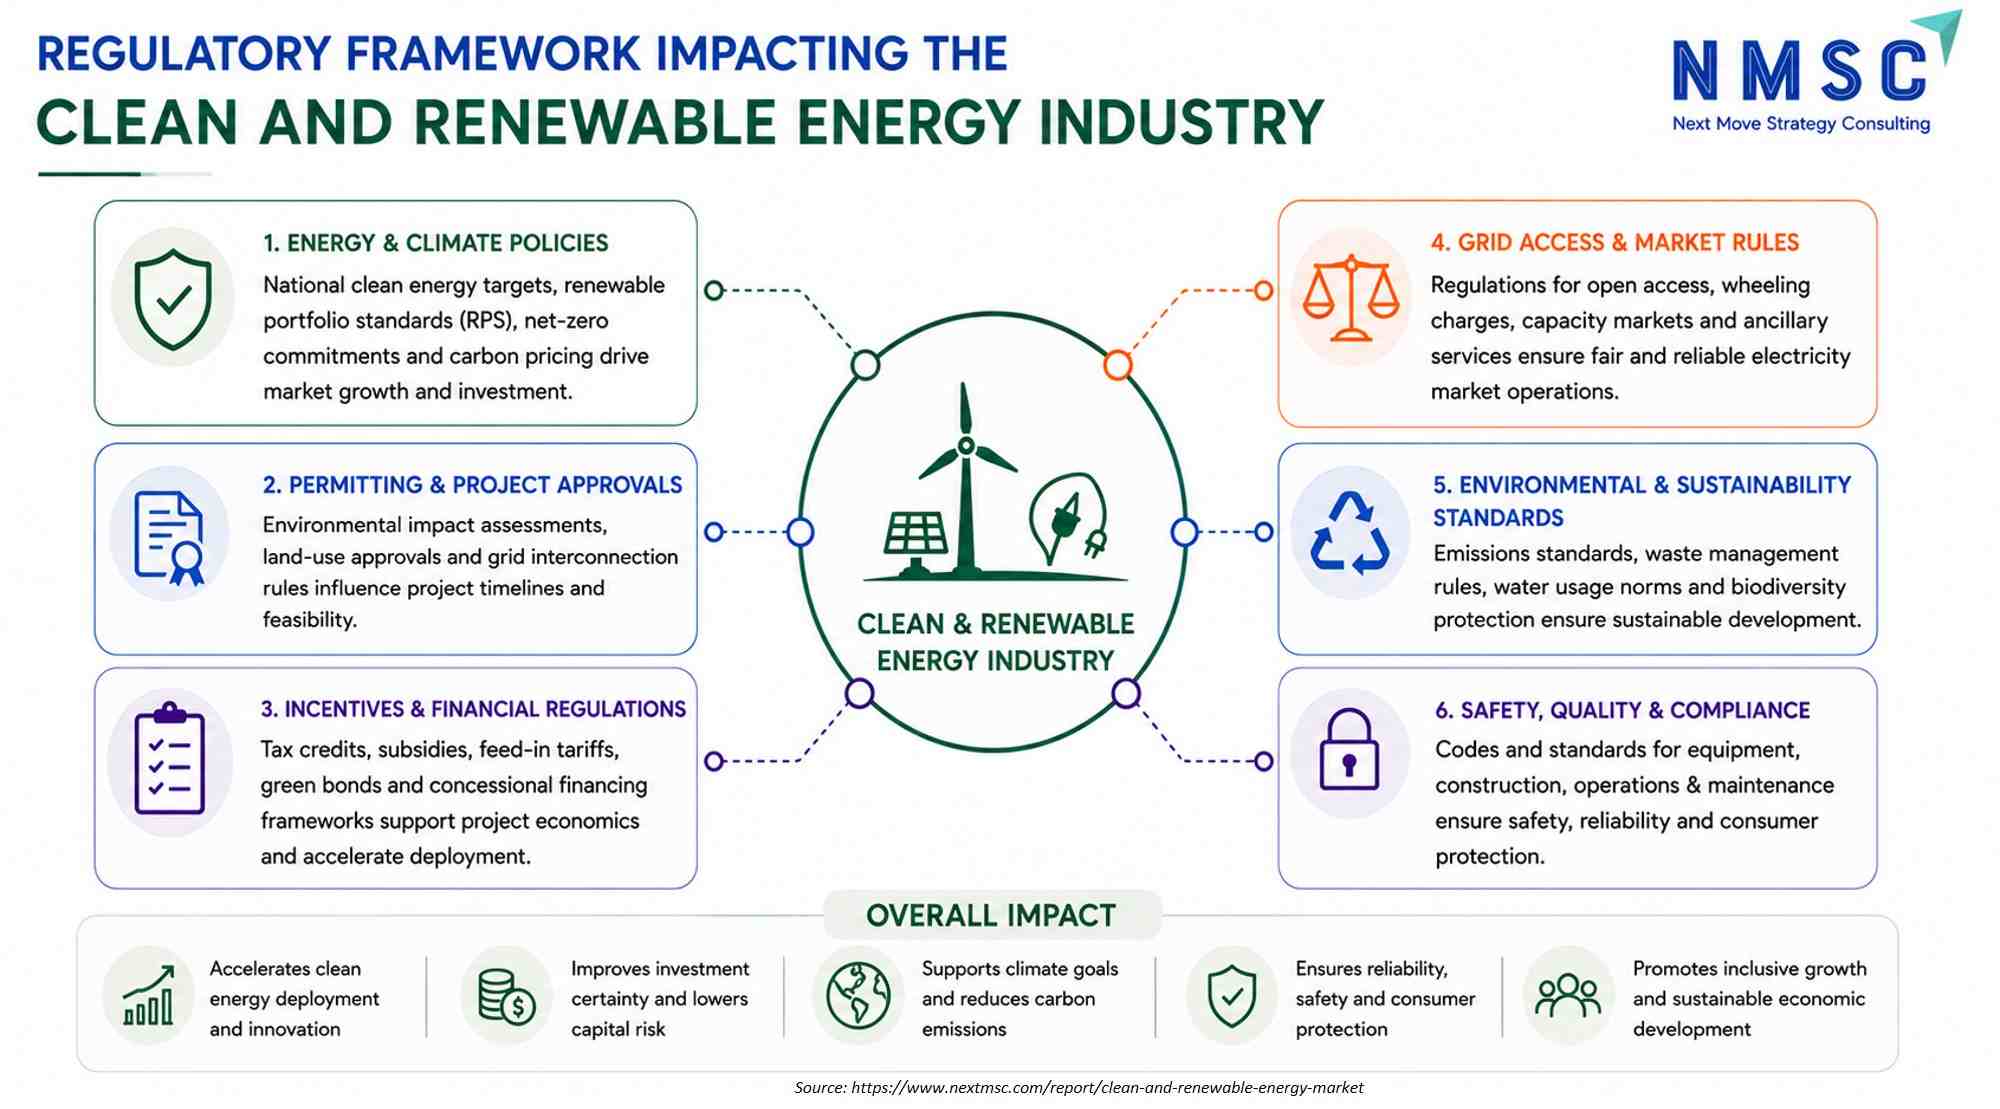
Regulatory Framework Impacting the Clean and Renewable Energy Industry

The above infographic outlines the regulatory framework impacting the clean and renewable energy industry, identifying six key areas that shape market growth and deployment. It details how policies, financial incentives, and permitting processes accelerate project development, while grid access rules and environmental standards ensure fair and sustainable operations. The analysis further highlights the overall impact of these regulations, noting that they reduce capital risk while promoting safety and consumer protection. Ultimately, it concludes that a robust regulatory environment is essential for supporting climate goals, driving innovation, and ensuring inclusive economic growth .

Competitive Landscape

We observed that the Clean and Renewable Energy market features a moderately concentrated competitive landscape, with state-affiliated utilities and large independent producers competing alongside specialized pure-play renewable developers on project scale, geographic diversification, and long-term contracted revenue quality across the Industry . Key Takeaways

Dimension Description
Market Structure Moderately concentrated; the 20 companies profiled collectively represent a significant share of global contracted renewable generation capacity, while hundreds of smaller national and regional developers compete for project-level market share across individual geographies.
Innovation Focus Offshore wind floating platforms, enhanced geothermal systems commercialization, green hydrogen co-location, and AI-driven asset performance optimization dominate current innovation pipelines across leading developers.
M&A Activity Continued portfolio expansion through project acquisition and development-stage asset purchases, exemplified by Brookfield Renewable Partners' sustained capital deployment across solar, wind, and hydro assets globally.

How Do Companies Compete in the Clean and Renewable Energy Market?

Companies compete primarily on project development scale, contracted revenue quality, and geographic diversification across the industry. State-affiliated utilities such as Électricité de France and China Three Gorges Renewables compete through sovereign-backed balance sheets and regulatory relationships, while large independent producers such as Iberdrola, Enel, and NextEra Energy Resources compete through integrated development, financing, and operations capability across multiple technology and geographic segments.

Which Competitive Archetypes Dominate the Clean and Renewable Energy Market?

Three archetypes define the competitive landscape: state-affiliated national champions with large regulated or quasi-regulated renewable portfolios, diversified multinational independent producers with multi-technology and multi-geography development capability, and focused pure-play renewable developers concentrated in specific technologies or regions. China Three Gorges Renewables and EDF exemplify the national champion archetype, Iberdrola and Enel exemplify the multinational archetype, and Adani Green Energy and ReNew Energy Global exemplify the focused pure-play archetype.

How Are Companies Differentiating Through Innovation in Clean and Renewable Energy?

Innovation and differentiation strategy increasingly center on technology breadth, green hydrogen integration, and digital asset management. Ørsted continues advancing floating offshore wind development to access deep-water markets, while ACWA Power integrates green hydrogen co-location into large solar projects in Saudi Arabia. Our analysis shows that companies failing to demonstrate clear differentiation in either technology capability, contracted revenue quality, or geographic growth pipeline risk valuation discounts relative to more diversified peers.

What M&A and Expansion Activity Is Shaping the Clean and Renewable Energy Market?

Acquisition-driven portfolio expansion and strategic development-stage asset purchases continue to reshape competitive positioning within the industry. Brookfield Renewable Partners has maintained an active capital deployment program across solar, wind, hydro, and distributed energy assets globally through 2025. ENGIE SA continued advancing its renewable energy development pipeline across Europe, Latin America, and Asia-Pacific as part of its strategic transition toward clean energy generation and energy services.

Key Market Players

Our assessment indicates that the following 20 companies are actively shaping project development scale, technology innovation, and geographic expansion within the Clean and Renewable Energy market.

China Three Gorges Renewables (Group) Co., Ltd. Enel S.p.A. ENGIE SA Iberdrola, S.A. China Resources Power Holdings Company Limited Brookfield Renewable Partners L.P. Abu Dhabi Future Energy Company PJSC China Longyuan Power Group Corporation Limited NextEra Energy Resources, LLC RWE AG Électricité de France S.A. EDP Renováveis , S.A. Adani Green Energy Limited Statkraft AS ACWA Power Company ReNew Energy Global plc Corporación Acciona Energías Renovables , S.A. Ørsted A/S Vattenfall AB Jinko Power Technology Co., Ltd.

Latest Developments

We found that recent capacity additions, project milestones, and strategic announcements within the clean and renewable energy supply chain reflect continued deployment momentum across solar, wind, and emerging energy technologies.

Date Event
September 2026 Enel completed the acquisition of an 810 MW portfolio of solar plants in the United States, expanding its renewable generation footprint in a major clean-energy market.
August 2026 Ørsted and Nuveen Infrastructure commissioned the 913 MW Borkum Riffgrund 3 offshore wind farm in Germany. The project supplies renewable electricity to industrial and technology customers under long-term PPAs .
July 2026 Adani Green Energy surpassed 20 GW of operational renewable capacity, supported by continued solar and wind development. The company also reported 3.55 GWh of operational battery storage and is advancing its objective of reaching 50 GW of renewable capacity by 2030.

Expert Insights

Sagar Adani

Sagar Adani

Executive Director | Adani Green Energy Limited

"As renewable energy assumes a larger share of India's power mix, battery storage is becoming central to delivering reliable, dispatchable clean power ."

Analyst Interpretation

The statement highlights the growing importance of battery energy storage systems in supporting higher renewable-energy penetration and reliable clean-power delivery. Next Move Strategy Consulting’s analysis indicates that the expansion of intermittent solar and wind generation is increasing demand for storage capacity that improves grid flexibility and enables renewable electricity to be dispatched according to power demand. Our findings suggest that the integration of renewable generation with large-scale battery storage will remain a key growth driver for the Clean and Renewable Energy Market as utilities and power developers prioritize energy reliability, system flexibility, and round-the-clock clean electricity through 2035 .

Investment Opportunities

What Capital Inflows Are Supporting the Clean and Renewable Energy Market?

Global clean energy investment reached record levels through 2024 and continued expanding into 2025, supported by policy incentives including the U.S. Inflation Reduction Act, the EU Green Deal Industrial Plan, and national renewable procurement programs across Asia-Pacific. We observed that institutional investors and infrastructure funds continued directing capital toward contracted renewable assets with long-tenor power purchase agreements, driven by the category's inflation-linked revenue characteristics and growing ESG mandates.

How Is Infrastructure Investment Shaping Clean and Renewable Energy Demand?

Transmission grid expansion and offshore wind port and cable infrastructure investment are critical enablers of renewable energy market scalability beyond current contracted pipelines. Our assessment indicates that multi-billion-dollar grid investment programs across the U.S., Germany, the UK, and India are creating sustained multi-year demand for project interconnection capacity, which will directly determine how rapidly contracted renewable generation can be commissioned and reach revenue generation.

What ESG Considerations Are Influencing Clean and Renewable Energy Investment Decisions?

Environmental, social, and governance considerations are directly aligned with the clean and renewable energy market's core value proposition. Institutional investors continue increasing clean energy asset allocations under net-zero portfolio commitments and sustainable infrastructure mandates. We found that developers with certified biodiversity, community engagement, and supply chain transparency standards are increasingly preferred for large capital raises, reflecting tightening ESG due diligence requirements from major infrastructure and pension fund investors.

Key Benefits for Stakeholders

How Does This Report Benefit Energy Industry Leaders and Project Developers?

Energy industry leaders and project developers gain granular segmentation data across energy source, deployment model, connection model, ownership, offtaker , and offtake arrangement axes, enabling informed portfolio development and market entry strategy decisions. Our analysis, data, and forecasts help developers benchmark pipeline strategy against verified 2025–2035 market trajectories and evolving competitive positioning across the global clean energy landscape.

How Does This Report Benefit Investors and Financial Analysts?

Investors and financial analysts gain a validated 2025 base-year market size, a fundamentals-supported 2026–2035 CAGR, and segment-level growth trajectories that support capital allocation and competitive benchmarking decisions. The report's regional growth analysis and key driver matrix help analysts assess relative risk-return positioning across energy sources, geographies, and ownership models within the clean and renewable energy investment universe.

How Does This Report Benefit Technology Vendors and Product Teams?

Technology vendors and product teams gain visibility into the fastest-growing sub-segments, including Off-Grid connection, Corporate End User Owned, and Self Consumption models, informing product roadmap and go-to-market prioritization aligned with documented market structure shifts through 2035. Vendors in solar, wind, storage, and digital asset management can use these insights to align development roadmaps with the segments generating the strongest demand growth.

Key Market Segments Evaluated

By Energy Source

  • Solar Energy
  • Solar Photovoltaic
  • Concentrated Solar Power
  • Wind Energy 
    • Onshore Wind
    • Offshore Wind
  • Hydropower
  • Large Hydropower
  • Small Hydropower
  • Bioenergy
  • Biomass Power
  • Biogas Power
  • Geothermal Energy
  • Hydrothermal
  • Enhanced Geothermal Systems
  • Closed Loop Geothermal
  • Marine Energy
  • Tidal Energy
  • Wave Energy
  • Ocean Thermal Energy Conversion
  • Salinity Gradient Energy

By Deployment Model

  • Utility Scale
  • Distributed

By Connection Model

  • Grid-Connected Front of Meter
  • Grid-Connected Behind the Meter
  • Off-Grid

By Ownership Model

  • Independent Producer Owned
  • Utility Owned
  • Corporate End User Owned
  • Public Authority Owned
  • Community and Cooperative Owned

By Offtaker Type

  • Utility and Wholesale
  • Commercial and Industrial
  • Residential
  • Public Sector
  • Agriculture
  • Community and Cooperative
  • Other Offtakers

By Offtake Arrangement

  • Merchant Sales
  • Power Purchase Agreement
  • Regulated Tariff
  • Self-Consumption
  • Retail Supply

By Region

  • North America: U.S., Canada, Mexico 
    • Europe: UK, Germany, France, Italy, Spain, Sweden, Denmark, Finland, Netherlands, Rest of Europe
    • Asia-Pacific: China, India, Japan, South Korea, Taiwan, Indonesia, Vietnam, Australia, Philippines, Malaysia, Rest of APAC
    • Middle East & Africa: Saudi Arabia, UAE, Egypt, Israel, Turkey, Nigeria, South Africa, Rest of MEA
    • Latin America: Brazil, Argentina, Chile, Colombia, Rest of LATAM

Conclusion & Recommendations

The Clean and Renewable Energy market is positioned for sustained, broad-based growth through 2035, underpinned by falling technology costs, national net-zero commitments, and deepening corporate demand for contracted clean power. We expect Solar Energy, Distributed deployment, and Corporate End User Owned and Self Consumption models to gain structural share, while Utility Scale and Power Purchase Agreement arrangements retain the largest absolute revenue contributions across the forecast period.

What Strategic Positioning Should Stakeholders Pursue?

Developers should prioritize geographic diversification, multi-technology capability, and contracted revenue quality to align with institutional investor preferences and offtaker demand evolution. Our assessment indicates that developers building proven capabilities across at least two major energy sources and three or more geographies, following the model of Iberdrola, Enel, and Brookfield Renewable Partners, are best positioned to sustain premium valuations and access competitive capital through 2035.

How Attractive Is the Clean and Renewable Energy Market for Investment?

The market presents a highly attractive investment case, supported by a validated USD 433.98 Billion absolute dollar opportunity between 2026 and 2035 and a fundamentals-backed 5.32% CAGR. Policy support under the Inflation Reduction Act, REPowerEU , and national renewable procurement programs across Asia-Pacific creates durable demand visibility that distinguishes clean energy from most infrastructure investment categories exposed to greater demand uncertainty.

What Market Shifts and Key Risks Should Stakeholders Monitor?

Stakeholders should monitor grid interconnection backlogs, supply chain constraints for offshore wind components, and interest rate sensitivity of long-duration infrastructure assets as key near-term risks. We found that permitting and land-use regulatory delays for onshore projects in Europe and North America also pose meaningful risks to development timelines, with the potential to shift project delivery schedules and affect contracted revenue recognition across the utility-scale segment.

What Are the Key Growth Pathways Through 2035?

Key growth pathways include scaling Solar Energy deployment across Asia-Pacific and Latin America, advancing Offshore Wind in Asian markets, expanding Corporate End User Owned and Self Consumption models, and deepening Off-Grid renewable deployment for energy-access markets. Our findings suggest that developers and investors combining technology diversification with long-term contracted revenue strategies are best positioned to capture a disproportionate share of the market's projected USD 1,181.65 Billion 2035 revenue base.

Delivered Customizations

We have successfully delivered the following deep-dive customizations:

Client Request Customization Delivered Value Adds
Historical Market Growth Analysis
  • Historical installed capacity, generation, and market revenue analysis across solar, wind, hydro, bioenergy, geothermal, and other clean energy sources.
  • Identifies high-growth energy sources and sets a baseline for investment prioritization.
Company-Level Capacity and Generation Benchmarking
  • Developer and operator-level installed capacity, generation volume, and project pipeline benchmarking by energy source and deployment model.
  • Highlights competitor scale and portfolio mix to guide competitive positioning and M&A screening.
Country-Level Trade Assessment
  • Country-wise import and export analysis for key clean energy equipment such as solar modules, wind turbines, and inverters.
  • Reveals sourcing dependencies and supply chain exposure to support procurement and localization decisions.
Offtake Arrangement and Contract Structure Analysis
  • Mapping of PPAs, utility contracts, auctions, and feed-in or tariff-based arrangements by offtaker type and energy source, using public auction and regulatory data.
  • Supports contract structuring and revenue-risk decisions when targeting corporate, utility, and government buyers.
Deployment and Connection Model Opportunity Assessment
  • Regional installed capacity and growth analysis across utility-scale, distributed, and off-grid deployments, split by grid-connected versus standalone connection models.
  • Prioritizes high-potential deployment formats and regions for market entry and capital allocation.
Ownership Model and Offtaker Demand Analysis
  • Capacity and project-activity analysis by ownership model (utility-owned, independent power producer, community, third-party-owned) cross-mapped to commercial, industrial, residential, and utility offtakers.
  • Identifies which ownership and customer combinations offer the best partnership and customer-targeting opportunities.

FAQs

About the Author

Mayurima Roy

Mayurima Roy

Mayurima Roy is Research Analyst at Next Move Strategy Consulting, where she has spent 4 years working across the firm's full industry coverage rather than a single fixed vertical. Her work centers on structured research, ongoing trend tracking, competitive assessment, and insight-led content development, translating complex market data into clear, decision-ready narratives that support informed client decision-making across diverse global industries, market sectors, and world regions every day.

About the Reviewer

Supradip Baul

Supradip Baul

Supradip Baul is an accomplished business consultant and strategist with over a decade of rich experience in market intelligence, strategy, technology, and business transformation. His work has included rigorous qualitative and quantitative analysis across multiple industries, helping clients shape investment decisions and long-term roadmaps. Earlier in his career, he was associated with Gartner, where he contributed to industry-leading reports and market share analyses. He has worked with leading global companies and holds an MBA with a dual specialization in Marketing and Finance.

Download Free Sample

Rishabh Jogani

RISHABH JOGANI

Strategy Analyst

Accenture Japan

We are incredibly impressed with the market report on the real estate market in India provided by Next Move Strategy Consulting. The report was thorough, insightful, and well-structured, offering deep analysis and actionable recommendations. It not only captured the current trends and dynamics but also provided a forward-looking perspective that has been invaluable for our strategic planning. Their team demonstrated exceptional professionalism, attention to detail, and a profound understanding of the industry. The data-driven insights and clarity of presentation exceeded our expectations, making complex market trends easy to understand. We highly recommend Next Move Strategy Consulting to anyone looking for reliable and comprehensive market research services. Their expertise has given us the confidence to navigate the complexities of the Indian real estate market with clarity and foresight.

Pratyush Kumar Das

PRATYUSH KUMAR DAS

Assistant Manager

Polycab India Limited

We would like to express our appreciation for the data and insights provided by nextmsc. We are very pleased with the quality and depth of the information, which has proven to be highly valuable and beneficial for our business decision-making.

Mohit Agarwal

MOHIT AGARWAL

Chief Manager

DryChem India Pvt. Ltd.

Next Move Strategy Consulting is an amazing team of consultants. We required a market study report for our investors on top priority and the team went above and beyond our expectations to deliver the same with ample supporting data within a short time span enabling us to secure the investments and keep our project timeline maintained. Their professionalism, attention to detail, and timely delivery of actionable recommendations have left a lasting impression on our organization.

Semih Kavaklioglu

SEMIH KAVAKLIOGLU

Co-Founder & Sales Manager

Decortie

I work a lot in the marketing industry and I know that research is an essential part of any campaign. I have used Market research reports for my own products and I found them to be very informative and well-researched. The team here produces insightful reports for a good price

Diana Trejo

DIANA TREJO

Assistant Manager

Sumitomo Corporation de Mexico, S.A. de C.V.

Recently, we purchased a report on the Mexico Data Center Market from Next Move Strategy Consulting. The service has been excellent, with support that is always timely and thoroughly professional. The information provided is interesting, highly useful, and delivered with clarity. I would highly recommend NextMSC for anyone seeking insightful and dependable analysis.

Custom Market Research Services

We will customize the research for you if the listed report does not fully match your requirements.

Get 30% Free Customization

Select License

This website uses cookies to ensure you get the best experience on our website. Learn more

✖