Grid-Scale Energy Storage Infrastructure Powers the 100-GW Era

Introduction
The global power system has crossed a structural threshold. In 2025, annual additions of energy storage infrastructure surpassed 100 gigawatts (GW) for the first time, reaching 112 GW and 307 gigawatt-hours (GWh) of new capacity worldwide—a 48% jump from the prior year, according to BloombergNEF.
For utility-scale developers, EPC contractors, and institutional investors, this is not an incremental shift; it is a redefinition of how flexibility is procured and monetized across modern grids. Energy storage infrastructure has evolved from a niche ancillary-service asset into a core balancing resource that increasingly outpaces both wind and solar in deployment momentum. This article examines the defining events of the past six months, analyzes the industry impact, and presents the forward outlook for stakeholders building grid-scale storage portfolios.
For More Information – Download FREE Sample on Energy Storage Infrastructure Market Report
Crossing 100 GW: The Defining Shift in Grid-Scale Storage
The single most significant industry event of recent months was the confirmation, published by BloombergNEF in May 2026, that energy storage formally entered the "100-gigawatt era." It took only four years for annual storage additions to climb from 10 GW to more than 100 GW, compared with roughly eight years for solar and 15 years for wind to achieve the same scaling milestone.
The International Energy Agency (IEA) corroborated this acceleration in its May 2026 commentary, reporting that total battery storage capacity additions reached 108 GW in 2025, up approximately 40% from 2024—exceeding even the historical peak for gas-fired capacity additions of around 107 GW set in 2002. Critically for grid-scale storage providers, utility-scale battery storage accounted for around 87 GW of these additions, roughly four-fifths of the global total.
The market is also geographically broadening. China commanded 54% of global additions, followed by the United States at 16%, while Australia's deployment surged nearly sixfold and Saudi Arabia emerged as a fast-rising market. The application mix is maturing in parallel: the IEA notes that energy shifting now represents more than 90% of new project applications, up from around 40% in 2015, while the average duration of commissioned utility-scale projects rose to three hours in 2025 from approximately two hours in 2023.
")
NMSC Strategic Perspective
In NMSC's assessment, the crossing of the 100-GW threshold marks the transition of energy storage infrastructure from a supplementary asset class into foundational grid hardware. The decisive variable for developers is no longer whether demand exists, but whether interconnection queues, permitting timelines, and supply-chain resilience can keep pace. NMSC observes that the structural pivot toward energy shifting and longer-duration assets fundamentally alters project underwriting: turnkey grid storage providers must now design for multi-revenue-stream optimization rather than single-service ancillary contracts. Stakeholders that secure interconnection positions and durable offtake structures early in this cycle are positioned to capture disproportionate value as the market scales.
Section Summary: The energy storage sector achieved a historic milestone in 2025, with utility-scale systems driving the vast majority of record growth, while applications shifted decisively toward energy shifting and longer durations.
-
Global storage additions reached 112 GW / 307 GWh in 2025, up 48% year-on-year (BNEF).
-
Utility-scale systems comprised approximately 87 GW—about four-fifths of total additions (IEA).
-
Energy shifting now drives over 90% of new project applications, with average durations rising to three hours.
-
China (54%) and the United States (16%) led global deployment, with Australia and Saudi Arabia emerging rapidly.
Industry Impact Analysis
The implications of this surge extend well beyond capacity figures. In the United States, the Energy Information Administration (EIA) reported in February 2026 that developers plan to add a record 86 GW of new utility-scale generating capacity in 2026, with battery storage representing 28% of that total—around 24 GW, compared with a record 15 GW added in 2025. Roughly 80% of this new battery capacity is concentrated in just three states: Texas (12.9 GW), California (3.4 GW), and Arizona (3.2 GW).
The operational role of storage is also being validated at grid scale. The IEA documented that on the evening of 29 March 2026, batteries covered more than 40% of California's power load at one point, and that battery storage went from contributing under 1% of hour-to-hour ramping needs five years ago to above 60% in the first quarter of 2026. This demonstrates that grid-scale battery installation is no longer a reliability hedge—it is becoming the primary instrument of intraday balancing.
For C&I energy storage solutions and behind-the-meter assets, deployment is accelerating in markets with high retail electricity prices and supportive regulatory frameworks. The Solar Energy Industries Association (SEIA) and Benchmark Mineral Intelligence reported that the United States installed a record 57.6 GWh of new storage in 2025, a 30% increase over 2024, with 19 GWh of cumulative C&I storage installed to date.
A further dynamic shaping construction economics is speed to market. The IEA notes that median construction times for utility-scale batteries are around 275 days—close to solar PV at about 220 days, and far below gas at over two years and nuclear at more than six years—though total time to market is more often determined by permitting, financing, and grid connection than by construction itself.
Section Summary: Storage is reshaping grid operations and capacity planning, with the United States targeting record additions and batteries now performing core balancing functions, while interconnection and permitting remain the primary constraints.
-
The U.S. plans 24 GW of utility-scale battery additions in 2026, with 80% concentrated in Texas, California, and Arizona (EIA).
-
Batteries supplied over 60% of California's hour-to-hour ramping in Q1 2026 (IEA).
-
Cumulative U.S. C&I storage reached 19 GWh as of 2025 (SEIA / Benchmark).
-
Permitting, financing, and grid connection—not construction—now define total project timelines.
Pros and Cons of Recent Market Developments
|
Pros |
Cons |
|
Record-breaking deployment confirms structural demand and market maturity (BNEF: 112 GW in 2025). |
Interconnection, permitting, and grid-connection delays frequently exceed half of total project timelines (IEA). |
|
Rapid construction times (~275 days) provide a competitive flexibility advantage over gas and pumped hydro (IEA). |
Geographic concentration—54% of additions in China—creates supply-chain dependency (BNEF). |
|
Multi-revenue-stream "value stacking" improves project ROI as energy shifting dominates. |
Soaring fossil fuel prices amid Middle East conflict may raise shipping and manufacturing costs (BNEF). |
|
Battery costs fell more than 90% between 2010 and 2025, improving project economics (IEA). |
Regulatory uncertainty and removal of co-location mandates in some markets introduce planning risk. |
Key Data & Statistics
Global and U.S. Energy Storage Capacity Additions (2024–2026)
|
Metric |
2024 |
2025 |
2026 (Forecast) |
|
Global storage additions (GW) |
~76 |
112 |
158 |
|
Global storage additions (GWh) |
— |
307 |
459 |
|
U.S. utility-scale battery additions (GW) |
— |
15 |
24 |
|
U.S. annual storage installed (GWh) |
~44 |
57.6 |
600+ by 2030 |
Key Regional and Operational Indicators (2025–2026)
|
Regional / Operational Indicator |
Figure |
|
China share of 2025 global additions |
54% |
|
U.S. share of 2025 global additions |
16% |
|
Utility-scale share of 2025 additions |
~87 GW (≈80%) |
|
Battery contribution to California Q1 2026 ramping |
>60% |
|
Battery cost decline, 2010–2025 |
>90% |
")
Future Outlook & Forecast
The trajectory for energy storage infrastructure points firmly upward. BloombergNEF forecasts global annual additions of 158 GW / 459 GWh in 2026—a 41% increase over 2025—and projects annual additions surpassing 300 GW by 2036, supported by falling costs, deeper renewables penetration, co-location mandates, auctions, and emerging applications such as data centers and electric vehicle charging.
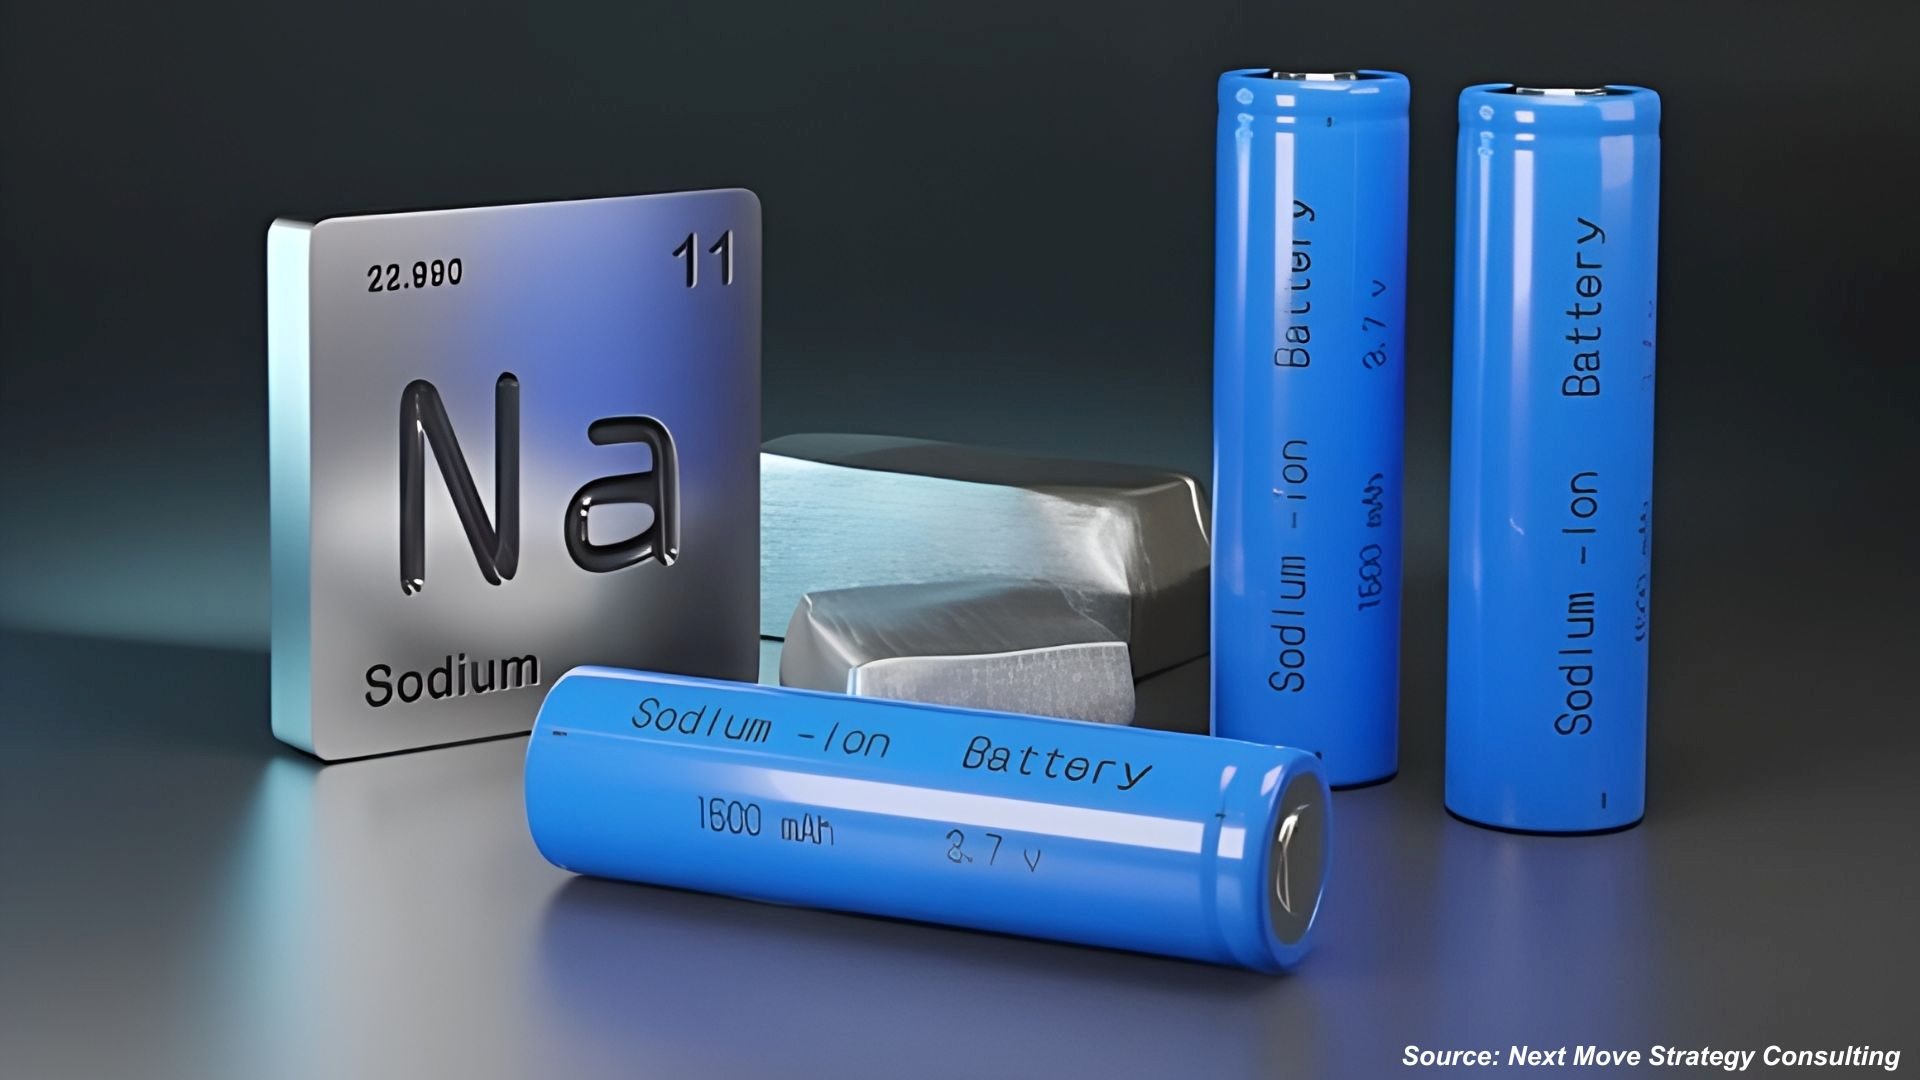
Technology diversification will be a defining theme. The IEA reports that lithium iron phosphate (LFP) accounted for more than 90% of annual additions in 2025, but BloombergNEF anticipates long-duration energy storage additions quadrupling to two GW in 2026—most of it from non-lithium technologies—alongside the early emergence of sodium-ion batteries in stationary applications.
Against this backdrop, NMSC's proprietary analysis frames the broader opportunity. NMSC identifies Asia-Pacific as the dominant regional market and North America as the fastest-growing region, with batteries, pumped hydro power, flywheel, and molten salt comprising the principal storage-type segments.
[Editorial note for publication team: Replace "USD XX billion" and "CAGR of YY%" with the verified proprietary figures from the NMSC report once finalized.]
Section Summary: The market is set for sustained, accelerating expansion through the decade, with technology diversification and longer-duration assets reshaping the competitive landscape while NMSC projects strong growth across 2024–2030.
-
BNEF forecasts 158 GW / 459 GWh of additions in 2026 and over 300 GW annually by 2036.
-
Long-duration storage additions are set to quadruple to 2 GW in 2026, led by non-lithium chemistries.
-
NMSC projects the Energy Storage Infrastructure Market to grow at a CAGR of YY% from 2024 to 2030, with Asia-Pacific leading.
-
Data centers and EV charging are emerging as new structural demand drivers.
Next Steps for Stakeholders
For C-level executives and institutional investors evaluating grid-scale energy storage investment, the present cycle rewards disciplined, early positioning:
-
Secure interconnection and permitting positions early. With non-construction phases often exceeding half of total project timelines, queue position is now a primary value driver.
-
Underwrite for revenue stacking. Design projects for combined energy shifting, capacity, and ancillary-service revenues rather than single-service models, reflecting the market's pivot toward energy shifting.
-
Diversify chemistry exposure. Monitor sodium-ion and long-duration non-lithium technologies for portfolios with multi-year deployment horizons.
-
Mitigate supply-chain concentration risk. Given China's 54% share of additions, evaluate sourcing resilience and the potential cost impact of geopolitical disruptions on equipment and shipping.
-
Prioritize high-value geographies. Concentrate capital in markets such as Texas, California, and Arizona where deployment and grid demand are densest.
Conclusion
Energy storage infrastructure has entered a new structural phase. The 100-GW milestone is not merely a record—it is confirmation that grid-scale storage has become indispensable to the operation of modern power systems. With utility-scale assets driving four-fifths of record additions, batteries now performing the majority of intraday balancing in leading markets, and forecasts pointing toward 158 GW of deployment in 2026, the strategic question for developers, EPC contractors, and investors has shifted decisively from feasibility to execution. Those who secure interconnection, optimize revenue stacking, and build supply-chain resilience will define the next decade of energy storage infrastructure leadership.
About the Author
 Sanyukta Deb is a senior content writer and content analyst with expertise in content strategy, audience engagement, and research-driven storytelling. With a strong leadership approach and strategic mindset, she drives content initiatives that strengthen brand communication and audience connection. She combines creativity with analytical insight to develop impactful, value-led content while mentoring collaborative efforts across teams to ensure consistent, meaningful engagement and long-term brand growth across digital platforms.
About the Reviewer
 Debashree Dey is a senior content writer and communications specialist known for crafting audience-focused narratives and insight-driven content strategies. As a published manuscript author, she combines creative storytelling with strategic thinking to strengthen brand messaging, enhance visibility, and drive meaningful audience engagement across digital platforms. With a collaborative leadership approach, she contributes to high-impact communication initiatives that ensure consistency, clarity, and long-term brand value. Outside of work, she finds inspiration in creative projects, design exploration, and storytelling-driven ideas.


Add Comment