B2B Payments Market Global Industry Analysis and Forecast (2026-2035)

B2B Payments Market size was USD 157.0 billion in 2026, projected to reach USD 385.0 billion by 2035, growing at a CAGR of 10.5% from 2026 to 2035. Key drivers include expanding real-time payment infrastructure, rising accounts payable and receivable automation, and growing cross-border payment digitization, with North America leading the market.

Download Free Sample PDF
Base Year (2025)
$145.00 Billion
Forecast (2035)
$385.00 Billion
CAGR (2026-2035)
10.5%
Top Region
North America

What Is the B2B Payments Market Size?

The global B2B payments market size was valued at USD 145.0 billion in 2025 and is estimated at USD 157.0 billion in 2026, forecast to reach USD 385.0 billion by 2035, expanding at a 10.5% CAGR between 2026 and 2035. North America leads with approximately 38% share, while Domestic Payments dominates all other payment type categories with approximately 68% share.

We observed that growth is broadening across every segmentation axis, with real-time payment infrastructure adoption and cross-border transaction digitization driving the dominant structural shifts through 2035.

B2B Payments Market Global Industry Analysis and Forecast (2026-2035) Revenue Forecast

Values in USD Billion

2025 $145.00 Billion
2025
2026 $160.23 Billion
2026
2027 $177.05 Billion
2027
2028 $195.64 Billion
2028
2029 $216.18 Billion
2029
2030 $238.88 Billion
2030
2031 $263.96 Billion
2031
2032 $291.68 Billion
2032
2033 $322.30 Billion
2033
2034 $356.15 Billion
2034
2035 $385.00 Billion
2035

Key Takeaways

By Payment Type: Domestic Payments held the largest share of approximately 68% (USD 98.60 billion) in 2025; Cross-Border Payments is the fastest-growing sub-segment at 13.8% CAGR from 2026–2035.

By Payment Method: Wire Transfer held the largest share of approximately 27% (USD 39.15 billion) in 2025; Real-Time Payments is the fastest-growing sub-segment at 18.4% CAGR from 2026–2035.

By Enterprise Size: Large Enterprises held the largest share of approximately 61% (USD 88.45 billion) in 2025; Small and Medium Enterprises is the fastest-growing sub-segment at 12.8% CAGR from 2026–2035.

By Deployment Mode: Cloud held the largest share of approximately 72% (USD 104.40 billion) in 2025 and is also the fastest-growing sub-segment at 12.9% CAGR from 2026–2035.

By Application: Accounts Payable held the largest share of approximately 32% (USD 46.40 billion) in 2025; Supply Chain Payments is the fastest-growing sub-segment at 12.7% CAGR from 2026–2035.

By End-Use Industry: BFSI held the largest share of approximately 21% (USD 30.45 billion) in 2025; Construction is the fastest-growing sub-segment at 12.5% CAGR from 2026–2035.

By Provider Type: Banks held the largest share of approximately 47% (USD 68.15 billion) in 2025; Payment Processors and Fintech Providers is the fastest-growing sub-segment at 12.9% CAGR from 2026–2035.

Dominant Region: North America dominated with approximately 38% revenue share (USD 55.10 billion) in 2025.

Fastest-Growing Region: Latin America is expected to register the highest CAGR of 15.5% during 2026–2035.

Dominant Country: U.S. led with approximately USD 44.63 billion in 2025.

Fastest-Growing Country: Argentina is the fastest-growing country at approximately 16.6% CAGR from 2026–2035.

Market Opportunity: The B2B payments market is expected to create an absolute dollar opportunity of USD 228.0 billion between 2026 and 2035, presenting significant investment potential across real-time payment rails and cross-border payment infrastructure.

According to NMSC analysis, providers are increasingly bundling accounts payable and receivable automation with embedded real-time payment rails, a shift that favors diversified fintech platforms with integrated workflow software over single-function payment processors as enterprises prioritize end-to-end payment visibility and working capital optimization through 2035.

What Does the B2B Payments Market Encompass?

The B2B payments market encompasses the technology platforms, processing infrastructure, and financial services that enable businesses to transact with suppliers, vendors, and partners through domestic and cross-border payment rails. Our assessment indicates that scope spans wire transfer, ACH, virtual card, digital wallet, and real-time payment methods delivered through cloud and on-premise deployment models to large enterprises and small and medium enterprises across accounts payable, accounts receivable, and supply chain payment applications. The market has evolved from manual, paper-based check processing into automated, API-driven payment orchestration, propelled by enterprise demand for working capital visibility and faster settlement cycles.

Regulatory frameworks including the Federal Reserve's FedNow Service and the European Union's Instant Payments Regulation continue to shape real-time payment infrastructure availability across major markets, while anti-money laundering and know-your-business compliance requirements influence platform onboarding processes. We observed that technology adoption is accelerating toward API-based payment orchestration and embedded finance integration within enterprise resource planning systems. NMSC's analysis indicates that this structural shift, combined with rising cross-border transaction digitization, is redefining competitive positioning across the B2B payments market.

Market Drivers & Dynamics

Interactive Dataset
Expanding real-time payment infrastructure adoption driver +2.2% North America, Europe 2026-2035
Rising demand for accounts payable and receivable automation driver +1.8% Global 2026-2035
Growing cross-border e-commerce and supplier digitization driver +1.4% Asia-Pacific, Latin America 2026-2035
Expanding embedded finance integration within enterprise software driver +1.1% North America, Europe 2026-2032
Rising small and medium enterprise digital payment adoption driver +0.9% Asia-Pacific, Latin America 2026-2035
Growing virtual card issuance for supplier payment programs driver +0.7% Global 2026-2032
Data-security and fraud-prevention compliance burden restraint -1.0% Global 2026-2032
Legacy banking infrastructure limiting real-time payment rollout restraint -0.7% Middle East & Africa, Latin America 2026-2032
Interoperability challenges across fragmented payment rails restraint -0.6% Global 2028-2035
Foreign exchange volatility affecting cross-border transaction costs restraint -0.4% Latin America, Middle East & Africa 2028-2035
Source: Next Move Strategy Consulting

Growth Drivers

What Is the Primary Growth Driver of the B2B Payments Market?

Expanding real-time payment infrastructure adoption is the primary driver of the market. The Federal Reserve's FedNow Service continues to expand its participating financial institution network, enabling instant business-to-business fund transfers around the clock. We observed that this infrastructure expansion, reinforced by parallel real-time payment scheme rollouts across Europe and Asia-Pacific, continues to anchor migration away from legacy batch-settlement rails toward instant B2B payment execution.

How Is Accounts Payable Automation Driving B2B Payments Market Growth?

Rising demand for accounts payable and receivable automation is accelerating market growth toward integrated, software-embedded payment execution. Enterprises increasingly favor unified platforms that combine invoice processing with payment initiation over standalone banking portals. Our assessment indicates that this automation shift, combined with rising small and medium enterprise digital adoption, is compressing reliance on manual check-based disbursement relative to automated electronic payment workflows.

Growth Inhibitors

What Is Restraining B2B Payments Market Expansion?

Data-security and fraud-prevention compliance burden restrains market expansion, particularly for smaller payment providers. The U.S. Federal Trade Commission continues to enforce data-security requirements applicable to financial technology platforms handling business payment data. We found that smaller fintech providers face particular exposure, as limited compliance budgets reduce their ability to match the security certifications maintained by larger, well-capitalized banks and payment processors.

What Are the Growth Opportunities?

How Can Real-Time Payment Rails Unlock Growth Among Fintech Providers?

Real-time payment infrastructure presents a whitespace opportunity for fintech providers seeking to displace legacy batch-settlement rails. Companies that build scalable, API-accessible instant payment capability stand to capture recurring transaction revenue as enterprises increasingly demand immediate fund availability for time-sensitive supplier and payroll disbursements.

Where Does Small and Medium Enterprise Adoption Create New Demand?

Small and medium enterprises represent an underpenetrated opportunity as this segment grows at a 12.8% CAGR through 2035. Providers that package accounts payable and receivable automation into simplified, low-configuration platforms can capture recurring subscription revenue from a large, currently underserved customer base that lacks dedicated treasury staff.

How Can Cross-Border Payment Transparency Accelerate Emerging Market Access?

Emerging market enterprises seeking transparent, cost-effective international settlement represent a growing opportunity for cross-border payment specialists. Providers that develop compliant, jurisdiction-specific correspondent banking alternatives can capture recurring transaction revenue as businesses in Latin America and Asia-Pacific increasingly digitize supplier payment relationships previously dependent on costly traditional wire networks.

Segmentation Analysis

2025 (USD Billion)
2035 (USD Billion)
Domestic Pay
Cross-Border
Segment Item 2025 (USD Billion) 2035 (USD Billion) CAGR
Domestic Payments $10.0 USD Billion $40.0 USD Billion 22.0%
Cross-Border Payments $17.1 USD Billion $51.1 USD Billion 24.0%

Segment-wise data not detailed in this view

Unlock complete segment-wise numbers for By Payment Type.

Unlock Full Data

Domestic Payments held the largest share of approximately 68% (USD 98.60 billion) in 2025; Cross-Border Payments is the fastest-growing sub-segment at 13.8% CAGR from 2026–2035.

2025 (USD Billion)
2035 (USD Billion)
Wire Transfe
ACH and Bank
Virtual Card
Digital Wall
Real-Time Pa
Segment Item 2025 (USD Billion) 2035 (USD Billion) CAGR
Wire Transfer $10.0 USD Billion $40.0 USD Billion 20.0%
ACH and Bank Transfer $17.1 USD Billion $51.1 USD Billion 10.0%
Virtual Cards $24.2 USD Billion $62.2 USD Billion 12.0%
Digital Wallets $31.3 USD Billion $73.3 USD Billion 26.0%
Real-Time Payments $38.4 USD Billion $84.4 USD Billion 17.0%

Segment-wise data is locked

Unlock complete segment-wise numbers for By Payment Method.

Unlock Full Data

Which Payment Method Segment Dominates the B2B Payments Market?

Wire Transfer led the market with USD 39.15 billion in 2025, supported by its established role in high-value domestic and cross-border business transactions requiring same-day settlement certainty. We observed that Real-Time Payments is the fastest-growing payment method, expanding at an 18.4% CAGR from 2026 to 2035, as enterprises increasingly adopt instant payment rails for time-sensitive supplier and vendor disbursements.

2025 (USD Billion)
2035 (USD Billion)
Large Enterp
Small and Me
Segment Item 2025 (USD Billion) 2035 (USD Billion) CAGR
Large Enterprises $10.0 USD Billion $40.0 USD Billion 27.0%
Small and Medium Enterprises $17.1 USD Billion $51.1 USD Billion 9.0%

Segment-wise data is locked

Unlock complete segment-wise numbers for By Enterprise Size.

Unlock Full Data

Large Enterprises held the largest share of approximately 61% (USD 88.45 billion) in 2025; Small and Medium Enterprises is the fastest-growing sub-segment at 12.8% CAGR from 2026–2035.

2025 (USD Billion)
2035 (USD Billion)
Cloud
On-Premise
Segment Item 2025 (USD Billion) 2035 (USD Billion) CAGR
Cloud $10.0 USD Billion $40.0 USD Billion 9.0%
On-Premise $17.1 USD Billion $51.1 USD Billion 23.0%

Segment-wise data is locked

Unlock complete segment-wise numbers for By Deployment Mode.

Unlock Full Data

Cloud held the largest share of approximately 72% (USD 104.40 billion) in 2025 and is also the fastest-growing sub-segment at 12.9% CAGR from 2026–2035.

2025 (USD Billion)
2035 (USD Billion)
Accounts Pay
Accounts Rec
Supply Chain
Payroll and
Other Applic
Segment Item 2025 (USD Billion) 2035 (USD Billion) CAGR
Accounts Payable $10.0 USD Billion $40.0 USD Billion 18.0%
Accounts Receivable $17.1 USD Billion $51.1 USD Billion 16.0%
Supply Chain Payments $24.2 USD Billion $62.2 USD Billion 22.0%
Payroll and Vendor Payments $31.3 USD Billion $73.3 USD Billion 12.0%
Other Application $38.4 USD Billion $84.4 USD Billion 19.0%

Segment-wise data is locked

Unlock complete segment-wise numbers for By Application.

Unlock Full Data

Which Application Leads the B2B Payments Market?

Accounts Payable remained the dominant application, reaching USD 46.40 billion in 2025 due to sustained enterprise demand for automated supplier disbursement and invoice-to-pay workflows. Based on research conducted by NMSC, we found that Supply Chain Payments is the fastest-growing application at a 12.7% CAGR from 2026 to 2035, reflecting rising adoption of virtual card and dynamic discounting programs across multi-tier supplier networks.

2025 (USD Billion)
2035 (USD Billion)
BFSI
Manufacturin
Retail and C
Healthcare
IT and Telec
Segment Item 2025 (USD Billion) 2035 (USD Billion) CAGR
BFSI $10.0 USD Billion $40.0 USD Billion 20.0%
Manufacturing $17.1 USD Billion $51.1 USD Billion 18.0%
Retail and Consumer Goods $24.2 USD Billion $62.2 USD Billion 12.0%
Healthcare $31.3 USD Billion $73.3 USD Billion 22.0%
IT and Telecom $38.4 USD Billion $84.4 USD Billion 25.0%

Segment-wise data is locked

Unlock complete segment-wise numbers for By End-Use Industry.

Unlock Full Data

Which End-Use Industry Leads B2B Payments Market Demand?

BFSI remained the leading end-use industry within the market, valued at USD 30.45 billion in 2025 on sustained institutional payment processing and correspondent banking activity. Our findings suggest that Construction is the fastest-growing end-use industry, registering a 12.5% CAGR from 2026 to 2035, as contractors and subcontractors increasingly adopt digital payment platforms to manage complex multi-party project disbursements.

2025 (USD Billion)
2035 (USD Billion)
Banks
Payment Proc
Card Network
Segment Item 2025 (USD Billion) 2035 (USD Billion) CAGR
Banks $10.0 USD Billion $40.0 USD Billion 22.0%
Payment Processors and Fintech Providers $17.1 USD Billion $51.1 USD Billion 24.0%
Card Networks $24.2 USD Billion $62.2 USD Billion 14.0%

Segment-wise data is locked

Unlock complete segment-wise numbers for By Provider Type.

Unlock Full Data

Banks held the largest share of approximately 47% (USD 68.15 billion) in 2025; Payment Processors and Fintech Providers is the fastest-growing sub-segment at 12.9% CAGR from 2026–2035.

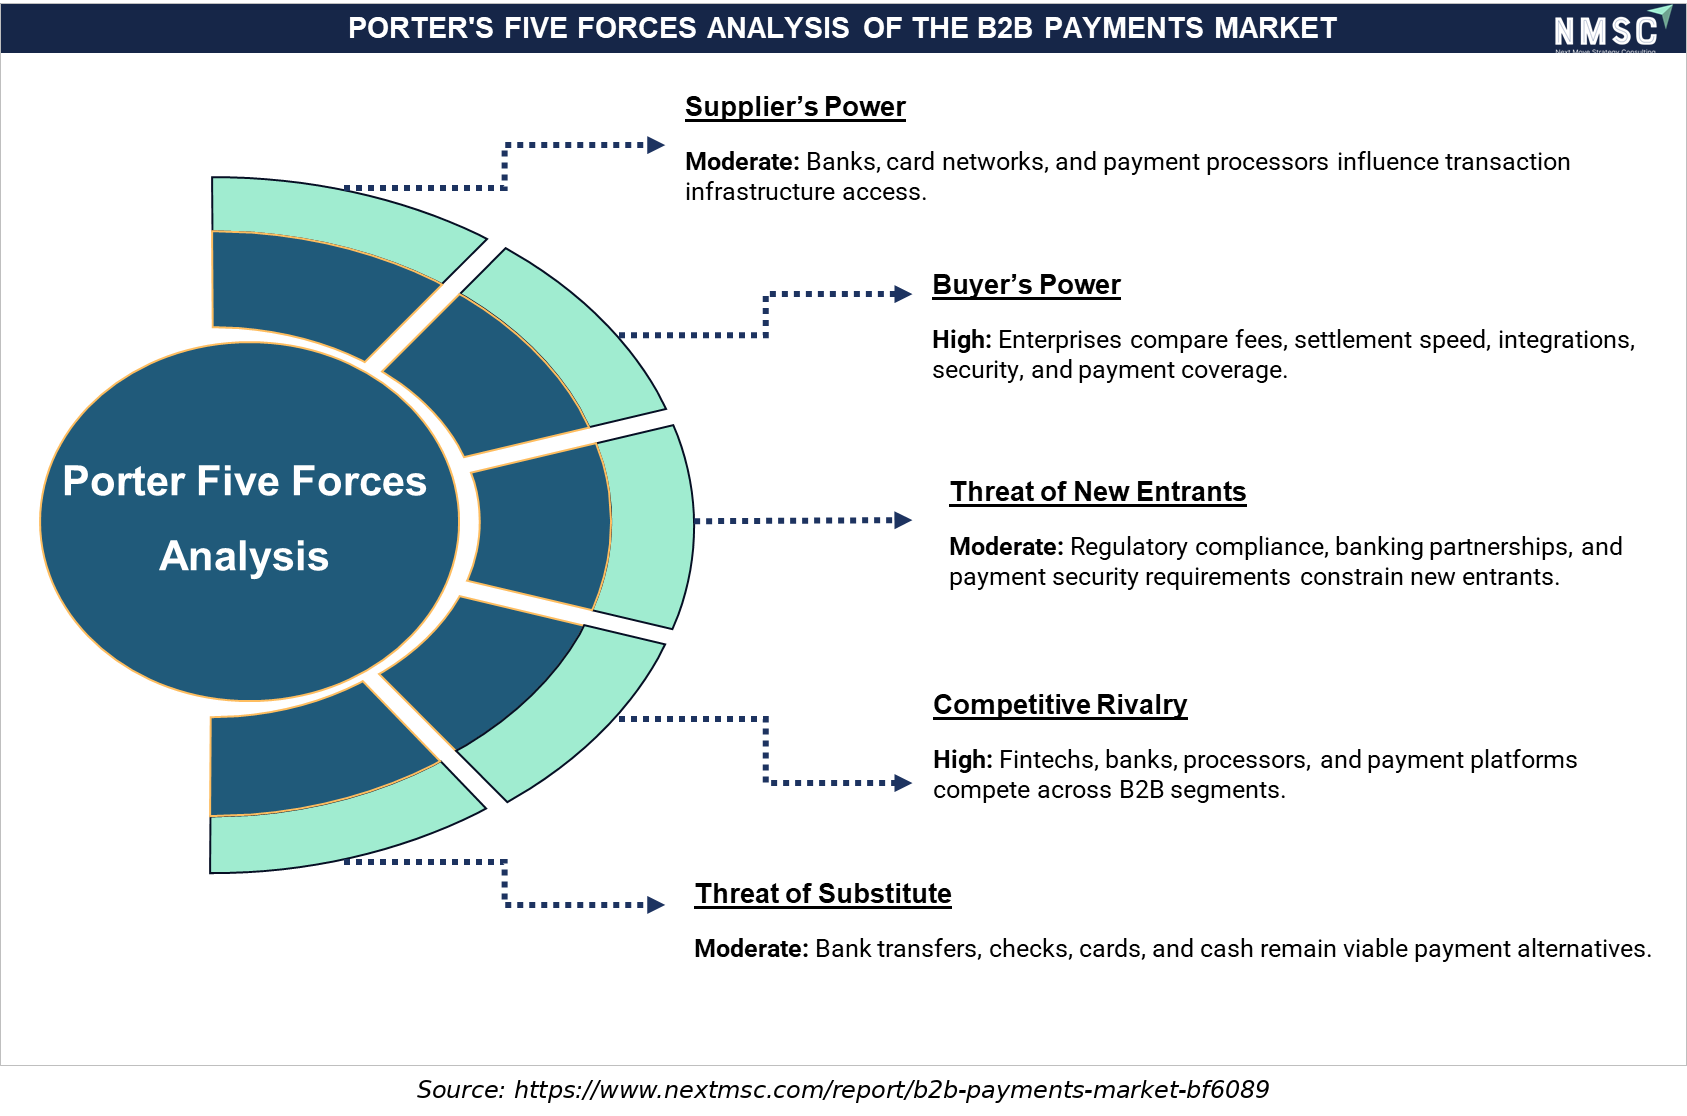
Porter’s Five Forces Analysis of the B2B Payments Market
The B2B payments market is shaped by competitive rivalry, evolving customer requirements, technological innovation, and the influence of financial institutions and payment providers. An evidence-based Porter’s Five Forces assessment helps stakeholders evaluate supplier and buyer power, competitive pressures, substitution risks, barriers to entry, and the factors influencing long-term market positioning.

Growth Opportunities

Our analysis shows that three forward-looking opportunities stand out for stakeholders positioning within the B2B payments market over the 2026-2035 forecast period.

How Can Real-Time Payment Rails Unlock Growth Among Fintech Providers?

Real-time payment infrastructure presents a whitespace opportunity for fintech providers seeking to displace legacy batch-settlement rails. Companies that build scalable, API-accessible instant payment capability stand to capture recurring transaction revenue as enterprises increasingly demand immediate fund availability for time-sensitive supplier and payroll disbursements.

Where Does Small and Medium Enterprise Adoption Create New Demand?

Small and medium enterprises represent an underpenetrated opportunity as this segment grows at a 12.8% CAGR through 2035. Providers that package accounts payable and receivable automation into simplified, low-configuration platforms can capture recurring subscription revenue from a large, currently underserved customer base that lacks dedicated treasury staff.

How Can Cross-Border Payment Transparency Accelerate Emerging Market Access?

Emerging market enterprises seeking transparent, cost-effective international settlement represent a growing opportunity for cross-border payment specialists. Providers that develop compliant, jurisdiction-specific correspondent banking alternatives can capture recurring transaction revenue as businesses in Latin America and Asia-Pacific increasingly digitize supplier payment relationships previously dependent on costly traditional wire networks.

Regional Outlook

2025 (USD Billion)
2035 (USD Billion)
North Americ
Europe
Asia-Pacific
Middle East
Latin Americ
Region 2025 (USD Billion) 2035 (USD Billion) CAGR (%)
North America $10.0 USD Billion $40.0 USD Billion 9.0%
Europe $17.1 USD Billion $51.1 USD Billion 27.0%
Asia-Pacific $24.2 USD Billion $62.2 USD Billion 25.0%
Middle East & Africa $31.3 USD Billion $73.3 USD Billion 23.0%
Latin America $38.4 USD Billion $84.4 USD Billion 12.0%

Regional data is locked

Unlock complete regional numbers for this market.

Unlock Full Data

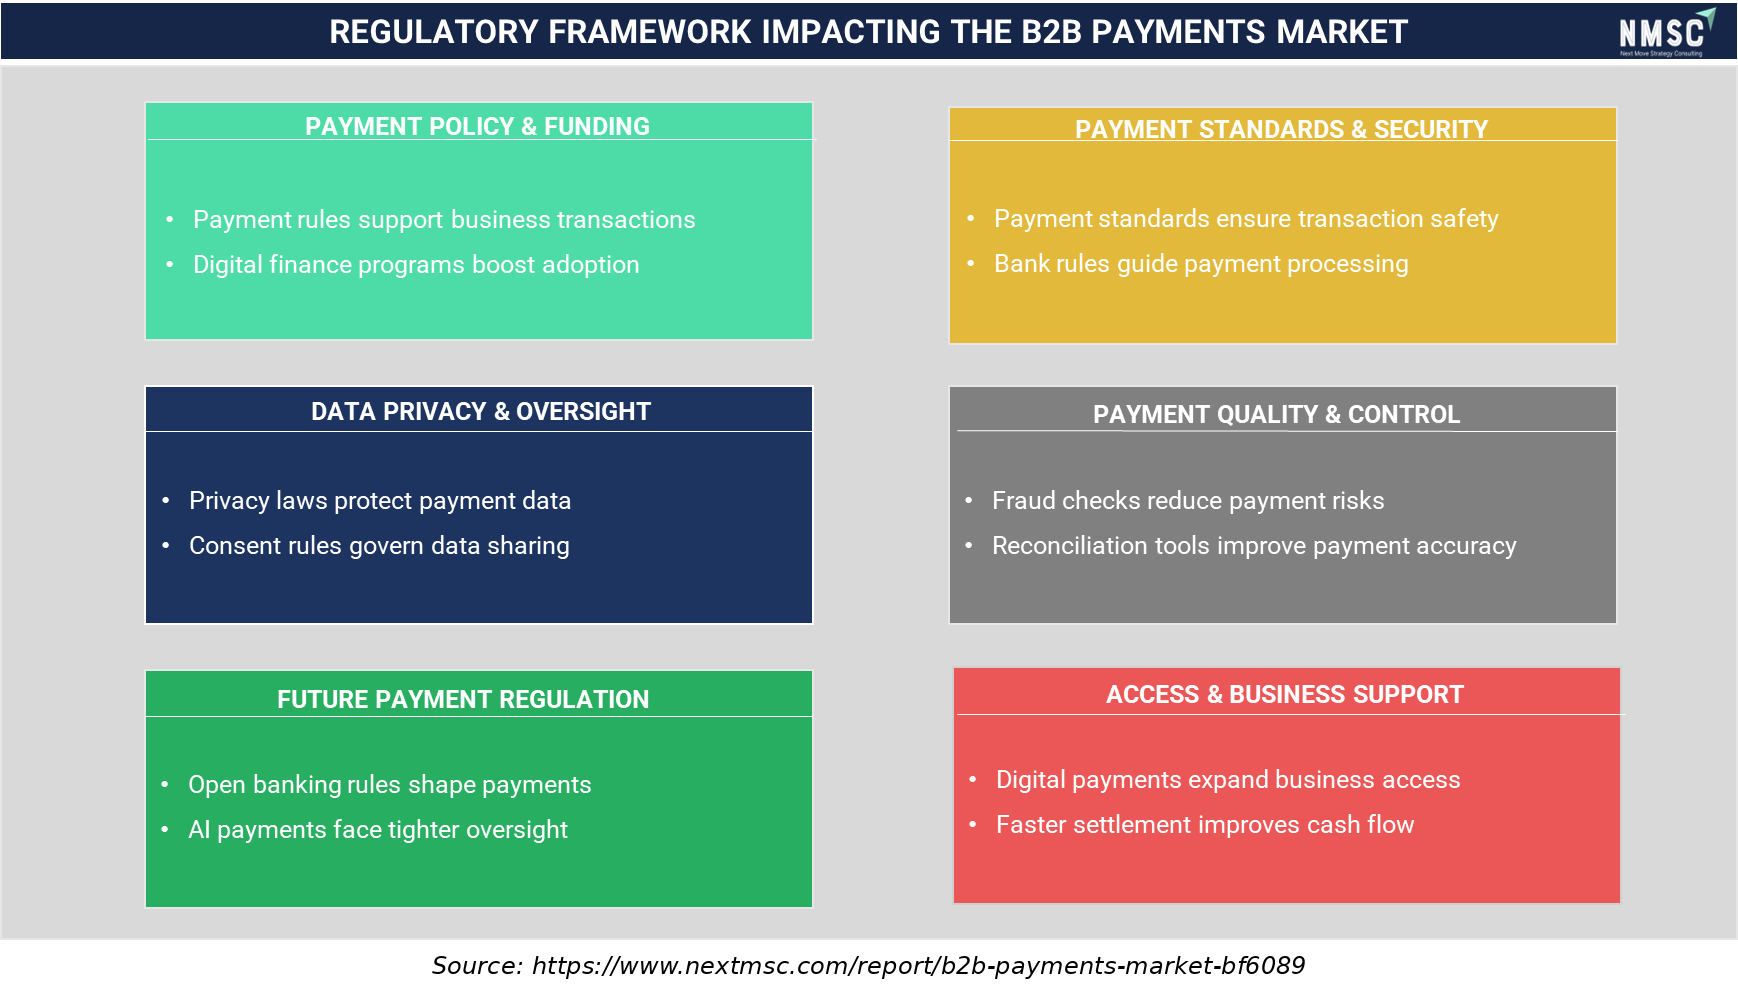
Regulatory Framework Impacting the B2B Payments Market

Regulatory frameworks play an important role in shaping the B2B payments market, particularly regarding transaction security, data privacy, fraud prevention, and financial compliance. Payment providers must adapt to evolving banking standards, oversight requirements, and digital payment regulations. These factors influence market access, technology development, operational practices, and the adoption of secure and efficient payment solutions.

Competitive Landscape

We observed that the B2B payments market features a moderately consolidated competitive landscape, with global card networks and major banks competing alongside fintech disruptors on integration depth, real-time payment capability, and enterprise workflow automation. Key Takeaways

Dimension Description
Market Structure Moderately consolidated; the top companies profiled in this report collectively account for a significant share of global B2B payments market revenue, while numerous regional fintech providers serve specialized niches and underserved enterprise segments.
Innovation Focus Real-time payment rails, embedded finance integration, virtual card issuance, and API-based payment orchestration dominate current innovation pipelines across leading providers.
M&A Activity Selective consolidation and strategic partnership activity, exemplified by card networks and payment processors collaborating to extend business payment services across shared enterprise customer bases.

How Do Companies Compete in the B2B Payments Market?

Companies compete primarily on payment rail reach, integration depth with enterprise software, and transaction security credentials across the industry. Global players such as Visa Inc. and Mastercard Incorporated leverage extensive network infrastructure and bank partnerships to serve multinational enterprises, while fintech disruptors such as Stripe, Inc. compete on developer-friendly API integration and faster onboarding for digitally native businesses.

Which Competitive Archetypes Dominate the B2B Payments Market?

Two archetypes dominate the market: established card networks and banks offering trusted, high-volume payment rail infrastructure, and fintech platforms focused on workflow automation and developer-friendly integration. Visa Inc. and J.P. Morgan Chase & Co. exemplify the infrastructure archetype through extensive network reach, while Bill.com Holdings, Inc. and Tipalti Inc. exemplify the automation-focused archetype serving accounts payable and receivable workflows.

How Are Companies Differentiating Through Innovation in B2B Payments?

Innovation and differentiation strategy increasingly center on embedding payment execution directly within enterprise financial workflows rather than offering standalone processing. Mastercard Incorporated's Agent Toolkit and collaboration with Stripe, Inc. to extend Mastercard Track Business Payment Service illustrate how card networks and fintech providers are integrating capabilities to reduce reconciliation friction. Our analysis shows that providers unable to demonstrate credible workflow integration risk losing share to competitors with deeper embedded finance capability.

What M&A and Expansion Activity Is Shaping the B2B Payments Market?

Strategic partnerships and platform integration continue to shape competitive positioning within the industry more than traditional acquisitions. Mastercard Incorporated's collaboration with Stripe, Inc. to bring Mastercard Track Business Payment Service to Stripe's enterprise customer base illustrates how card networks pursue distribution partnerships with fintech platforms, while providers continue expanding cross-border payment corridors to serve growing international trade demand.

Key Market Players

Our assessment indicates that the following 20 companies are actively shaping product innovation, payment rail expansion, and enterprise integration strategy within the global B2B payments market.

Visa Inc. Mastercard Incorporated American Express Company PayPal Holdings, Inc. Fiserv, Inc. Fidelity National Information Services, Inc. J.P. Morgan Chase & Co. Bank of America Corporation Wells Fargo & Company Citigroup Inc. Stripe, Inc. Block, Inc. Adyen N.V. Wise plc Payoneer Global Inc. Bill.com Holdings, Inc. Coupa Software Incorporated Tipalti Inc. Corpay, Inc. WEX Inc.

Latest Developments

We found that recent product launches within the B2B payments market are concentrated on cross-border payment infrastructure and agentic commerce enablement, reflecting the industry's broader shift toward automated, embedded payment execution.

Date Event
July 2026 Mastercard expanded its In Control virtual-card platform with enhanced controls, embedded-partner connectivity and a single API. The platform now supports enterprises, financial institutions and platforms across 43 countries and 174 currencies, strengthening automated supplier payments, reconciliation, transaction controls and global commercial-payment workflows.
June 2026 Adyen launched Adyen Agentic, a modular API suite enabling enterprises to transact through AI platforms without rebuilding commerce infrastructure for each channel. Its Agentic Payments layer specifically addresses payment authorization and execution, opening a new embedded-payment channel as AI agents increasingly conduct transactions on behalf of businesses.
April 2026 Adyen introduced Intelligent Money Movement, connecting enterprise payments, liquidity management and payouts on a single platform. The solution gives businesses real-time visibility into cash positions while simplifying multi-currency fund movements to customers, suppliers and partners, reducing fragmentation across separate payment and treasury infrastructures.

Investment Opportunities

What Capital Inflows Are Targeting the B2B Payments Market?

Capital inflows into the B2B payments market are increasingly directed toward real-time payment infrastructure and agentic commerce enablement. Mastercard Incorporated's Agent Toolkit launch and Stripe, Inc.'s FX Quotes API illustrate sustained product investment behind cross-border and automated payment capability. We observed that investors favor providers demonstrating credible interoperability standards, viewing open-protocol participation as a proxy for long-term platform relevance.

How Is Infrastructure Investment Supporting B2B Payments Delivery?

Infrastructure investment is expanding real-time payment rail capacity and cross-border settlement corridors to support growing enterprise transaction volumes. Our findings suggest that providers are investing in API-based orchestration infrastructure to support seamless integration with enterprise resource planning systems, supporting the scalability required as businesses increasingly demand instant, transparent payment execution.

What ESG Considerations Are Shaping B2B Payments Investment Decisions?

Environmental, social, and governance considerations increasingly shape investment decisions, with data privacy, financial inclusion for small and medium enterprises, and transaction transparency as key criteria. Payment providers increasingly disclose data-security certifications and financial-inclusion program outcomes in governance reporting. We found that investors increasingly favor providers demonstrating measurable financial-inclusion outcomes, treating it as a governance indicator alongside data-privacy compliance.

Key Benefits for Stakeholders

How Does This Report Benefit Enterprise and Industry Leaders?

Enterprise and industry leaders gain access to validated segmentation, competitive benchmarking, and regional demand forecasts that support payment platform sourcing and vendor-selection decisions across the B2B payments industry. Our analysis shows that detailed payment method, application, and end-use industry breakdowns help treasury and finance teams align platform specifications with automation and compliance requirements while identifying underserved payment categories for program expansion.

How Does This Report Benefit Investors and Financial Analysts?

Investors and financial analysts benefit from consistent, single-point market size and CAGR estimates that support valuation and capital-allocation decisions across the B2B payments technology and processing supply chain. We observed that the report's regional and segment-level growth differentials help identify which providers are best positioned to capture above-market growth in real-time payments and small and medium enterprise categories through 2035.

How Does This Report Benefit Technology Vendors and Product Teams?

Technology vendors and product teams gain insight into emerging design requirements, including real-time payment rails, embedded finance integration, and agentic commerce protocols, that are reshaping the industry. Our findings suggest that this analysis helps product roadmap teams prioritize investment around interoperability and workflow-embedded payment capability increasingly required by enterprise procurement processes.

Key Market Segments Evaluated

By Application

  • Accounts Payable
  • Accounts Receivable
  • Supply Chain Payments
  • Payroll and Vendor Payments
  • Other Application
  • BFSI
  • Manufacturing
  • Retail and Consumer Goods
  • Healthcare
  • IT and Telecom
  • Transportation and Logistics
  • Construction
  • Other Industries
  • Banks
  • Payment Processors and Fintech Providers
  • Card Networks
  • North America 
    • U.S.
    • Canada
    • Mexico
  • Europe 
    • UK
    • Germany
    • France
    • Italy
    • Spain
    • Sweden
    • Denmark
    • Finland
    • Netherlands
    • Rest of Europe
  • Asia-Pacific 
    • China
    • India
    • Japan
    • South Korea
    • Taiwan
    • Indonesia
    • Vietnam
    • Australia
    • Philippines
    • Malaysia
    • Rest of APAC
  • Middle East & Africa 
    • Saudi Arabia
    • UAE
    • Egypt
    • Israel
    • Turkey
    • Nigeria
    • South Africa
    • Rest of MEA
  • Latin America 
    • Brazil
    • Argentina
    • Chile
    • Colombia
    • Rest of LATAM

Conclusion & Recommendations

The long-term outlook for the market remains positive, with global revenue projected to more than double from USD 145.0 billion in 2025 to USD 385.0 billion by 2035 at a 10.5% CAGR. We observed that sustained real-time payment infrastructure adoption, accounts payable and receivable automation, and cross-border transaction digitization will continue underpinning growth across large enterprise and small and medium enterprise categories through the forecast period.

What Strategic Positioning Should B2B Payments Providers Pursue?

Providers should prioritize real-time payment capability and embedded finance integration while pursuing interoperability partnerships to secure durable enterprise relationships. Our assessment indicates that providers investing early in API-based orchestration and agentic commerce protocols will be best positioned to capture premium pricing within the B2B payments market.

How Attractive Is the B2B Payments Market for New Investment?

The B2B payments industry presents an attractive investment case, supported by a USD 228.0 billion absolute dollar opportunity between 2026 and 2035 and above-average growth in Latin America and real-time payment technology categories. We found that investment attractiveness is highest for providers combining established payment rail infrastructure with embedded finance capability, positioning them to serve both large enterprise and small and medium enterprise segments simultaneously.

What Market Shifts and Key Risks Should Stakeholders Monitor?

Stakeholders should monitor data-security compliance burden, legacy banking infrastructure limitations, and payment rail interoperability challenges as key risks to the B2B payments market. Our analysis shows that providers unable to demonstrate credible security certifications and workflow integration risk losing enterprise contracts to competitors with more comprehensive embedded finance platforms, particularly within increasingly regulated markets.

What Are the Key Growth Pathways for the B2B Payments Market?

Key growth pathways include expanding real-time payment rail capability, scaling cross-border payment transparency, and deepening penetration into small and medium enterprise and virtual card categories. NMSC's analysis indicates that providers pursuing these pathways while maintaining reliability in core wire transfer and ACH categories will be best positioned to capture the B2B payments market's projected growth through 2035.

FAQs

About the Author

Mihul Sharma

Mihul Sharma

Mihul Sharma is Research Associate at Next Move Strategy Consulting, where he has covered technology, industrial, and healthcare markets for 3 years. His work applies structured business research, market analysis, and secondary-source review to assess market trends, competitive developments, and growth opportunities. He supports report development by fully synthesizing industry data, company information, and market signals into concise findings for strategy and investment-focused research teams.

About the Reviewer

Supradip Baul

Supradip Baul

Supradip Baul is an accomplished business consultant and strategist with over a decade of rich experience in market intelligence, strategy, technology, and business transformation. His work has included rigorous qualitative and quantitative analysis across multiple industries, helping clients shape investment decisions and long-term roadmaps. Earlier in his career, he was associated with Gartner, where he contributed to industry-leading reports and market share analyses. He has worked with leading global companies and holds an MBA with a dual specialization in Marketing and Finance.

Download Free Sample

Pratyush Kumar Das

PRATYUSH KUMAR DAS

Assistant Manager

Polycab India Limited

We would like to express our appreciation for the data and insights provided by nextmsc. We are very pleased with the quality and depth of the information, which has proven to be highly valuable and beneficial for our business decision-making.

Robert Sean Trevino

ROBERT SEAN TREVINO

Sr. Director, Head of Strategic Insights & Analytics

Foundation Medicine

I realized that it was a reliable source of information. These days, there are many people who are looking for authentic data, and this is one of the only sources that can offer them with what they need;

Nishant Awate

NISHANT AWATE

Business Development Global Sales

Zehnder Group Deutschland GmbH

Our experience working with Next Move Strategy Consulting was positive. The team was responsive, professional, and open to incorporating our specific requirements throughout the project. The India AHU market study was comprehensive and well structured, covering market value and volume forecasts, product and application segments, and key industry trends. The inclusion of both AHU and residential MVHR market insights made the study particularly relevant for our strategic market assessment. Overall, the report provides a solid foundation for evaluating market potential, identifying priority segments, and supporting business-development decisions in India.

Kevin Coker

KEVIN COKER

Founder, CEO and Board Diector

Proxima Clinical Research

I have been using Next MSC reports for product positioning in a new geography for a long time. They have by far the best reports I have found and the price is reasonable too!

Diana Trejo

DIANA TREJO

Assistant Manager

Sumitomo Corporation de Mexico, S.A. de C.V.

Recently, we purchased a report on the Mexico Data Center Market from Next Move Strategy Consulting. The service has been excellent, with support that is always timely and thoroughly professional. The information provided is interesting, highly useful, and delivered with clarity. I would highly recommend NextMSC for anyone seeking insightful and dependable analysis.

Custom Market Research Services

We will customize the research for you if the listed report does not fully match your requirements.

Get 30% Free Customization

Select License

This website uses cookies to ensure you get the best experience on our website. Learn more

✖