Ball Valves Market Global Industry Analysis and Forecast (2026–2035)

Ball Valves Market Size was USD 15.26 Billion in 2025, projected to reach USD 24.04 Billion by 2035, growing at a CAGR of 4.65% from 2026 to 2035. Key drivers include pipeline and process infrastructure expansion, municipal water network replacement, and industrial process automation, with North America leading the global market.

Download Free Sample PDF
Base Year (2025)
$15.26 Billion
Forecast (2035)
$24.04 Billion
CAGR (2026-2035)
4.7%
Top Region
North America

What Is the Ball Valves Market Size?

The global ball valves market reached USD 15.26 Billion in 2025 and is estimated at USD 15.97 Billion in 2026, forecast to reach USD 24.04 Billion by 2035 at a CAGR of 4.65% between 2026 and 2035. North America leads with approximately 34% revenue share in 2025, while Floating Ball is the dominant valve design, holding approximately 33% of total market revenue.

We observed that material science is reshaping the competitive landscape as producers move beyond conventional carbon steel toward duplex stainless steel, super austenitic alloys, and high-performance polymers such as PTFE and PEEK seats. These material choices extend service life in corrosive and high-temperature environments. Operational scale is also increasing, since larger pipeline diameters and expanded district heating and industrial utility networks require valves that can handle higher pressure classes while maintaining leak-tight performance over long maintenance intervals.

Ball Valves Market Global Industry Analysis and Forecast (2026–2035) Revenue Forecast

Values in USD Billion

2025 $15.26 Billion
2025
2026 $15.97 Billion
2026
2027 $16.71 Billion
2027
2028 $17.49 Billion
2028
2029 $18.30 Billion
2029
2030 $19.15 Billion
2030
2031 $20.04 Billion
2031
2032 $20.98 Billion
2032
2033 $21.95 Billion
2033
2034 $22.97 Billion
2034
2035 $24.04 Billion
2035

Key Takeaways

By Valve Design: Floating ball held the largest share, expanding from USD 4.97 Billion in 2025 to USD 7.37 Billion by 2035; Other Designs is the fastest-growing at 6.01% CAGR from 2026–2035.

By Body Material: Carbon Steel held the largest share, expanding from USD 4.3 Billion in 2025 to USD 6.6 Billion by 2035; Other Materials is the fastest-growing at 6.48% CAGR from 2026–2035.

By Valve Size: Up to DN50 held the largest share, expanding from USD 5.38 Billion in 2025 to USD 7.69 Billion by 2035; DN350–DN600 is the fastest-growing at 6% CAGR from 2026–2035.

By Pressure Rating: Up to 20 Bar held the largest share, expanding from USD 5.05 Billion in 2025 to USD 7.33 Billion by 2035; Above 250 Bar is the fastest-growing at 5.97% CAGR from 2026–2035.

Dominant Region: North America dominated the market with approximately 34% revenue share (USD 5.19 Billion) in 2025, anchored by mature pipeline networks, refinery modernization, and municipal water replacement programs.

Fastest-Growing Region: Asia-Pacific is expected to register the highest CAGR of 7.72% during 2026–2035, driven by petrochemical capacity additions, urban water network expansion, and large public infrastructure programs.

Dominant Country: The U.S. led the market with an estimated USD 3.94 Billion in 2025 (~76% of North America), supported by extensive pipeline and process plant infrastructure, refinery maintenance, and water utility rehabilitation.

Fastest-Growing Country: India is among the fastest-growing major country markets, with revenue projected to increase from USD 0.86 Billion in 2026 to USD 1.95 Billion by 2035, representing a CAGR of approximately 9.52% over 2026–2035, driven by urban water supply schemes, refinery capacity additions, and fertilizer plant upgrades.

Our analysis indicates an absolute dollar opportunity of USD 8.07 Billion between 2026 and 2035 for ball valves, measured as the increment from USD 15.97 Billion to USD 24.04 Billion. Much of this incremental value will originate from replacement cycles in aging water and wastewater networks, expansion of petrochemical and refining capacity, and the build-out of [hydrogen](https: //www.nextmsc.com/report/hydrogen-market) and LNG handling infrastructure. Suppliers able to meet demanding pressure and temperature ratings will be best positioned to capture this expansion across multiple industrial verticals.

Competitive consolidation in ball valves is progressing as larger industrial flow control groups acquire specialized valve manufacturers to broaden product portfolios and regional reach. OEM partnerships with actuator and instrumentation providers are becoming standard, allowing integrated packages to be supplied to project developers. Supply chain scale matters considerably, since foundry capacity, forging access, and certified machining centers favor established producers that can guarantee consistent delivery timelines and traceable material documentation for critical installations.

Ecosystem Analysis of the Ball Valves Industry

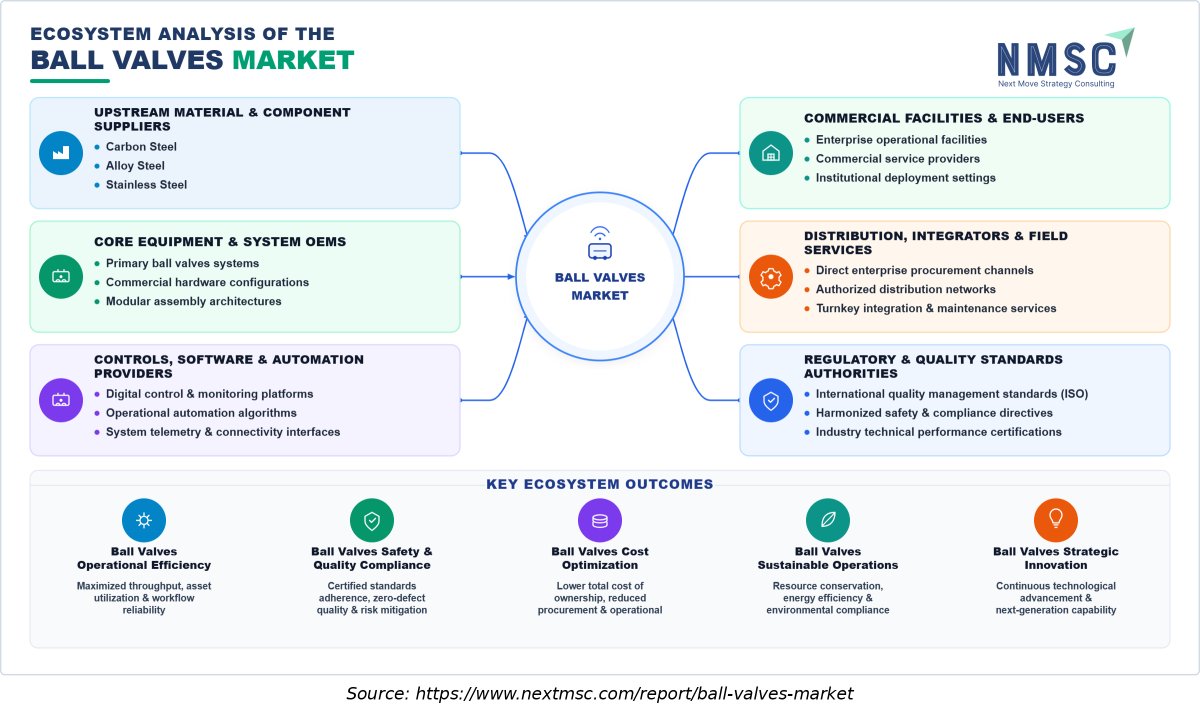
The above infographic presents the ball valves market ecosystem across six core stakeholder groups: upstream material and component suppliers; core equipment and system OEMs; controls, software, and automation providers; commercial facilities and end-users; distribution, integrators, and field services; and regulatory and quality standards authorities. It shows how these participants support operations while contributing to operational efficiency, safety, cost optimization, sustainability, and technological innovation across diverse operating environments.

What Does the Ball Valves Market Encompass?

The ball valves market encompasses floating-ball, trunnion-mounted, segmented, and rising-stem designs, along with full-bore, reduced-bore, and V-port configurations primarily used for on-off isolation, with specialized designs also supporting throttling and flow-control applications. Product types extend across manual lever- and gear-operated units as well as pneumatic-, electric-, and hydraulic-actuated assemblies. Core technologies include metal-seated and soft-seated sealing systems, fire-safe constructions, cryogenic extensions, and double-block-and-bleed arrangements that support isolation requirements in hazardous process lines.

Ball valve specifications may reference API Spec 6D for pipeline and piping valves, API Standard 608 for metal ball valves, ASME B16.34 for pressure-temperature ratings and construction requirements, and ISO 17292 for metal ball valves used in petroleum, petrochemical, and allied industries. Material innovations focus on duplex and super duplex stainless steels, Inconel and Hastelloy for severe corrosion, and engineered thermoplastic seats that maintain sealing at elevated temperatures. Depending on the application, relevant compliance requirements may include API 607 fire testing, ATEX conformity for equipment used in potentially explosive atmospheres, and ISO 15156 (NACE MR0175) material requirements for sour-service applications.

Market Drivers & Dynamics

Interactive Dataset
Pipeline and Process Infrastructure Expansion driver High Oil, gas, and petrochemical projects require high integrity ball valves for isolation and shutoff duties Immediate
Municipal Water Network Replacement driver High Global (North America, Europe, Asia-Pacific): Aging distribution networks drive replacement of legacy valves with quarter-turn ball designs. Immediate
Industrial Process Automation driver Medium Actuated ball valves support remote control and automated process sequencing in plants Medium-term
Raw Material Price Volatility restraint High Fluctuating costs of stainless steel and nickel alloys pressure manufacturer margins Immediate
Competition from Alternative Valve Types restraint Medium Butterfly and globe valves compete in certain sizing and throttling applications Medium-term
Skilled Installation and Maintenance Shortages restraint Low Limited trained technicians can slow actuator commissioning and seat replacement work Long-term
Source: Next Move Strategy Consulting

Growth Drivers

What Is the Primary Growth Driver in the Ball Valves Market?

The primary catalyst for ball valves is the sustained build-out of energy, water, and process infrastructure that demands reliable isolation at scale. Refinery upgrades, LNG terminals, and hydrogen handling facilities often require quarter-turn ball valves where their operating conditions and isolation requirements make them suitable. Municipal utilities are simultaneously replacing corroded legacy assets, creating a steady installation base that supports the projected expansion to USD 24.04 billion by 2035.

How Are Industry Standards and Directives Driving the Market?

Regulatory frameworks increasingly determine which ball valves can enter critical installations. API 6D and API 608 govern pipeline and metal valve design, while ISO 15848 sets fugitive emission testing requirements that favor low leakage seat designs. Pressure equipment directives in Europe and ATEX requirements for explosive atmospheres further compel manufacturers to document certified performance, shaping procurement decisions across regulated industrial sectors.

Growth Inhibitors

What Is Restraining the Ball Valves Market?

The principal commercial restraint is volatility in the cost of stainless steel, duplex alloys, and nickel-based materials that form valve bodies and trim. Forging and casting capacity is concentrated among a limited number of qualified foundries, which can extend lead times during periods of heavy infrastructure spending. Manufacturers absorbing these input swings often face margin pressure, prompting cautious pricing strategies in competitive tender processes.

What Are the Growth Opportunities?

Can Subsea and Offshore Hydrocarbon Systems Capture High-Density Deployments?

Offshore platforms and subsea tiebacks require ball valves rated for extreme pressure, corrosive produced fluids, and remote actuation. Operators are seeking compact trunnion designs with validated fire safe and fugitive emission performance for these confined installations. Suppliers qualifying materials to demanding offshore standards can secure long term service agreements tied to field development programs in deepwater basins.

How Is Mid-Tier and Regional Facility Adoption Unlocking New Ball Valves Market Volume?

Regional water utilities, district heating networks, and mid-sized chemical plants represent a broad base of buyers seeking dependable valves without premium specifications. Standardized ball valve families with simplified actuator mounting let these facilities upgrade isolation points incrementally. Distributors serving these regional hubs play an important role by stocking common sizes and providing rapid field support for smaller operators.

Can Specialized Vertical Implementations Become Distinct Premium Ball Valves Market?

Hydrogen service, cryogenic LNG handling, and high purity pharmaceutical utilities each demand ball valves with specialized sealing and surface finishes. These niches command premium pricing because qualification testing and material traceability are rigorous. Manufacturers developing application specific seat chemistries and certified cryogenic extensions can establish distinct positions within these high value segments.

Segmentation Analysis

2025 (USD Billion)
2035 (USD Billion)
Floating Ball 2025: $4.97 Billion | 2035: $5.20 Billion
Floating Bal
Trunnion-Mounted Ball 2025: $3.65 Billion | 2035: $3.82 Billion
Trunnion-Mou
Segmented Ball 2025: $2.76 Billion | 2035: $2.89 Billion
Segmented Ba
Rising-Stem Ball 2025: $2.18 Billion | 2035: $2.28 Billion
Rising-Stem
Other Designs 2025: $1.70 Billion | 2035: $1.78 Billion
Other Design
Floating Ball $4.97 Billion $5.20 Billion USD 7.37 Billion
Trunnion-Mounted Ball $3.65 Billion $3.82 Billion USD 5.6 Billion
Segmented Ball $2.76 Billion $2.89 Billion USD 4.4 Billion
Rising-Stem Ball $2.18 Billion $2.28 Billion USD 3.66 Billion
Other Designs $1.70 Billion $1.78 Billion USD 3.01 Billion

Which Valve Design Segment Dominates the Ball Valves Market?

The installed base of process plants, pipelines, and building services forms the capital equipment foundation for ball valves, and Floating ball designs anchor this base with approximately 33% share, valued at USD 4.97 billion in 2025. Their simple seat-supported architecture suits general-purpose isolation duty, which keeps procurement volumes high across utilities and manufacturing. Meanwhile, Other Designs advance at a 6.01% CAGR through 2035, reflecting specialized configurations that serve niche operating conditions and replacement cycles. The gap between these two trajectories shows how mature design families sustain revenue while specialized variants capture incremental demand.

2025 (USD Billion)
2035 (USD Billion)
Carbon Steel
Alloy Steel
Stainless St
Duplex Steel
Cast Iron
Segment Item 2025 (USD Billion) 2035 (USD Billion) CAGR
Carbon Steel $10.0 USD Billion $40.0 USD Billion 9.0%
Alloy Steel $17.1 USD Billion $51.1 USD Billion 11.0%
Stainless Steel $24.2 USD Billion $62.2 USD Billion 25.0%
Duplex Steel $31.3 USD Billion $73.3 USD Billion 27.0%
Cast Iron $38.4 USD Billion $84.4 USD Billion 24.0%

Segment-wise data is locked

Unlock complete segment-wise numbers for By Body Material.

Unlock Full Data
2025 (USD Billion)
2035 (USD Billion)
Up to 20 Bar
Above 20–50
Above 50–100
Above 100–25
Above 250 Ba
Segment Item 2025 (USD Billion) 2035 (USD Billion) CAGR
Up to 20 Bar $10.0 USD Billion $40.0 USD Billion 25.0%
Above 20–50 Bar $17.1 USD Billion $51.1 USD Billion 23.0%
Above 50–100 Bar $24.2 USD Billion $62.2 USD Billion 9.0%
Above 100–250 Bar $31.3 USD Billion $73.3 USD Billion 11.0%
Above 250 Bar $38.4 USD Billion $84.4 USD Billion 16.0%

Segment-wise data is locked

Unlock complete segment-wise numbers for By Pressure Rating.

Unlock Full Data
2025 (USD Billion)
2035 (USD Billion)
Up to DN50
DN65–DN150
DN200–DN300
DN350–DN600
Above DN600
Segment Item 2025 (USD Billion) 2035 (USD Billion) CAGR
Up to DN50 $10.0 USD Billion $40.0 USD Billion 10.0%
DN65–DN150 $17.1 USD Billion $51.1 USD Billion 24.0%
DN200–DN300 $24.2 USD Billion $62.2 USD Billion 26.0%
DN350–DN600 $31.3 USD Billion $73.3 USD Billion 8.0%
Above DN600 $38.4 USD Billion $84.4 USD Billion 11.0%

Segment-wise data is locked

Unlock complete segment-wise numbers for By Size.

Unlock Full Data
2025 (USD Billion)
2035 (USD Billion)
Full Bore
Reduced Bore
V-Port
Other Port D
Segment Item 2025 (USD Billion) 2035 (USD Billion) CAGR
Full Bore $10.0 USD Billion $40.0 USD Billion 14.0%
Reduced Bore $17.1 USD Billion $51.1 USD Billion 8.0%
V-Port $24.2 USD Billion $62.2 USD Billion 10.0%
Other Port Designs $31.3 USD Billion $73.3 USD Billion 16.0%

Segment-wise data is locked

Unlock complete segment-wise numbers for By Port Design.

Unlock Full Data
2025 (USD Billion)
2035 (USD Billion)
Two-Way
Three-Way
Four-Way and
Segment Item 2025 (USD Billion) 2035 (USD Billion) CAGR
Two-Way $10.0 USD Billion $40.0 USD Billion 27.0%
Three-Way $17.1 USD Billion $51.1 USD Billion 21.0%
Four-Way and Above $24.2 USD Billion $62.2 USD Billion 15.0%

Segment-wise data is locked

Unlock complete segment-wise numbers for By Flow Configuration.

Unlock Full Data
2025 (USD Billion)
2035 (USD Billion)
Manual
Pneumatic
Electric
Hydraulic
Other Actuat
Segment Item 2025 (USD Billion) 2035 (USD Billion) CAGR
Manual $10.0 USD Billion $40.0 USD Billion 18.0%
Pneumatic $17.1 USD Billion $51.1 USD Billion 24.0%
Electric $24.2 USD Billion $62.2 USD Billion 14.0%
Hydraulic $31.3 USD Billion $73.3 USD Billion 8.0%
Other Actuation $38.4 USD Billion $84.4 USD Billion 15.0%

Segment-wise data is locked

Unlock complete segment-wise numbers for By Actuation.

Unlock Full Data
2025 (USD Billion)
2035 (USD Billion)
Flanged
Threaded
Butt Weld
Socket Weld
Compression
Segment Item 2025 (USD Billion) 2035 (USD Billion) CAGR
Flanged $10.0 USD Billion $40.0 USD Billion 16.0%
Threaded $17.1 USD Billion $51.1 USD Billion 10.0%
Butt Weld $24.2 USD Billion $62.2 USD Billion 20.0%
Socket Weld $31.3 USD Billion $73.3 USD Billion 22.0%
Compression $38.4 USD Billion $84.4 USD Billion 25.0%

Segment-wise data is locked

Unlock complete segment-wise numbers for By End Connection.

Unlock Full Data
2025 (USD Billion)
2035 (USD Billion)
Direct Sales
Distributors
Agents and R
E-Commerce
Segment Item 2025 (USD Billion) 2035 (USD Billion) CAGR
Direct Sales $10.0 USD Billion $40.0 USD Billion 24.0%
Distributors $17.1 USD Billion $51.1 USD Billion 10.0%
Agents and Representatives $24.2 USD Billion $62.2 USD Billion 8.0%
E-Commerce $31.3 USD Billion $73.3 USD Billion 14.0%

Segment-wise data is locked

Unlock complete segment-wise numbers for By Sales Channel.

Unlock Full Data
2025 (USD Billion)
2035 (USD Billion)
Oil and Gas
Upstream
Midstream
Downstream
Chemical and
Segment Item 2025 (USD Billion) 2035 (USD Billion) CAGR
Oil and Gas $10.0 USD Billion $40.0 USD Billion 26.0%
Upstream $17.1 USD Billion $51.1 USD Billion 16.0%
Midstream $24.2 USD Billion $62.2 USD Billion 18.0%
Downstream $31.3 USD Billion $73.3 USD Billion 8.0%
Chemical and Petrochemical $38.4 USD Billion $84.4 USD Billion 23.0%

Segment-wise data is locked

Unlock complete segment-wise numbers for By End User.

Unlock Full Data
2025 (USD Billion)
2035 (USD Billion)
North Americ
Europe
Asia-Pacific
Latin Americ
Middle East
Segment Item 2025 (USD Billion) 2035 (USD Billion) CAGR
North America $10.0 USD Billion $40.0 USD Billion 10.0%
Europe $17.1 USD Billion $51.1 USD Billion 8.0%
Asia-Pacific $24.2 USD Billion $62.2 USD Billion 18.0%
Latin America $31.3 USD Billion $73.3 USD Billion 8.0%
Middle East & Africa $38.4 USD Billion $84.4 USD Billion 15.0%

Segment-wise data is locked

Unlock complete segment-wise numbers for By Region.

Unlock Full Data

Supply Chain Analysis of the Ball Valves Market

Supply Chain Analysis of the Ball Valves Market
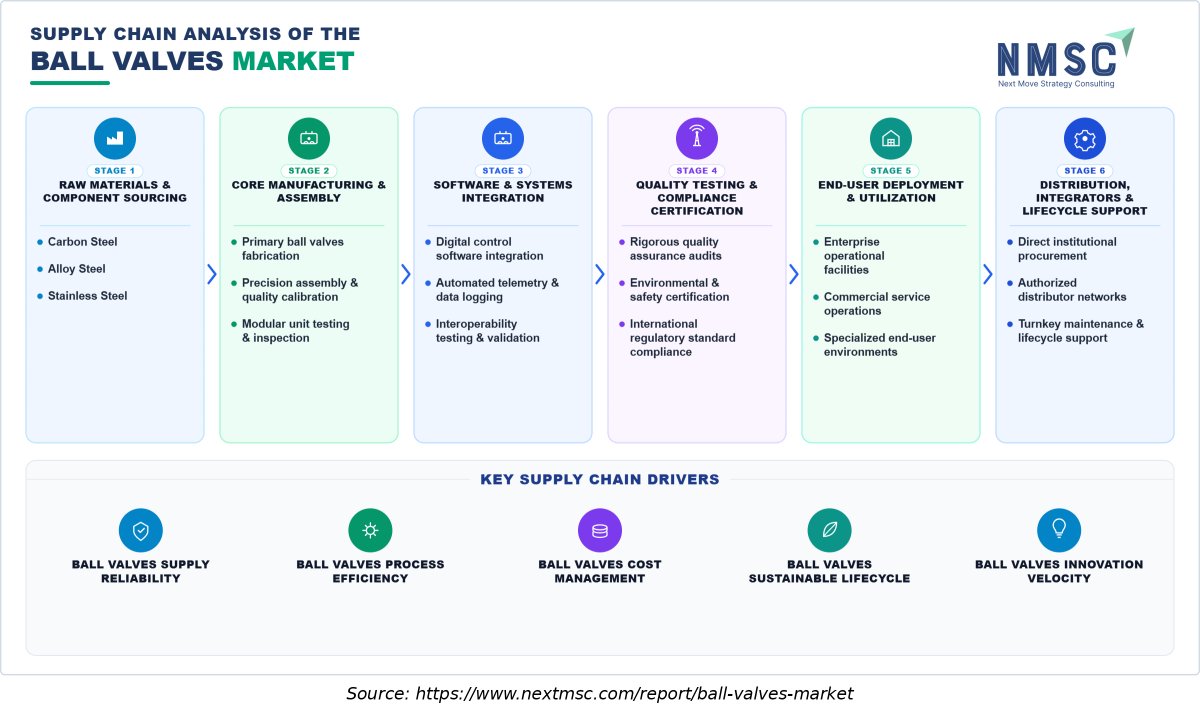
The above infographic maps the Ball Valves market supply chain across six sequential stages: stage 1: raw materials & component sourcing, stage 2: core manufacturing & assembly, stage 3: software & systems integration, stage 4: quality testing & compliance certification, stage 5: end-user deployment & utilization, stage 6: distribution, integrators & lifecycle support. It illustrates how these stages connect to ensure component reliability, manufacturing precision, supply stability, cost control, and rapid technological deployment across end-user environments.

Growth Opportunities

Our analysis shows that three structural whitespace opportunities are positioned to generate disproportionate commercial returns in the Ball Valves Market through 2035:

Can Subsea and Offshore Hydrocarbon Systems Capture High-Density Deployments?

Offshore platforms and subsea tiebacks require ball valves rated for extreme pressure, corrosive produced fluids, and remote actuation. Operators are seeking compact trunnion designs with validated fire safe and fugitive emission performance for these confined installations. Suppliers qualifying materials to demanding offshore standards can secure long term service agreements tied to field development programs in deepwater basins.

How Is Mid-Tier and Regional Facility Adoption Unlocking New Ball Valves Market Volume?

Regional water utilities, district heating networks, and mid-sized chemical plants represent a broad base of buyers seeking dependable valves without premium specifications. Standardized ball valve families with simplified actuator mounting let these facilities upgrade isolation points incrementally. Distributors serving these regional hubs play an important role by stocking common sizes and providing rapid field support for smaller operators.

Can Specialized Vertical Implementations Become Distinct Premium Ball Valves Market?

Hydrogen service, cryogenic LNG handling, and high purity pharmaceutical utilities each demand ball valves with specialized sealing and surface finishes. These niches command premium pricing because qualification testing and material traceability are rigorous. Manufacturers developing application specific seat chemistries and certified cryogenic extensions can establish distinct positions within these high value segments.

Regional Outlook

2025 (USD Billion)
2035 (USD Billion)
North Americ
Europe
Asia-Pacific
Latin Americ
Middle East
Region 2025 (USD Billion) 2035 (USD Billion) CAGR (%)
North America $10.0 USD Billion $40.0 USD Billion 9.0%
Europe $17.1 USD Billion $51.1 USD Billion 27.0%
Asia-Pacific $24.2 USD Billion $62.2 USD Billion 25.0%
Latin America $31.3 USD Billion $73.3 USD Billion 23.0%
Middle East & Africa $38.4 USD Billion $84.4 USD Billion 12.0%

Regional data is locked

Unlock complete regional numbers for this market.

Unlock Full Data

Competitive Landscape

The competitive structure of the ball valves market combines diversified industrial conglomerates with specialized valve manufacturers. Emerson Electric Co., Flowserve Corporation, IMI PLC, Crane Company, KITZ Corporation, Parker-Hannifin Corporation, Bray International, Inc., and Swagelok Company compete across overlapping product portfolios. Their scale in engineering, certification, and aftermarket service supports sustained positions across regions. Moreover, the presence of energy-focused participants such as SLB indicates that upstream operational requirements meaningfully shape product specifications and supplier selection.

Dimension Description
Proprietary Architectural IP & Reliability Patented seat and sealing designs, certified fire-safe and fugitive emission performance, and verified high-durability ratings.
Global Enterprise Distribution Direct relationships with tier-1 EPC contractors, regional distributors, and actuator and instrumentation integrators.
Sustainable Materials & Efficiency Transition toward energy-optimized actuation, recyclable materials, and certified low-emission sealing designs.
Service Lifecycle & SLA Moats Comprehensive 24/7 technical support, planned maintenance agreements, and spare parts availability.

How Do Companies Compete in the Ball Valves Market?

Manufacturers differentiate ball valves through pressure and temperature ratings, material options, actuation compatibility, and certification credentials. Pricing strategies vary between standardized catalog offerings for high-volume utility applications and engineered configurations for severe-service projects. Distribution relies on a mix of direct project sales to engineering contractors, industrial distributors, and aftermarket service networks. Consequently, responsiveness in delivery, technical support, and replacement parts availability frequently influences procurement decisions as much as headline price.

Which Competitive Archetypes Dominate the Ball Valves Market?

Market participants in ball valves fall into three recognizable archetypes. Diversified industrial manufacturers such as Emerson Electric Co., Crane Company, and IMI PLC integrate valves within broader flow control portfolios. Flow control specialists including Flowserve Corporation, KITZ Corporation, and Bray International, Inc. concentrate on valve engineering and application expertise. Fluid-system and instrumentation suppliers such as Swagelok Company and Parker-Hannifin Corporation compete through precision-engineered flow-control components and application-specific reliability for demanding installations.

What Innovation and Differentiation Strategies Are Companies Pursuing?

Sustainable advantages in ball valves arise from proven reliability records, extensive certification portfolios, and application-specific engineering know-how. Manufacturers that maintain broad material capabilities and tight manufacturing tolerances secure repeat business in critical service environments. Installed-base knowledge also supports aftermarket revenue, since replacement seats, seals, and actuators are typically sourced from original producers. Together, these factors build switching costs that protect incumbent positions over long equipment lifecycles.

What M&A and Partnership Activity Is Shaping the Market?

Mergers and acquisitions in ball valves increasingly focus on portfolio consolidation, adding actuation, automation, and specialty material capabilities to existing valve lines. Larger industrial groups pursue targeted acquisitions to broaden regional manufacturing footprints and strengthen aftermarket service coverage. Divestitures of non-core flow control assets also appear as conglomerates refine their focus on higher-margin engineered solutions. Such transactions reshape competitive boundaries and create integrated suppliers capable of serving complex multi-site projects.

Key Market Players

Based on research conducted by NMSC, the following 20 companies represent the validated leadership set across Ball Valves Market developers, manufacturers, and solution providers:

Emerson Electric Co. Flowserve Corporation SLB KITZ Corporation IMI PLC Crane Company Valmet Oyj Parker-Hannifin Corporation Bray International, Inc. Swagelok Company Georg Fischer AG Neway Valve (Suzhou) Co., Ltd. Velan Inc. KSB SE & Co. KGaA Danfoss A/S NIBCO Inc. Böhmer GmbH Bonney Forge Corporation OMB Valves S.p.A. PetrolValves S.p.A.

Latest Developments

During our market evaluation, we noticed that recent commercial activities, platform introductions, and partnerships within the industry reflect the latest market developments:

Date Event
October 2024 Flowserve Corporation completed the acquisition of MOGAS Industries, expanding its severe-service isolation ball valve portfolio and aftermarket presence across mining, power, and process industries.

Investment Opportunities

Where Are Capital Inflows Concentrating in the Ball Valves Market?

Capital allocation in the ball valves market is gravitating toward manufacturing capacity that supports higher-specification products and faster delivery. Producers are directing investment toward precision machining, seat and sealing technologies, and quality testing infrastructure that enable compliance with demanding pressure and material requirements. Asia-Pacific, which is expanding at a 7.72% CAGR through 2035, attracts particular attention as manufacturers seek proximity to growing industrial bases. These investments collectively strengthen the supply capacity needed to meet the projected rise in market revenue.

How Is Infrastructure Investment Shaping Market Capacity?

Infrastructure programs in water, energy, and industrial processing are reshaping capacity requirements across the ball valves value chain. Production facilities are adding automated machining and assembly equipment to handle rising volumes while preserving consistent tolerances. Distribution hubs located near major project corridors are also expanding inventory depth, reducing lead times for contractors and maintenance teams. As a result, operational capacity investments increasingly prioritize responsiveness alongside raw output.

What ESG Considerations Are Influencing Market Investment?

Environmental and safety expectations are increasingly influencing investment decisions in the ball valves ecosystem. Operators prioritize valves that minimize fugitive emissions and maintain reliable sealing, which reduces leakage risks in energy and chemical processing. Manufacturers are therefore evaluating material choices that extend service life and support recyclability at end of life. Energy efficiency gains in flow control systems also contribute to lower operating footprints, reinforcing the business case for upgraded product lines.

Key Benefits for Stakeholders

How Does This Report Benefit Industry Leaders and Enterprise Operators?

Operational executives, procurement directors, and commercial leaders in ball valves gain empirical benchmarks that support sourcing and capacity decisions. The report quantifies segment performance across design, material, size, and pressure rating, allowing teams to align inventory and specification standards with actual demand patterns. Forecasts through 2035 help planners anticipate volume shifts and manage supplier relationships more effectively. These insights reduce uncertainty when committing capital to long-cycle procurement programs.

How Does This Report Benefit Investors and Financial Analysts?

Investors evaluating ball valves can anchor their models to a market valued at USD 15.26 billion in 2025 and projected to reach USD 24.04 billion by 2035. The 4.65% CAGR provides a consistent growth reference for comparing manufacturers and assessing revenue durability. Segment-level data clarifies where margin-rich, high-growth niches are emerging relative to mature baseline categories. Such benchmarks support more disciplined valuation and portfolio allocation decisions.

How Does This Report Benefit Valve Manufacturers and Product Development Teams?

Product roadmap teams can use segment growth patterns to prioritize development efforts for ball valves. The faster expansion of Other Designs at 6.01% CAGR and Other Materials at 6.48% CAGR points to specialized configurations that merit focused engineering investment. Understanding regional and pressure-rating dynamics helps vendors target applications where performance differentiation commands premium positioning. Consequently, the report supports more precise competitive planning across product families.

Key Market Segments Evaluated

By Valve Design

  • Floating Ball
  • Trunnion-Mounted Ball
  • Segmented Ball
  • Rising-Stem Ball
  • Other Designs

By Body Material

  • Carbon Steel
  • Alloy Steel
  • Stainless Steel
  • Duplex Steel
  • Cast Iron
  • Ductile Iron
  • Brass and Bronze
  • Nickel Alloys
  • Thermoplastics
  • Other Materials

By Size

  • Up to DN50
  • DN65–DN150
  • DN200–DN300
  • DN350–DN600
  • Above DN600

By Pressure Rating

  • Up to 20 Bar
  • Above 20–50 Bar
  • Above 50–100 Bar
  • Above 100–250 Bar
  • Above 250 Bar

By Port Design

  • Full Bore
  • Reduced Bore
  • V-Port
  • Other Port Designs

By Flow Configuration

  • Two-Way
  • Three-Way
  • Four-Way and Above

By Actuation

  • Manual
  • Pneumatic
  • Electric
  • Hydraulic
  • Other Actuation

By End Connection

  • Flanged
  • Threaded
  • Butt Weld
  • Socket Weld
  • Compression
  • Sanitary Clamp
  • Other Connections

By Sales Channel

  • Direct Sales
  • Distributors
  • Agents and Representatives
  • E-Commerce

By End User

  • Oil and Gas 
    • Upstream
    • Midstream
    • Downstream
  • Chemical and Petrochemical
  • Power Generation
  • Water and Wastewater
  • HVAC and Building Services
  • Food and Beverage
  • Pharmaceutical and Biotechnology
  • Mining and Metals
  • Pulp and Paper
  • Other Industries

By Region

  • North America 
    • U.S.
    • Canada
    • Mexico.
  • Europe 
    • UK
    • Germany
    • France
    • Italy
    • Rest of Europe.
  • Asia-Pacific 
    • China
    • India
    • Japan
    • South Korea
    • Australia
    • Rest of APAC.
  • Latin America 
    • Brazil
    • Argentina
    • Colombia
    • Rest of Latin America.
  • Middle East & Africa 
    • UAE
    • Saudi Arabia
    • South Africa
    • Rest of MEA.

Conclusion & Recommendations

What Is the Long-Term Outlook for the Ball Valves Market?

The long-term outlook for the ball valves market is strongly positive, with revenue expanding from USD 15.97 billion in 2026 to USD 24.04 billion by 2035 at a 4.65% CAGR. Growth is underpinned by durable infrastructure demand, the structural shift toward high-specification valves, and continuous material and sealing innovation. Mature baseline segments provide stable revenue, while specialized categories supply the incremental momentum that shapes future competitive positions.

What Strategic Positioning Recommendations Does NMSC Offer?

Manufacturers should prioritize engineered configurations for severe-service and large-bore applications where growth outpaces the broader ball valves market. OEMs can strengthen positions by expanding alloy and polymer material options that address aggressive media requirements. Distributors should deepen aftermarket inventories of seats, seals, and actuators to capture replacement demand across the installed base. Together, these measures help participants sustain advantage as product specifications become more demanding.

How Attractive Is the Ball Valves Market for Investment?

Investment attractiveness is high, supported by the USD 8.07 billion absolute growth opportunity between 2026 and 2035. Stable baseline demand from established design and size segments provides cash flow resilience, while accelerating specialty categories offer upside. Margin profiles tend to be strongest where engineering differentiation and certification credentials limit commoditization. Demand drivers including infrastructure renewal and energy processing expansion reinforce long-term commercial visibility.

What Are the Key Market Shifts and Risks in the Ball Valves Market?

The ball valves market is shifting toward higher-specification products, with material and pressure requirements becoming more demanding across end uses. Raw material price volatility, particularly for steel and specialty alloys, can compress manufacturer margins when contract pricing lags input costs. Supply chain concentration in casting and forging capacity also creates lead time risks during periods of elevated project activity. Producers that diversify sourcing and maintain flexible production planning are better positioned to absorb these pressures.

What Are the Primary Growth Pathways Through 2035?

Participants can capture a disproportionate share of the USD 8.07 billion absolute growth opportunity by pursuing focused expansion paths. Large-bore configurations in the DN350–DN600 range, expanding at a 6% CAGR, align with infrastructure and water network investment. High-pressure products above 250 Bar, growing at 5.97% CAGR, serve energy processing operations requiring robust sealing. Asia-Pacific expansion at a 7.72% CAGR offers geographic growth that complements established North American leadership.

Delivered Customizations

We have successfully delivered the following deep-dive customizations:

Client Request Customization Delivered Value Adds
Country-Level Trade Flow Assessment
  • Country-wise import and export analysis of ball valves and related components using UN Comtrade and national customs data.
  • Identifies major sourcing and export hubs, supporting supply chain, tariff exposure, and localization decisions.
Historical Market Growth Analysis
  • Historical market revenue and unit shipment analysis across valve design, body material, and end-user segments.
  • Highlights fastest-growing segments and establishes a reliable baseline for forecast validation and investment planning.
Company-Level Product Mix Benchmarking
  • Company-level share analysis by valve design, actuation type, and body material, based on disclosed segment and product data.
  • Reveals competitor strengths in specific product niches, informing portfolio focus and product positioning.
Actuation Adoption by End-Use Industry
  • Mapping of manual, pneumatic, and electric actuated ball valve demand across oil and gas, water, power, and chemical end users.
  • Pinpoints where automation upgrades are accelerating, guiding actuator-integrated product development and targeting.
Pressure Class and Material Specification Demand Analysis
  • Demand mapping by pressure rating and body material against project specifications in LNG, hydrogen, cryogenic, and high-pressure process applications.
  • Shows which high-specification niches offer premium pricing and where material capability gaps limit market access.
Replacement Versus New-Build Demand Assessment
  • Split of ball valve demand between aftermarket replacement and new installations by sales channel and region, linked to infrastructure and capex trends.
  • Separates recurring aftermarket revenue from project-driven demand, supporting channel strategy and regional capacity planning.

FAQs

About the Author

Mayurima Roy

Mayurima Roy

Mayurima Roy is Research Analyst at Next Move Strategy Consulting, where she has spent 4 years working across the firm's full industry coverage rather than a single fixed vertical. Her work centers on structured research, ongoing trend tracking, competitive assessment, and insight-led content development, translating complex market data into clear, decision-ready narratives that support informed client decision-making across diverse global industries, market sectors, and world regions every day.

About the Reviewer

Supradip Baul

Supradip Baul

Supradip Baul is an accomplished business consultant and strategist with over a decade of rich experience in market intelligence, strategy, technology, and business transformation. His work has included rigorous qualitative and quantitative analysis across multiple industries, helping clients shape investment decisions and long-term roadmaps. Earlier in his career, he was associated with Gartner, where he contributed to industry-leading reports and market share analyses. He has worked with leading global companies and holds an MBA with a dual specialization in Marketing and Finance.

Download Free Sample

Mohit Agarwal

MOHIT AGARWAL

Chief Manager

DryChem India Pvt. Ltd.

Next Move Strategy Consulting is an amazing team of consultants. We required a market study report for our investors on top priority and the team went above and beyond our expectations to deliver the same with ample supporting data within a short time span enabling us to secure the investments and keep our project timeline maintained. Their professionalism, attention to detail, and timely delivery of actionable recommendations have left a lasting impression on our organization.

Nishant Awate

NISHANT AWATE

Business Development Global Sales

Zehnder Group Deutschland GmbH

Our experience working with Next Move Strategy Consulting was positive. The team was responsive, professional, and open to incorporating our specific requirements throughout the project. The India AHU market study was comprehensive and well structured, covering market value and volume forecasts, product and application segments, and key industry trends. The inclusion of both AHU and residential MVHR market insights made the study particularly relevant for our strategic market assessment. Overall, the report provides a solid foundation for evaluating market potential, identifying priority segments, and supporting business-development decisions in India.

Semih Kavaklioglu

SEMIH KAVAKLIOGLU

Co-Founder & Sales Manager

Decortie

I work a lot in the marketing industry and I know that research is an essential part of any campaign. I have used Market research reports for my own products and I found them to be very informative and well-researched. The team here produces insightful reports for a good price

Gustaf Hummel Burstrom

GUSTAF HUMMEL BURSTROM

Founder

Revline Tools AB

Joseph and the team at Next Move Strategy Consulting have been excellent to work with, in supplying us with relevant market data and forecasts for our specific category. We had some special requirements and they were able to do a custom package to suit our needs. We would definitely recommend them to any other company needing market data and forecasts

Robert Sean Trevino

ROBERT SEAN TREVINO

Sr. Director, Head of Strategic Insights & Analytics

Foundation Medicine

I realized that it was a reliable source of information. These days, there are many people who are looking for authentic data, and this is one of the only sources that can offer them with what they need;

Custom Market Research Services

We will customize the research for you if the listed report does not fully match your requirements.

Get 30% Free Customization

Select License

This website uses cookies to ensure you get the best experience on our website. Learn more

✖