Catastrophe Bond Market Global Industry Analysis and Forecast (2026–2035)

The Catastrophe Bond Market size was USD 59.80 Billion in 2025, projected to reach USD 140.00 Billion by 2035, growing at a CAGR of 8.8% from 2026 to 2035. Key drivers include rising insured catastrophe losses, increased sponsor participation, and strong investor demand, with North America leading the market.
Download Free Sample PDF
Base Year (2025)
$59.80 Billion
Forecast (2035)
$140.00 Billion
CAGR (2026-2035)
8.8%
Top Region
North America

What Is the Catastrophe Bond Market Size?
The global Catastrophe Bond Market reached USD 59.80 Billion in 2025 and is estimated at USD 65.50 Billion in 2026. It is forecast to reach USD 140.00 Billion by 2035, growing at a CAGR of 8.8% from 2026–2035. North America led with about 83% share in 2025, while indemnity triggers held roughly 70% share.

Our assessment indicates that three segmentation axes and the regional split define where value is concentrated.

Catastrophe Bond Market Global Industry Analysis and Forecast (2026–2035) Revenue Forecast
Values in USD Billion

2025 $59.80 Billion
2025
2026 $65.50 Billion
2026
2027 $71.26 Billion
2027
2028 $77.54 Billion
2028
2029 $84.36 Billion
2029
2030 $91.78 Billion
2030
2031 $99.86 Billion
2031
2032 $108.65 Billion
2032
2033 $118.21 Billion
2033
2034 $128.61 Billion
2034
2035 $140.00 Billion
2035

Key Takeaways

By Trigger Type: Indemnity held the largest share, expanding from USD 41.87 Billion in 2025 to USD 96.60 Billion by 2035; Parametric is the fastest growing at 14.1% CAGR from 2026–2035.

By Peril: Multiperil (US and international) held the largest share, expanding from USD 22.72 Billion in 2025 to USD 50.40 Billion by 2035; non-natural catastrophe perils are the fastest growing at 14.2% CAGR from 2026–2035.

By Sponsor Type: Primary insurers held the largest share, expanding from USD 28.71 Billion in 2025 to USD 72.80 Billion by 2035; Corporates and others is the fastest growing at 12.7% CAGR from 2026–2035.

Dominant Region: North America accounted for USD 49.63 Billion in 2025, rising to USD 105.70 Billion by 2035.

Fastest-Growing Region: Asia-Pacific is projected to expand at 14.1% CAGR from 2026–2035, reaching USD 14.00 Billion by 2035.

Dominant Country: The U.S. contributed USD 48.40 Billion in 2025 and is projected at USD 102.20 Billion by 2035.

Fastest-Growing Country: India is projected to grow at 26.8% CAGR from 2026–2035, from a small base of USD 0.07 Billion in 2025.

Outstanding catastrophe bond notional is projected to increase by USD 74.50 Billion between 2026 and 2035, indicating an expansion in risk-transfer capacity and investment opportunities.

According to NMSC analysis, multiyear indemnity structures from repeat insurer sponsors are the most reliable source of renewal volume through 2030.

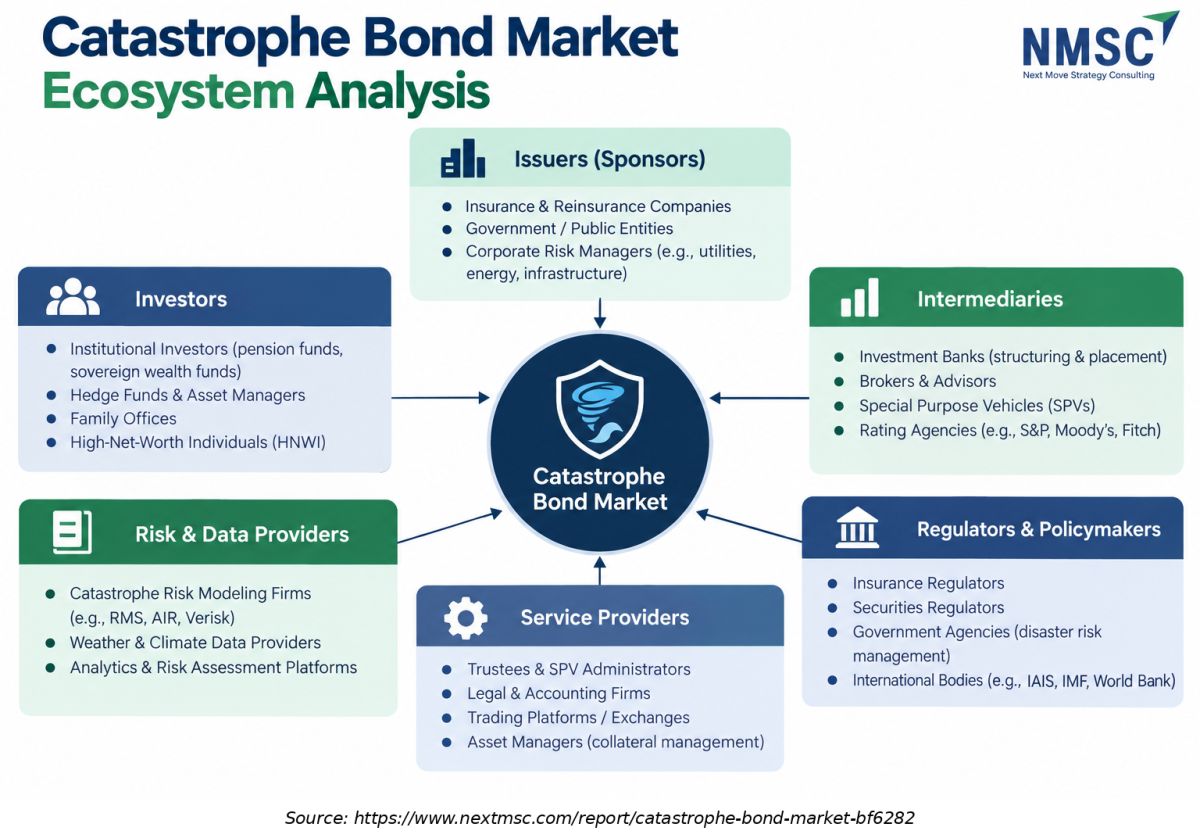
Ecosystem Analysis of the Catastrophe Bond Market
The catastrophe bond market ecosystem comprises insurers, reinsurers, institutional investors, special purpose vehicles (SPVs), regulators, and risk modeling and data providers. These stakeholders work together to transfer catastrophe-related risks to capital markets, mobilize alternative investment capital, and provide financial protection against large-scale natural disasters. Their collaboration strengthens risk diversification and supports greater financial resilience.

What Does the Catastrophe Bond Market Encompass?

The catastrophe bond market encompasses securities issued through special purpose vehicles (SPVs) that transfer property catastrophe and selected non-natural event risks from sponsors to capital markets investors. Notes are fully collateralized, and principal is at risk if a defined event breaches the trigger. Sponsors include primary insurers, reinsurers, government backed programs, sovereign borrowers and corporates. This report measures the market as outstanding notional limit at year end across Rule 144A and private placements, expressed in USD Billion.
Structural evolution has been rapid, with issuance exceeding USD 25 Billion in 2025, the first year above USD 20 Billion, and a record number of new sponsors. Regulation rests on Rule 144A in the United States and special purpose insurer regimes in Bermuda, Ireland and Europe, while catastrophe models, trustees and calculation agents add technology depth. We found that standardized documentation is shortening time to market for repeat sponsors and widening participation by first time issuers.

Market Drivers & Dynamics

Interactive Dataset
Rising insured catastrophe losses and protection gap driver +2.1% Global, led by North America 2026–2035
Record sponsor entry and sovereign adoption driver +1.4% North America, Europe, Asia-Pacific 2026–2032
Strong investor demand and diversification appeal driver +1.2% Global 2026–2030
Standardized indemnity structures driver +0.8% North America, Europe 2026–2031
Cyber and secondary peril expansion driver +0.9% Global 2027–2035
Spread compression restraint −1.1% North America 2026–2029
US wind concentration and event risk restraint −0.9% North America 2026–2035
Heavy maturity schedules and capacity absorption restraint −0.6% Global 2026–2028
Source: Next Move Strategy Consulting

Growth Drivers

What Is the Primary Growth Driver in the Catastrophe Bond Market?

Rising insured catastrophe losses are the primary driver, because sponsors need deeper multiyear capital to protect balance sheets. Global insured natural catastrophe losses reached USD 107 Billion in 2025, and long-term growth of 5% to 7% a year points to USD 148 Billion in 2026 and USD 186 Billion by 2030. We found that each additional dollar of retained volatility raises demand for collateralized capacity, which supports the market.

How Is Investor Demand Driving Market Growth?

Investors are drawn by yields that remain attractive relative to expected loss and by low correlation with broader financial markets. The Swiss Re Cat Bond Total Return Index delivered an 11.4% return in 2025, while the market continued to attract strong investor demand in the first half of 2026. Our assessment indicates that dedicated UCITS funds and pension allocations extend this demand base and sustain the market through renewals.

Growth Inhibitors

What Is Restraining the Catastrophe Bond Market?

Spread compression and concentration in US wind are the primary restraints. Risk spreads have returned to levels last seen before Hurricane Ian, which narrows investor margins, and more than half of first half 2026 issuance carried over 90% of expected loss from US wind. Scheduled maturities of USD 10.2 Billion in the first half of 2026 also force constant reinvestment, and a peak loss year near USD 320 Billion could test confidence in the market.

What Are the Growth Opportunities?

How Can Parametric Structures for Sovereigns Create Value?

Parametric notes rise from USD 5.57 Billion in 2026 to USD 18.20 Billion by 2035, offering governments fast liquidity after a disaster without waiting for loss adjustment. Government and public sector sponsors and emerging market treasuries are the main beneficiaries, while investors gain access to uncorrelated risk in the market.

Where Does Cyber and Emerging Peril Cover Offer Growth?

Non-natural catastrophe perils grow from USD 3.60 Billion in 2026 to USD 11.90 Billion by 2035 as specialty insurers and reinsurers seek capital for cyber, cloud outage and mortality tail risk. Beneficiaries include specialty carriers, reinsurers and investors seeking diversification away from hurricane exposure and toward fresh risk classes in the market.

How Will Asia-Pacific and Europe Expand Issuer Participation?

Asia-Pacific grows at 14.1% CAGR and Europe at 12.8%, as regional insurers use earthquake, flood and windstorm bonds to protect solvency capital. Japanese, German and Indian sponsors are the main beneficiaries, and the market gains new exposure that lets global investors diversify further away from US wind and reduce portfolio concentration.

Segmentation Analysis

2025 (USD Billion)
2035 (USD Billion)
Indemnity 2025: $41.87 Billion | 2035: $96.60 Billion
Indemnity
Industry loss index 2025: $11.36 Billion | 2035: $21.00 Billion
Industry los
Parametric 2025: $4.78 Billion | 2035: $18.20 Billion
Parametric
Modeled loss and hybrid 2025: $1.79 Billion | 2035: $4.20 Billion
Modeled loss
Indemnity $41.87 Billion $96.60 Billion 8.5%
Industry loss index $11.36 Billion $21.00 Billion 6.6%
Parametric $4.78 Billion $18.20 Billion 14.1%
Modeled loss and hybrid $1.79 Billion $4.20 Billion 8.8%

Which Trigger Type Leads the Catastrophe Bond Market?

Indemnity structures lead with USD 41.87 Billion in 2025 and are expected to reach USD 96.60 Billion by 2035, because sponsors value claims-based recovery that minimizes basis risk. Parametric notes are the fastest growing at 14.1% CAGR, supported by sovereign sponsors and the full Jamaica payout that demonstrated speed of settlement. Industry loss index notes grow at 6.6%, reflecting steady use by reinsurers for retrocession within the market.

2025 (USD Billion)
2035 (USD Billion)
Category A
Category B
Category C
Category D
Segment Item 2025 (USD Billion) 2035 (USD Billion) CAGR
Category A $10.0 USD Billion $40.0 USD Billion 21.0%
Category B $17.1 USD Billion $51.1 USD Billion 23.0%
Category C $24.2 USD Billion $62.2 USD Billion 25.0%
Category D $31.3 USD Billion $73.3 USD Billion 23.0%

Segment-wise data is locked

Unlock complete segment-wise numbers for By Peril.

Unlock Full Data
2025 (USD Billion)
2035 (USD Billion)
Category A
Category B
Category C
Category D
Segment Item 2025 (USD Billion) 2035 (USD Billion) CAGR
Category A $10.0 USD Billion $40.0 USD Billion 11.0%
Category B $17.1 USD Billion $51.1 USD Billion 25.0%
Category C $24.2 USD Billion $62.2 USD Billion 19.0%
Category D $31.3 USD Billion $73.3 USD Billion 13.0%

Segment-wise data is locked

Unlock complete segment-wise numbers for By Sponsor Type.

Unlock Full Data

Growth Opportunities

Our findings suggest that three opportunity pools offer the strongest incremental return on capital through 2035.

How Can Parametric Structures for Sovereigns Create Value?

Parametric notes rise from USD 5.57 Billion in 2026 to USD 18.20 Billion by 2035, offering governments fast liquidity after a disaster without waiting for loss adjustment. Government and public sector sponsors and emerging market treasuries are the main beneficiaries, while investors gain access to uncorrelated risk in the market.

Where Does Cyber and Emerging Peril Cover Offer Growth?

Non-natural catastrophe perils grow from USD 3.60 Billion in 2026 to USD 11.90 Billion by 2035 as specialty insurers and reinsurers seek capital for cyber, cloud outage and mortality tail risk. Beneficiaries include specialty carriers, reinsurers and investors seeking diversification away from hurricane exposure and toward fresh risk classes in the market.

How Will Asia-Pacific and Europe Expand Issuer Participation?

Asia-Pacific grows at 14.1% CAGR and Europe at 12.8%, as regional insurers use earthquake, flood and windstorm bonds to protect solvency capital. Japanese, German and Indian sponsors are the main beneficiaries, and the market gains new exposure that lets global investors diversify further away from US wind and reduce portfolio concentration.

Regional Outlook

2025 (USD Billion)
2035 (USD Billion)
North Americ
Europe
Asia-Pacific
Middle East
Latin Americ
Region 2025 (USD Billion) 2035 (USD Billion) CAGR (%)
North America $10.0 USD Billion $40.0 USD Billion 9.0%
Europe $17.1 USD Billion $51.1 USD Billion 27.0%
Asia-Pacific $24.2 USD Billion $62.2 USD Billion 25.0%
Middle East & Africa $31.3 USD Billion $73.3 USD Billion 23.0%
Latin America $38.4 USD Billion $84.4 USD Billion 12.0%

Regional data is locked

Unlock complete regional numbers for this market.

Unlock Full Data

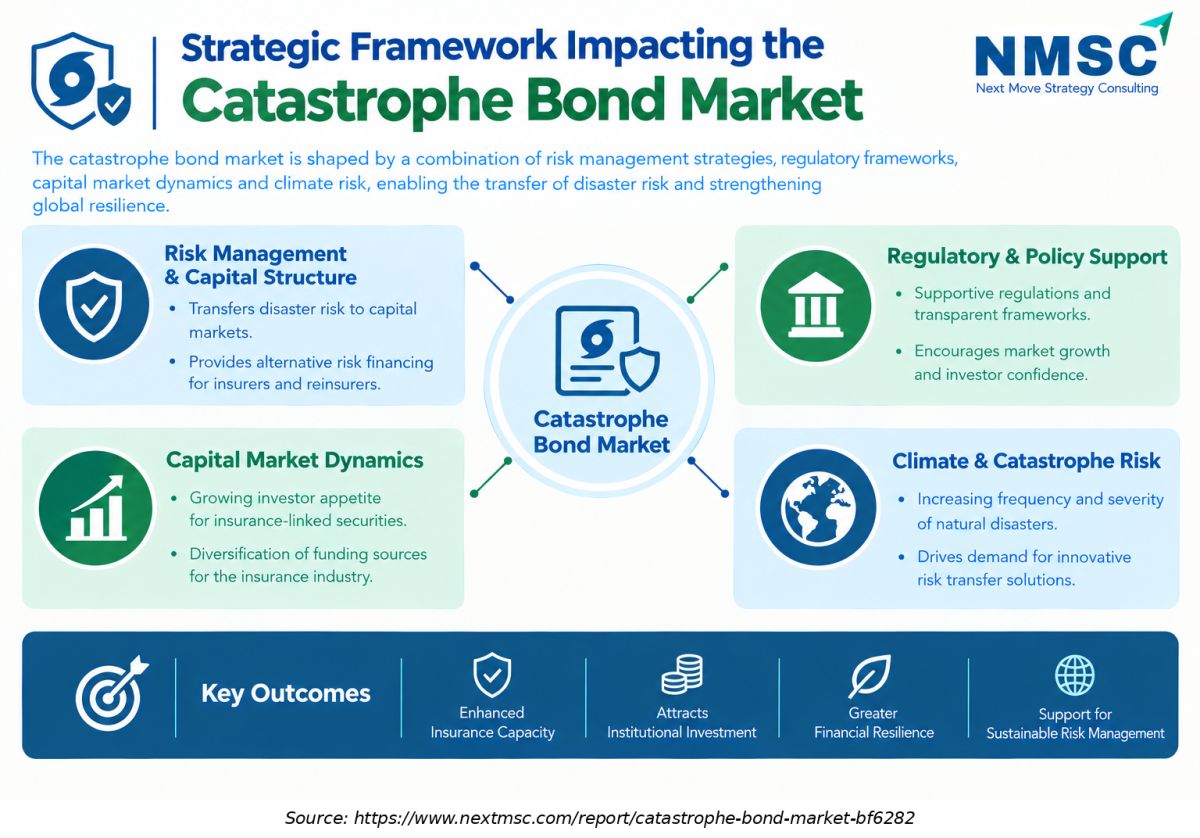
Strategic Framework Impacting the Catastrophe Bond Market

Strategic Framework Impacting the Catastrophe Bond Market

The catastrophe bond market is influenced by risk management strategies, capital market dynamics, regulatory support, and increasing climate-related catastrophe risks. Growing investor interest in insurance-linked securities and the need for alternative risk financing are encouraging market development. Together, these factors enhance risk-transfer capacity, attract institutional investment, and strengthen financial resilience against natural disasters.

Competitive Landscape

NMSC's analysis indicates that a small group of structuring intermediaries handles most placements in the market.

How Do Companies Compete in the Catastrophe Bond Market?

Competition centers on relationships with repeat sponsors, execution certainty and investor distribution. Arrangers win mandates by combining modeling insight with placement strength, and by delivering competitive pricing at the tight end of guidance. We observed that sponsors often appoint two arrangers for large deals, which increases shared execution capability in the market.

Which Company Archetypes Dominate the Market?

Three archetypes dominate. Broker affiliated units such as Aon Securities, GC Securities of Marsh McLennan, Gallagher Securities and Howden Capital Markets & Advisory differentiate through client reach and analytics. Reinsurer led platforms such as Swiss Re Capital Markets differentiate through underwriting expertise. Reinsurer facilitators such as Hannover Re differentiate through balance sheet and private placement vehicles in the market.

What Innovation and Differentiation Strategies Are Visible?

Leading groups are building private placement platforms, index trigger vehicles and cyber and casualty structures to reach new sponsors. Hannover Re uses its Kaith Re vehicle to issue private catastrophe bonds, and Gallagher Securities supports index trigger issuance through a dedicated platform. Differentiation increasingly depends on speed, pricing discipline and geographic expansion into new domiciles within the market.

Key Market Players

Our assessment indicates that the following verified companies shape structuring, placement and facilitation activity in the market.

Aon plc Marsh & McLennan Companies, Inc. Howden Group Holdings Limited Swiss Re Ltd Arthur J. Gallagher & Co. Hannover Rück SE (private catastrophe bond facilitator)

Latest Developments

We observed that the most relevant verified developments between 2025 and 2026 centre on record issuance, sovereign payouts and loss trends.

Date Event
February 2026 Swiss Re Capital Markets published its ILS market review showing that US wind exposure continued to dominate cat bond issuance during 2025.

Expert Insights

Jason Bolding

Jason Bolding

Global CEO | Gallagher Securities

"“U.S. hurricane and earthquake will remain the peak perils, but the market continues to expand and broaden.”"

Analyst Interpretation

The comment highlights the diversification of catastrophe bond coverage beyond traditional hurricane and earthquake risks. Increasing interest in wildfire, cyber and terrorism-related exposures is encouraging the development of specialized catastrophe-linked securities. This expansion creates opportunities for issuers and investors to access new risk categories while improving portfolio diversification.

Investment Opportunities

What Capital Inflows Are Supporting the Catastrophe Bond Market?

Net new capital of about USD 5 Billion entered the market in the first half of 2026, and UCITS funds, pension schemes and dedicated ILS managers continue to raise allocations. Our analysis shows that low correlation with other asset classes and strong historical index returns sustain this demand. Investors can access the market through funds, direct notes and private placements.

Which Infrastructure Investments Support Market Growth?

Market infrastructure includes catastrophe modeling, trustee and escrow services, listing venues such as the Bermuda Stock Exchange, and collateral solutions. We found that investment in data, loss verification and standardized documents shortens execution cycles and widens access for new sponsors. Service providers that scale these capabilities capture durable fee income as the market grows toward USD 140.00 Billion.

How Do ESG Considerations Shape Investment Decisions?

Catastrophe bonds fund resilience by giving insurers and governments pre-arranged capital, which narrows a natural catastrophe protection gap estimated at USD 424 Billion in 2025. Investors increasingly assess climate exposure, sponsor mitigation practices and community benefits. Our assessment indicates that transparent modeling of climate trends will be central to ESG aligned allocations to the market.

Key Benefits for Stakeholders

How Does This Report Benefit Insurers and Reinsurers?

Insurers and reinsurers gain a segmented view of triggers, perils and sponsor demand, which supports decisions on retention, structure and timing. The forecast of USD 140.00 Billion by 2035 and regional growth rates helps them judge when to use the catastrophe bond market against traditional reinsurance. Competitive analysis highlights arranger capabilities and pricing signals.

What Value Does It Offer Investors and Asset Managers?

Investors receive peril, trigger and regional breakdowns that help them diversify away from US wind concentration and plan allocations with greater confidence. Growth drivers, restraints and the opportunity assessment clarify how yields, spreads and new supply may evolve over the coming years. We found that these insights support allocation and risk budgeting across the market.

How Does It Help Governments and Corporate Risk Managers?

Public sector and corporate risk managers can compare parametric and indemnity structures, review sovereign precedents such as Jamaica, and assess costs of disaster finance. The report shows how the market complements insurance and contingent credit, and it provides forecasts and regional detail that inform budgeting, procurement of cover and resilience planning.

Key Market Segments Evaluated

By Trigger Type

  • Indemnity
  • Industry loss index
  • Parametric
  • Modeled loss and hybrid

By Peril

  • US named storm
  • US earthquake
  • Multiperil (US and international)
  • Other natural catastrophe perils
  • Non-natural catastrophe perils

By Sponsor Type

  • Primary insurers
  • Reinsurers and retrocessionaires
  • Government and public sector entities
  • Corporates and others

By Region

  • North America 
    • U.S.
    • Canada
    • Mexico
  • Europe 
    • UK
    • Germany
    • France
    • Italy
    • Spain
    • Sweden
    • Denmark
    • Finland
    • Netherlands
    • Rest of Europe
  • Asia-Pacific 
    • China
    • India
    • Japan
    • South Korea
    • Taiwan
    • Indonesia
    • Vietnam
    • Australia
    • Philippines
    • Malaysia
    • Rest of APAC
  • Middle East & Africa 
    • Saudi Arabia
    • UAE
    • Egypt
    • Israel
    • Turkey
    • Nigeria
    • South Africa
    • Rest of MEA
  • Latin America 
    • Brazil
    • Argentina
    • Chile
    • Colombia
    • Rest of LATAM

Conclusion & Recommendations

The market is forecast to grow from USD 65.50 Billion in 2026 to USD 140.00 Billion by 2035, a CAGR of 8.8%. Growth is slower than the recent double-digit pace because the base is larger, but it remains well supported by rising insured losses and structural demand. We found that the market is likely to become a permanent layer in many reinsurance programs.

What Strategic Positioning Recommendations Does NMSC Offer?

NMSC recommends that sponsors build multiyear programs, diversify perils and use indemnity structures where basis risk matters. Arrangers should invest in analytics, cyber and parametric capabilities, and in Asia-Pacific and European origination. Investors should balance US wind exposure with other perils, and monitor spread levels, collateral yields and sponsor quality closely through each renewal season.

How Attractive Is the Catastrophe Bond Market for Investment? (Investment Attractiveness)

Investment attractiveness is high but selective. Yields remain favorable relative to expected loss, correlation with financial markets is low, and an opportunity of USD 74.50 Billion lies ahead. Tighter spreads and event risk mean that sponsor selection, structure quality and diversification will determine returns for allocators over the full forecast period.

What Are the Market Shifts and Key Risks in the Catastrophe Bond Market?

Key shifts include movement toward indemnity and per occurrence cover, secondary peril acceptance and sovereign adoption. Key risks include a peak loss year near USD 320 Billion, spread compression, concentration in US wind and basis risk on parametric structures. We observed that disciplined structures, transparent modeling and strong investor communication mitigate these risks.

What Are the Primary Growth Pathways Through 2035?

Growth pathways include parametric expansion to USD 18.20 Billion, non-natural catastrophe perils reaching USD 11.90 Billion, and Asia-Pacific climbing to USD 14.00 Billion. Primary insurers will remain the largest sponsor group, while governments and corporates widen participation. Together, these pathways support a steady, diversified expansion of catastrophe risk-transfer capacity through the end of the forecast period.

FAQs

Sources & References

1.

Swiss Re Institute, sigma 1/2026: Natural catastrophes in 2025

swissre.com
2.

Swiss Re Institute, Natural catastrophe protection gap

swissre.com
3.

Swiss Re Capital Markets, ILS Market Insights Edition XXXIX, February 2026

swissre.com
4.

Swiss Re, Alternative Capital Partners

swissre.com
5.

World Bank, Hurricane Melissa triggers 100% payout of the Jamaica catastrophe bond, 7 November 2025

worldbank.org
6.

Farmers Insurance Group, Closes Multi Year, Multi-Peril Catastrophe Bond, 18 December 2025

newsroom.farmers.com
7.

Aon plc, Investment Banking for the Insurance Industry

aon.com
8.

Aon plc, Fast Company World Changing Ideas announcement, 17 June 2026

aon.mediaroom.com
9.

Aon plc, Alternative Capital Reaches Record High, ILS Report, 28 August 2025

aon.mediaroom.com
10.

Guy Carpenter, GC Securities capabilities (Marsh McLennan)

guycarp.com
11.

Gallagher Re, 1st View January 2025

ajg.com
12.

Howden Group, Reinsurance and Insurance Linked Securities

howdengroup.com/co-en/reinsurance
13.

Hannover Re, Insurance Linked Securities

hannover-re.com

About the Author

Mayurima Roy

Mayurima Roy

Mayurima Roy is Research Analyst at Next Move Strategy Consulting, where she has spent 4 years working across the firm's full industry coverage rather than a single fixed vertical. Her work centers on structured research, ongoing trend tracking, competitive assessment, and insight-led content development, translating complex market data into clear, decision-ready narratives that support informed client decision-making across diverse global industries, market sectors, and world regions every day.

About the Reviewer

Supradip Baul

Supradip Baul

Supradip Baul is an accomplished business consultant and strategist with over a decade of rich experience in market intelligence, strategy, technology, and business transformation. His work has included rigorous qualitative and quantitative analysis across multiple industries, helping clients shape investment decisions and long-term roadmaps. Earlier in his career, he was associated with Gartner, where he contributed to industry-leading reports and market share analyses. He has worked with leading global companies and holds an MBA with a dual specialization in Marketing and Finance.

Download Free Sample

Robert Sean Trevino

ROBERT SEAN TREVINO

Sr. Director, Head of Strategic Insights & Analytics

Foundation Medicine

I realized that it was a reliable source of information. These days, there are many people who are looking for authentic data, and this is one of the only sources that can offer them with what they need;

Amos Chang

AMOS CHANG

Strategy Consultant

Kardex Group

I have bought the intralogistics market reports from NMSC two times so far. Joseph and his team are always very helpful and flexible in responding to any customization requirements on the report. Their expertise in market reports really helps us steer the day-to-day business. I will definitely recommend and come back myself whenever there is a need.

Mohit Agarwal

MOHIT AGARWAL

Chief Manager

DryChem India Pvt. Ltd.

Next Move Strategy Consulting is an amazing team of consultants. We required a market study report for our investors on top priority and the team went above and beyond our expectations to deliver the same with ample supporting data within a short time span enabling us to secure the investments and keep our project timeline maintained. Their professionalism, attention to detail, and timely delivery of actionable recommendations have left a lasting impression on our organization.

Kevin Coker

KEVIN COKER

Founder, CEO and Board Diector

Proxima Clinical Research

I have been using Next MSC reports for product positioning in a new geography for a long time. They have by far the best reports I have found and the price is reasonable too!

Semih Kavaklioglu

SEMIH KAVAKLIOGLU

Co-Founder & Sales Manager

Decortie

I work a lot in the marketing industry and I know that research is an essential part of any campaign. I have used Market research reports for my own products and I found them to be very informative and well-researched. The team here produces insightful reports for a good price

Custom Market Research Services

We will customize the research for you if the listed report does not fully match your requirements.

Get 30% Free Customization

Select License

This website uses cookies to ensure you get the best experience on our website. Learn more

✖