Parametric Insurance Market Global Industry Analysis and Forecast (2026–2035)

The global Parametric Insurance Market size was valued at USD 18.20 billion in 2025 and is estimated at USD 20.30 billion in 2026, forecast to reach USD 55.40 billion by 2035, expanding at an 11.8% CAGR between 2026 and 2035. North America leads with approximately 37% share, while Weather Parametric Coverage dominates all other peril types with approximately 30% share.

Download Free Sample PDF
Base Year (2025)
$18.20 Billion
Forecast (2035)
$55.40 Billion
CAGR (2026-2035)
11.8%
Top Region
North America

What Is the Parametric Insurance Market Size?
The global parametric insurance market size was valued at USD 18.20 billion in 2025 and is estimated at USD 20.30 billion in 2026, forecast to reach USD 55.40 billion by 2035, expanding at a 11.8% CAGR between 2026 and 2035. North America leads with approximately 37% share, while weather parametric coverage dominates all other peril types with approximately 30% share.

We observed that growth is broad-based across every segmentation axis, with insurtech-led distribution and sensor-based triggers driving the dominant structural shifts through 2035.

Parametric Insurance Market Global Industry Analysis and Forecast (2026–2035) Revenue Forecast
Values in USD Billion

2025 $18.20 Billion
2025
2026 $20.30 Billion
2026
2027 $22.70 Billion
2027
2028 $25.37 Billion
2028
2029 $28.37 Billion
2029
2030 $31.71 Billion
2030
2031 $35.46 Billion
2031
2032 $39.64 Billion
2032
2033 $44.32 Billion
2033
2034 $49.55 Billion
2034
2035 $55.40 Billion
2035

Key Takeaways

By Peril Type: Weather Parametric held the largest share of approximately 30% (USD 5.46 billion) in 2025; Crop Yield Parametric is the fastest-growing sub-segment at 14.3% CAGR from 2026–2035.

By Trigger Mechanism: Index-Based Triggers held the largest share of approximately 55% (USD 10.01 billion) in 2025; Sensor-Based Triggers is the fastest-growing sub-segment at 19.2% CAGR from 2026–2035.

By Provider Type: Insurers held the largest share of approximately 40% (USD 7.28 billion) in 2025; Insurtech Platforms is the fastest-growing sub-segment at 21.0% CAGR from 2026–2035.

By Distribution Channel: Direct Sales held the largest share of approximately 41% (USD 7.46 billion) in 2025; Digital and Embedded Platforms is the fastest-growing sub-segment at 21.0% CAGR from 2026–2035.

By End User: Corporate Enterprises held the largest share of approximately 51% (USD 9.28 billion) in 2025; Agriculture is the fastest-growing sub-segment at 13.9% CAGR from 2026–2035.

By Coverage Scope: Natural Catastrophe Coverage held the largest share of approximately 66% (USD 12.01 billion) in 2025; Specialty Parametric Coverage is the fastest-growing sub-segment at 15.2% CAGR from 2026–2035.

By Enterprise Size: Large Enterprises held the largest share of approximately 58% (USD 10.56 billion) in 2025; Small and Medium Enterprises is the fastest-growing sub-segment at 14.9% CAGR from 2026–2035.

Dominant Region: North America dominated with approximately 37% revenue share (USD 6.73 billion) in 2025.

Fastest-Growing Region: Asia-Pacific is expected to register the highest CAGR of 16.9% during 2026–2035.

Dominant Country: U.S. led with approximately USD 4.58 billion in 2025.

Fastest-Growing Country: India is the fastest-growing country at approximately 21.0% CAGR from 2026–2035.

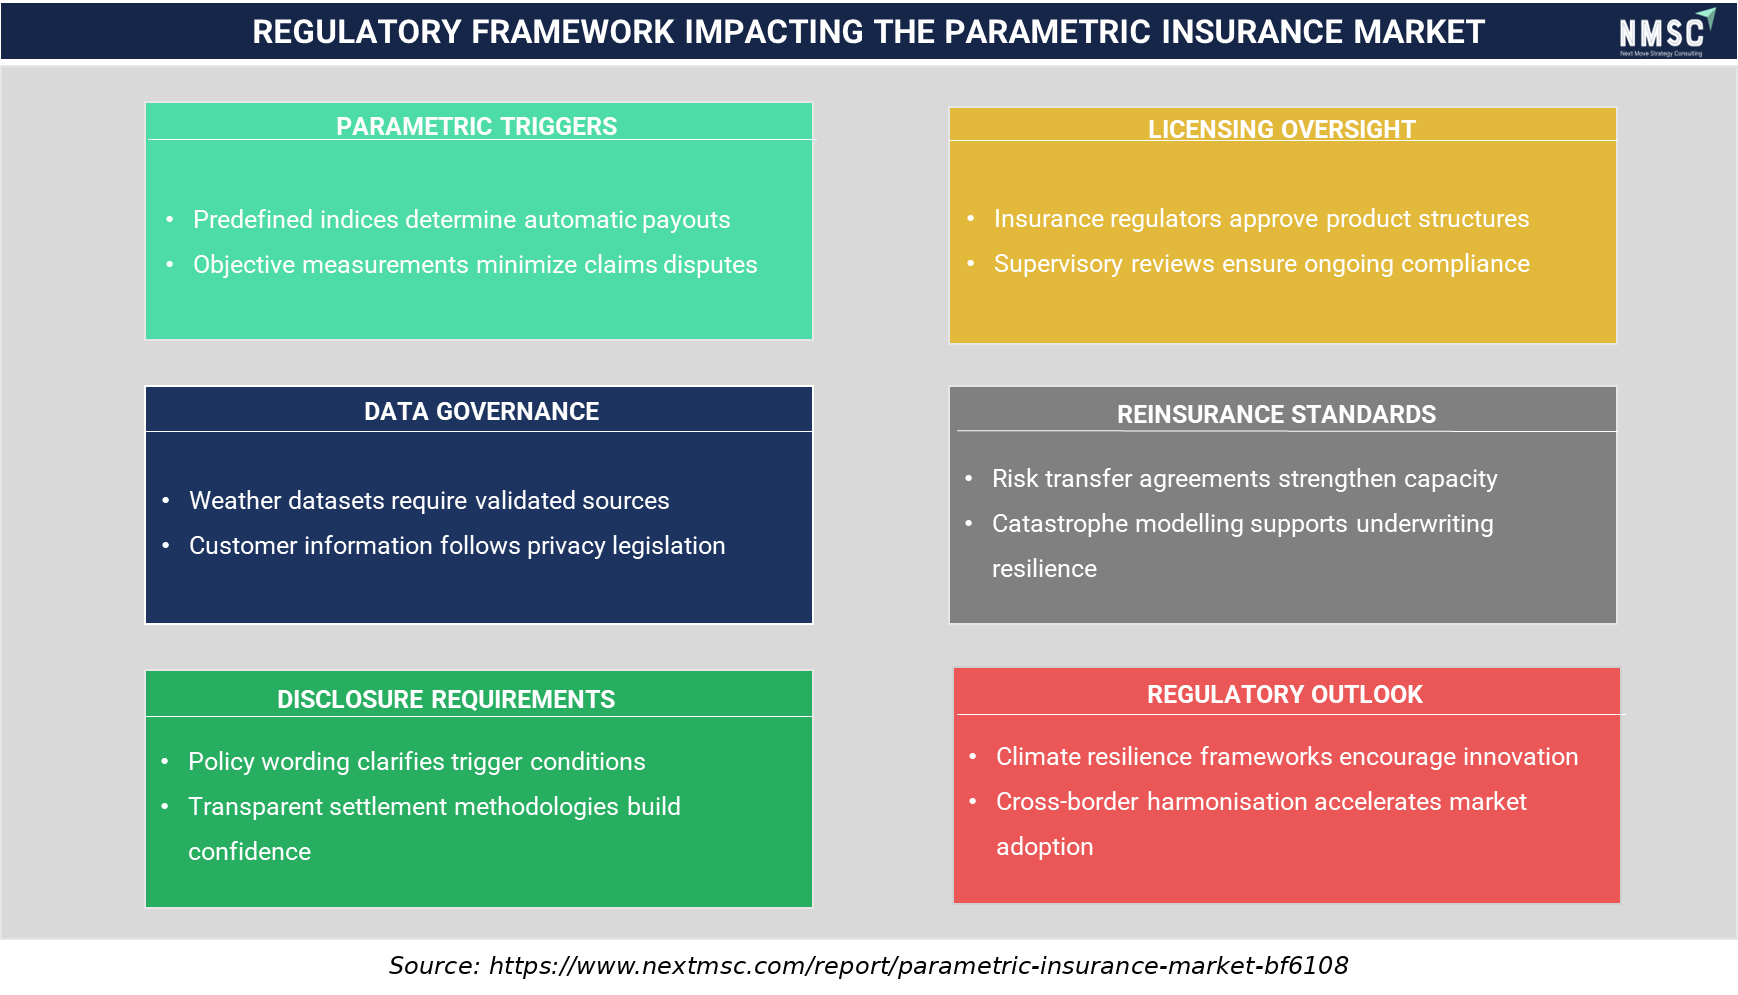
Regulatory Framework Impacting the Parametric Insurance Market
The regulatory framework for the parametric insurance market establishes standards for product approval, trigger transparency, data governance, reinsurance, and customer disclosures. Compliance with evolving insurance regulations enhances policy credibility, safeguards customer interests, supports accurate risk assessment, and promotes broader adoption of parametric insurance solutions through transparent, efficient, and reliable claims settlement mechanisms.

What Does the Parametric Insurance Market Encompass?
The parametric insurance market encompasses index-based risk transfer products that pay predetermined benefits upon the occurrence of a defined trigger event, such as a rainfall threshold, wind speed, or earthquake magnitude, rather than following traditional loss-adjustment processes. Our assessment indicates that the scope spans coverage for weather, earthquake, flood, cyclone, and crop yield perils, distributed by insurers, reinsurers, managing general agents, and insurtechplatforms to corporate enterprises, agriculture, government, and financial services end users worldwide.
The category has evolved from niche catastrophe bond structures into a mainstream complement to traditional property and casualty coverage, driven by rising climate volatility and a widening global protection gap. The Willis Natural Catastrophe Review reported that insured natural catastrophe losses exceeded USD 100 billion globally in 2025 for the seventh consecutive year, including insured losses from the Los Angeles wildfires alone. National insurance regulators, coordinated in the U.S. through the National Association of Insurance Commissioners, are increasingly clarifying parametric product licensing and disclosure treatment. We observed that technology adoption is shifting toward satellite-derived and IoT sensor triggers that reduce basis risk. NMSC's analysis indicates that this structural shift, combined with expanding reinsurance and insurance-linked securities capacity, is redefining product design across the parametric insurance market.

Market Drivers & Dynamics

Interactive Dataset
Rising frequency and severity of climate-related catastrophes driver +2.9% Global 2026-2035
Expanding reinsurance and ILS capacity for index-based risk driver +2.2% Global 2026-2035
Growth of insurtech distribution and embedded coverage driver +1.9% North America, Europe, Asia-Pacific 2026-2035
Rising protection gap awareness in emerging economies driver +1.5% Asia-Pacific, MEA, Latin America 2026-2035
Government-backed disaster risk financing programs driver +1.2% Asia-Pacific, MEA 2026-2035
Improving satellite and sensor data availability driver +1.0% Global 2026-2032
Basis risk between index triggers and actual losses restraint -1.3% Global 2026-2035
Limited regulatory clarity for parametric product licensing restraint -0.8% Asia-Pacific, MEA, Latin America 2026-2032
Low consumer familiarity versus traditional indemnity insurance restraint -0.6% Global 2026-2030
Source: Next Move Strategy Consulting

Growth Drivers

What Is the Primary Growth Driver of the Parametric Insurance Market?

Rising frequency and severity of climate-related catastrophes is the primary driver of the market. The Willis Natural Catastrophe Review found that global insured natural catastrophe losses exceeded USD 100 billion in 2025 for the seventh consecutive year, with Los Angeles wildfire losses alone. We observed that this trend, reinforced by expanding reinsurance capacity for index-based structures, continues to anchor baseline demand for weather and cyclone parametric coverage across developed and emerging economies alike.

How Is Insurtech Distribution Driving Parametric Insurance Market Growth?
Expansion of digital insurtech distribution is accelerating market growth by lowering policy issuance costs and reaching previously underserved corporate and small business segments. Descartes Underwriting's continued Asia-Pacific office expansion, including its Singapore and Sydney hubs, illustrates how specialist underwriters are scaling distribution alongside broker partners. Our assessment indicates that this distribution shift, combined with embedded coverage at point of sale, is compressing adoption timelines for digital and sensor-based parametric products.

Growth Inhibitors

What Is Restraining Parametric Insurance Market Expansion?
Basis risk, the mismatch between an index trigger and a policyholder's actual loss, restrains broader adoption among risk managers accustomed to indemnity-based claims certainty. Industry practitioner commentary compiled by Insurance Thought Leadership highlights that early parametric adopters in agriculture and earthquake coverage have had to demonstrate index reliability over multiple claims cycles to build buyer confidence. We found that improving data granularity from site-level sensors is gradually narrowing this gap, though adoption among conservative buyers remains slower than for traditional coverage.

Segmentation Analysis

2025 (USD Billion)
2035 (USD Billion)
Weather Parametric 2025: $5.46 Billion | 2035: $15.51 Billion
Weather Para
Earthquake Parametric 2025: $2.37 Billion | 2035: $6.65 Billion
Earthquake P
Flood Parametric 2025: $2.18 Billion | 2035: $7.20 Billion
Flood Parame
Cyclone/Hurricane Parametric 2025: $2.00 Billion | 2035: $6.09 Billion
Cyclone/Hurr
Crop Yield Parametric 2025: $4.00 Billion | 2035: $13.30 Billion
Crop Yield P
Other Peril Types 2025: $2.19 Billion | 2035: $6.65 Billion
Other Peril
Weather Parametric $5.46 Billion $15.51 Billion 12.3%
Earthquake Parametric $2.37 Billion $6.65 Billion 12.1%
Flood Parametric $2.18 Billion $7.20 Billion 13.9%
Cyclone/Hurricane Parametric $2.00 Billion $6.09 Billion 13.1%
Crop Yield Parametric $4.00 Billion $13.30 Billion 14.3%
Other Peril Types $2.19 Billion $6.65 Billion 13.1%

Which Peril Type Dominates the Parametric Insurance Market?

Weather parametric coverage dominates the peril type segmentation with approximately 30% share, reflecting the broad applicability of rainfall, temperature, and wind indices across agriculture, energy, and infrastructure risk pools; combined with earthquake, flood, and cyclone coverage, natural catastrophe-linked perils account for approximately two-thirds of total market revenue. We observed that crop yield parametric coverage is the fastest-growing sub-segment at 14.3% CAGR, as government-backed agricultural resilience programs and reinsurance capacity expansion make index-based crop protection increasingly accessible to farming operations.

2025 (USD Billion)
2035 (USD Billion)
Index-Based
Model-Based
Sensor-Based
Segment Item 2025 (USD Billion) 2035 (USD Billion) CAGR
Index-Based Triggers $10.0 USD Billion $40.0 USD Billion 25.0%
Model-Based Triggers $17.1 USD Billion $51.1 USD Billion 11.0%
Sensor-Based Triggers $24.2 USD Billion $62.2 USD Billion 25.0%

Segment-wise data is locked

Unlock complete segment-wise numbers for By Trigger Mechanism.

Unlock Full Data

Which Trigger Mechanism Is Fastest-Growing in the Parametric Insurance Market?

Index-based triggers held the largest share of the trigger mechanism segmentation in 2025 at approximately 55%, reflecting their established use across weather and crop insurance programs. Our findings suggest that sensor-based triggers are the fastest-growing sub-segment at 19.2% CAGR, driven by falling IoT hardware costs and rising demand for hyper-local trigger definitions that reduce basis risk in flood and energy business interruption applications, consistent with reports that a majority of new policies now use automated sensor-based triggers.

2025 (USD Billion)
2035 (USD Billion)
Insurers
Reinsurers
Managing Gen
Insurtech Pl
Segment Item 2025 (USD Billion) 2035 (USD Billion) CAGR
Insurers $10.0 USD Billion $40.0 USD Billion 27.0%
Reinsurers $17.1 USD Billion $51.1 USD Billion 9.0%
Managing General Agents $24.2 USD Billion $62.2 USD Billion 19.0%
Insurtech Platforms $31.3 USD Billion $73.3 USD Billion 17.0%

Segment-wise data is locked

Unlock complete segment-wise numbers for By Provider Type.

Unlock Full Data

Which Provider Type Leads the Parametric Insurance Market?

Insurers lead provider type segmentation with approximately 40% share, reflecting their direct underwriting relationships and balance sheet capacity for primary risk retention. We found that insurtech platforms are the fastest-growing provider category at 21.0% CAGR, as technology-native entrants such as Descartes Underwriting and Parametrix Insurance combine proprietary data platforms with managing general agent capacity arrangements to bring new parametric products to market faster than traditional carriers.

2025 (USD Billion)
2035 (USD Billion)
Direct Sales
Broker-Led
Bancassuranc
Digital and
Segment Item 2025 (USD Billion) 2035 (USD Billion) CAGR
Direct Sales $10.0 USD Billion $40.0 USD Billion 14.0%
Broker-Led $17.1 USD Billion $51.1 USD Billion 24.0%
Bancassurance $24.2 USD Billion $62.2 USD Billion 22.0%
Digital and Embedded Platforms $31.3 USD Billion $73.3 USD Billion 12.0%

Segment-wise data is locked

Unlock complete segment-wise numbers for By Distribution Channel.

Unlock Full Data
2025 (USD Billion)
2035 (USD Billion)
Corporate En
Agriculture
Government a
Financial In
Individual a
Segment Item 2025 (USD Billion) 2035 (USD Billion) CAGR
Corporate Enterprises $10.0 USD Billion $40.0 USD Billion 24.0%
Agriculture $17.1 USD Billion $51.1 USD Billion 22.0%
Government and Public Sector $24.2 USD Billion $62.2 USD Billion 20.0%
Financial Institutions $31.3 USD Billion $73.3 USD Billion 22.0%
Individual and Retail $38.4 USD Billion $84.4 USD Billion 13.0%

Segment-wise data is locked

Unlock complete segment-wise numbers for By End User.

Unlock Full Data
2025 (USD Billion)
2035 (USD Billion)
Natural Cata
Specialty Pa
Segment Item 2025 (USD Billion) 2035 (USD Billion) CAGR
Natural Catastrophe Coverage $10.0 USD Billion $40.0 USD Billion 23.0%
Specialty Parametric Coverage $17.1 USD Billion $51.1 USD Billion 9.0%

Segment-wise data is locked

Unlock complete segment-wise numbers for By Coverage Scope.

Unlock Full Data
2025 (USD Billion)
2035 (USD Billion)
Large Enterp
Small and Me
Segment Item 2025 (USD Billion) 2035 (USD Billion) CAGR
Large Enterprises $10.0 USD Billion $40.0 USD Billion 21.0%
Small and Medium Enterprises $17.1 USD Billion $51.1 USD Billion 23.0%

Segment-wise data is locked

Unlock complete segment-wise numbers for By Enterprise Size.

Unlock Full Data

Growth Opportunities

NMSC's analysis indicates that three whitespace opportunities stand out for providers and technology vendors positioning for the next phase of market expansion.

How Can Embedded Distribution Unlock SME Adoption?

Embedding parametric coverage within logistics, agriculture input, and energy platforms at the point of transaction offers providers a lower-friction path to small and medium enterprise adoption. This opportunity benefits insurtech platforms and managing general agents seeking scale without dedicated broker networks.

What Opportunity Does Multi-Peril Bundling Present for Providers?

Bundling multiple correlated perils, such as wind and flood, into single index products reduces policyholder complexity and improves capital efficiency for reinsurers. This mechanism benefits large enterprises and government risk pools seeking comprehensive climate protection under a single trigger framework.

How Can Emerging Market Risk Pools Expand Provider Reach?

Expanding government-backed regional risk pools across Asia-Pacific, Africa, and Latin America creates opportunity for reinsurers and MGAs to underwrite sovereign and agricultural parametric programs at scale. This mechanism benefits agricultural cooperatives and public sector entities in climate-exposed emerging economies.

Regional Outlook

2025 (USD Billion)
2035 (USD Billion)
North Americ
Europe
Asia-Pacific
Middle East
Latin Americ
Region 2025 (USD Billion) 2035 (USD Billion) CAGR (%)
North America $10.0 USD Billion $40.0 USD Billion 9.0%
Europe $17.1 USD Billion $51.1 USD Billion 27.0%
Asia-Pacific $24.2 USD Billion $62.2 USD Billion 25.0%
Middle East & Africa $31.3 USD Billion $73.3 USD Billion 23.0%
Latin America $38.4 USD Billion $84.4 USD Billion 12.0%

Regional data is locked

Unlock complete regional numbers for this market.

Unlock Full Data

Competitive Landscape

Our findings suggest that the parametric insurance industry is moderately consolidated, with global reinsurers competing alongside specialized insurtech underwriters and program facilitators.

Dimension Description
Market Structure Moderately consolidated, with the top ten companies accounting for the majority share of global parametric premium volume.
Innovation Focus Satellite and IoT-derived index design, multi-peril bundling, and rapid automated claims settlement.
M&A Activity Active, with insurers and reinsurers acquiring or partnering with insurtech underwriting platforms to broaden index-based product capabilities.

How Do Companies Compete in the Parametric Insurance Market?

Companies compete primarily on index accuracy, claims settlement speed, and reinsurance capacity depth across catastrophe and agricultural risk pools. NMSC's analysis indicates that vendors differentiate through proprietary data partnerships, program facilitation breadth, and financing-friendly premium structures for emerging market buyers. Competitive rivalry is most intense in weather and crop yield categories, where multiple established reinsurers offer comparable core index capability, pushing differentiation toward data quality and service speed.

Which Competitive Archetypes Dominate the Parametric Insurance Industry?

Two archetypes dominate: global reinsurance leaders such as Swiss Re Ltd and Munich Re that combine deep balance sheet capacity with global distribution, and specialized insurtech underwriters such as Descartes Underwriting and FloodFlash Ltd that compete on proprietary data platforms and rapid digital issuance. Our analysis shows that scale advantages favor global leaders in sovereign and large enterprise accounts, while specialists retain share in niche peril and SME segments.

What Innovation and Differentiation Strategies Define Market Leadership?

Leading providers are investing in satellite-derived index calibration, IoT sensor integration, and rapid automated settlement to differentiate beyond traditional index design alone. We observed that Swiss Re's rapid-settlement hurricane products and Parametrix Insurance's cloud-outage monitoring illustrate how providers are bundling data analytics capability with risk transfer capacity to deepen customer relationships and improve index accuracy over policy lifecycles.

How Active Is M&A and Partnership Activity in the Parametric Insurance Market?

Partnership and coverholder activity remains active, exemplified by Descartes Underwriting's 2025 Lloyd's coverholder agreement with OAK Global and its parametric wind partnership with solar technology provider Nextpower. We found that similar capacity partnerships between specialist insurtech underwriters and rated reinsurers are likely to continue as larger carriers seek to expand parametric capabilities across additional peril categories and geographies.

Key Market Players

Our assessment identifies the following companies as the leading participants shaping competitive dynamics in the parametric insurance market.

Swiss Re Ltd Münchener Rückversicherungs-Gesellschaft Aktiengesellschaft in München (Munich Re) AXA SA Allianz SE Zurich Insurance Group AG Chubb Limited American International Group, Inc. Hannover Rück SE SCOR SE Sompo Holdings, Inc. Tokio Marine Holdings, Inc. MS&AD Insurance Group Holdings, Inc. QBE Insurance Group Limited Society of Lloyd's Beazley plc Descartes Underwriting SAS FloodFlash Limited Arbol, Inc. Parametrix Insurance Services Ltd Jumpstart Insurance Solutions, Inc.

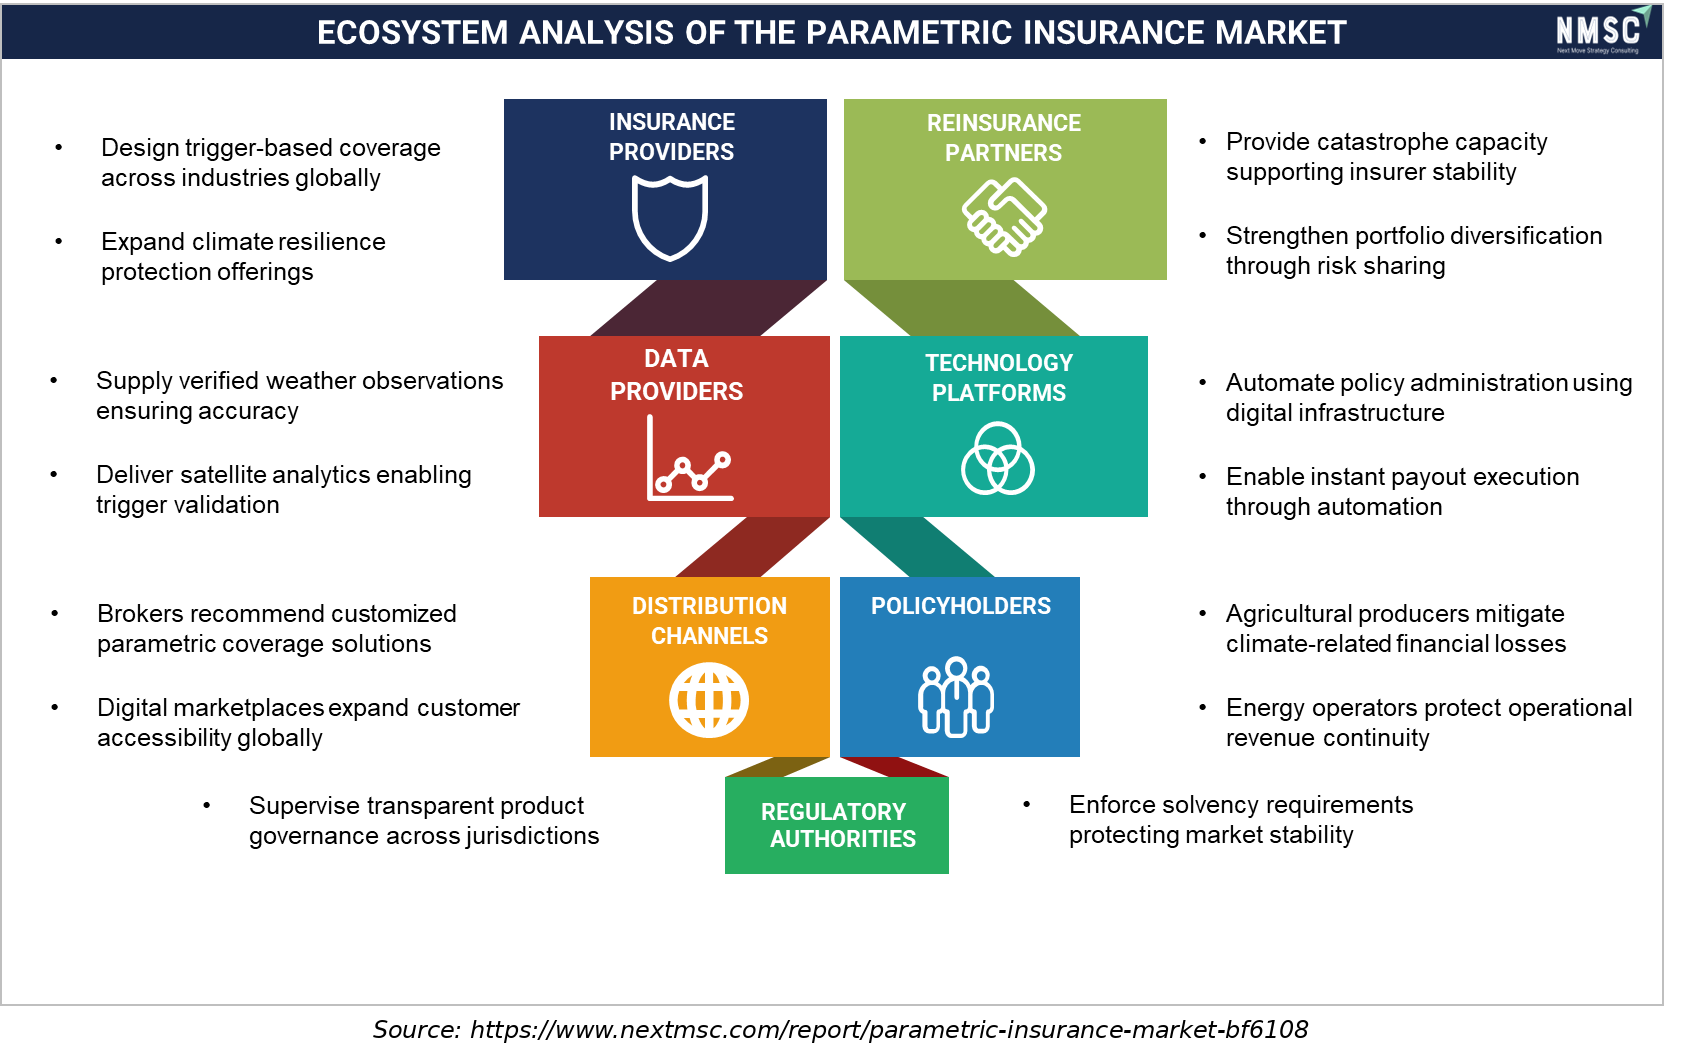
Ecosystem Analysis of the Parametric Insurance Market

The parametric insurance market ecosystem connects insurers, reinsurers, data providers, technology platforms, distribution partners, policyholders, and regulatory authorities. Effective collaboration among these stakeholders enables accurate trigger validation, automated policy administration, secure data management, regulatory compliance, and efficient claims processing, fostering innovation, operational resilience, and greater adoption of parametric insurance solutions across diverse industries.

Latest Developments

We observed the following recent developments shaping competitive positioning across the parametric insurance industry.

Date Event
Jun 2026 Swiss Re said it recently established a Parametric Centre in its reinsurance unit, giving clients, brokers, data providers, and technical partners a clearer entry point for parametric discussions across markets and perils.
May 2026 QBE said it is expanding its property offerings to include parametric coverage through an enhanced partnership with K2, pointing to demand for faster and more transparent catastrophe protection.
Feb 2026 Arbol and Pollen Systems announced a first-of-its-kind product that combines parametric insurance with real-time satellite, drone, field, and historical data to modernize crop and climate risk insurance.
Jan 2026 Descartes launched a flexible parametric product suite for data center lenders, investors, and operators, targeting high-severity natural catastrophe losses during construction or operational phases.
Oct 2025 Chubb launched Travel Pro, a parametric travel product that can be embedded into booking channels and is designed to deliver quick payouts for travel disruptions.

Expert Insights

Tim McCosh

Founder & CEO | Yokahu

"Parametric insurance has long been heralded as a solution for fast, reliable disaster payouts, but inefficiencies in placement have hindered adoption."

Analyst Interpretation

The statement underscores that while parametric insurance is widely recognized for its ability to deliver rapid, transparent payouts based on predefined event triggers, market adoption has been constrained by inefficiencies in the placement process. Traditional placement methods can be complex and time-consuming, limiting scalability across insurers, brokers, and reinsurers. The emergence of digital exchanges and automated underwriting platforms is expected to simplify policy structuring, improve broker access, reduce transaction friction, and accelerate the commercialization of parametric insurance solutions. This digital transformation is anticipated to support broader adoption across climate risk, agriculture, energy, infrastructure, and catastrophe insurance markets.

Investment Opportunities

Where Are Capital Inflows Concentrated in the Parametric Insurance Market?

Capital inflows are concentrated in data infrastructure and index-modeling technology, as reinsurers and insurtech platforms seek to narrow basis risk. We observed that Descartes Underwriting's total funding of over USD 138 million across its Series A and Series B rounds, backed by investors including BlackFin Capital Partners, reflects continued private investment in climate risk management platforms, supplementing incumbent reinsurer R&D budgets and accelerating index calibration capability across the industry.

How Significant Is Infrastructure Investment in Supporting Market Growth?

Government-backed disaster risk financing infrastructure, particularly across Asia-Pacific and the Middle East, is expanding the addressable base for sovereign parametric risk pools. Our assessment indicates that national food security and climate resilience programs are funding regional risk pool infrastructure, directly supporting reinsurer and MGA program growth over the forecast period.

What ESG Considerations Are Shaping Investment in Parametric Insurance?

Environmental, social, and governance considerations increasingly favor parametric products that demonstrably close protection gaps for climate-vulnerable populations. We found that investors and development finance institutions are prioritizing providers demonstrating measurable resilience outcomes, aligning capital allocation with broader sustainable finance disclosure expectations across the insurance value chain.

Key Benefits for Stakeholders

How Does This Report Benefit Industry Leaders and Enterprise Decision-Makers?

This report equips insurer, reinsurer, and MGA leadership with segmented demand data, competitive benchmarking, and regional growth projections to prioritize capital allocation across parametric product lines. NMSC's analysis indicates that decision-makers can use the segmentation and driver-restraint analysis to align product development timing with regulatory and climate exposure pressures shaping their specific peril and geography focus.

How Does This Report Benefit Investors and Financial Analysts?

Investors and financial analysts gain access to independently derived market sizing, CAGR trajectories, and competitive landscape analysis supporting valuation and diligence work across reinsurers and insurtech underwriting platforms. Our assessment indicates that the regional and segment-level detail supports comparative analysis of growth exposure across public and private company portfolios.

How Does This Report Benefit Technology Vendors and Product Teams?

Technology vendors and product teams can use the segmentation by trigger mechanism, provider type, and distribution channel to identify underserved product categories and prioritize data platform versus distribution investment. We observed that the driver-restraint and opportunity analysis directly informs go-to-market sequencing across regions with differing regulatory and adoption maturity.

Key Market Segments Evaluated

By Peril Type

  • Weather Parametric
  • Earthquake Parametric
  • Flood Parametric
  • Cyclone/Hurricane Parametric
  • Crop Yield Parametric
  • Other Peril Types

By Trigger Mechanism

  • Index-Based Triggers
  • Model-Based Triggers
  • Sensor-Based Triggers

By Provider Type

  • Insurers
  • Reinsurers
  • Managing General Agents
  • Insurtech Platforms

By Distribution Channel

  • Direct Sales
  • Broker-Led
  • Bancassurance
  • Digital and Embedded Platforms

By End User

  • Corporate Enterprises
  • Agriculture
  • Government and Public Sector
  • Financial Institutions
  • Individual and Retail
  • Other End Users

By Coverage Scope

  • Natural Catastrophe Coverage
  • Specialty Parametric Coverage

By Enterprise Size

  • Large Enterprises
  • Small and Medium Enterprises

Conclusion & Recommendations

The long-term outlook remains strongly positive, with the market expected to nearly triple from USD 20.30 billion in 2026 to USD 55.40 billion by 2035 at a 11.8% CAGR. We observed that structural drivers, including rising climate volatility and expanding reinsurance capacity, are durable rather than cyclical, supported by insured natural catastrophe losses exceeding USD 100 billion globally for the seventh consecutive year in 2025, and are expected to sustain double-digit growth across sensor-based and insurtech-distributed products through the forecast period.

What Strategic Positioning Should Providers Pursue?

Providers should prioritize satellite and sensor-integrated index platforms that reduce basis risk, while building insurtech distribution and coverholder partnerships to reach small and medium enterprise buyers. Our assessment indicates that reinsurers combining balance sheet capacity with data-driven index design will be best positioned to defend margin as competitive intensity rises across commoditizing weather index categories.

How Attractive Is the Market for New Investment?

The market presents attractive investment characteristics given its high growth trajectory, expanding reinsurance capacity, and exposure to durable climate-driven demand tailwinds. We found that insurtech platforms and sensor-based triggers, growing at 21.0% and 19.2% CAGR respectively, represent the most attractive entry points for technology-focused investors and strategic acquirers.

What Market Shifts and Key Risks Should Stakeholders Monitor?

Stakeholders should monitor the shift toward data-driven index design and the basis risk that remains a key adoption barrier among conservative risk managers. Our analysis shows that limited regulatory clarity in select emerging markets remains a key risk to program scale, while low consumer familiarity relative to traditional indemnity insurance could delay adoption in nascent geographies.

What Growth Pathways Should Companies Prioritize?

Companies should prioritize growth pathways centered on multi-peril bundling for capital efficiency, embedded distribution for SME reach, and geographic expansion into Asia-Pacific and Latin American disaster risk financing programs. NMSC's analysis indicates that these pathways offer the most direct route to capturing the USD 35.10 billion absolute dollar opportunity identified between 2026 and 2035.

FAQs

About the Author

Mihul Sharma

Mihul Sharma

Mihul Sharma is Research Associate at Next Move Strategy Consulting, where he has covered technology, industrial, and healthcare markets for 3 years. His work applies structured business research, market analysis, and secondary-source review to assess market trends, competitive developments, and growth opportunities. He supports report development by fully synthesizing industry data, company information, and market signals into concise findings for strategy and investment-focused research teams.

About the Reviewer

Supradip Baul

Supradip Baul

Supradip Baul is an accomplished business consultant and strategist with over a decade of rich experience in market intelligence, strategy, technology, and business transformation. His work has included rigorous qualitative and quantitative analysis across multiple industries, helping clients shape investment decisions and long-term roadmaps. Earlier in his career, he was associated with Gartner, where he contributed to industry-leading reports and market share analyses. He has worked with leading global companies and holds an MBA with a dual specialization in Marketing and Finance.

Download Free Sample

Kishu Kanda

KISHU KANDA

Strategy Analyst

Accenture

We purchased the AI Consumer Market Report from this company. Not only did they customize the report to meet our specific requirements, but they also showed great flexibility in accommodating our budget. The report we received fully met our expectations. Additionally, they provided prompt and thorough responses to both our pre-purchase and follow-up questions. We look forward to working with this company again in the future.

Gustaf Hummel Burstrom

GUSTAF HUMMEL BURSTROM

Founder

Revline Tools AB

Joseph and the team at Next Move Strategy Consulting have been excellent to work with, in supplying us with relevant market data and forecasts for our specific category. We had some special requirements and they were able to do a custom package to suit our needs. We would definitely recommend them to any other company needing market data and forecasts

Rishabh Jogani

RISHABH JOGANI

Strategy Analyst

Accenture Japan

We are incredibly impressed with the market report on the real estate market in India provided by Next Move Strategy Consulting. The report was thorough, insightful, and well-structured, offering deep analysis and actionable recommendations. It not only captured the current trends and dynamics but also provided a forward-looking perspective that has been invaluable for our strategic planning. Their team demonstrated exceptional professionalism, attention to detail, and a profound understanding of the industry. The data-driven insights and clarity of presentation exceeded our expectations, making complex market trends easy to understand. We highly recommend Next Move Strategy Consulting to anyone looking for reliable and comprehensive market research services. Their expertise has given us the confidence to navigate the complexities of the Indian real estate market with clarity and foresight.

Robert Sean Trevino

ROBERT SEAN TREVINO

Sr. Director, Head of Strategic Insights & Analytics

Foundation Medicine

I realized that it was a reliable source of information. These days, there are many people who are looking for authentic data, and this is one of the only sources that can offer them with what they need;

Mohit Agarwal

MOHIT AGARWAL

Chief Manager

DryChem India Pvt. Ltd.

Next Move Strategy Consulting is an amazing team of consultants. We required a market study report for our investors on top priority and the team went above and beyond our expectations to deliver the same with ample supporting data within a short time span enabling us to secure the investments and keep our project timeline maintained. Their professionalism, attention to detail, and timely delivery of actionable recommendations have left a lasting impression on our organization.

Custom Market Research Services

We will customize the research for you if the listed report does not fully match your requirements.

Get 30% Free Customization

Select License

This website uses cookies to ensure you get the best experience on our website. Learn more

✖