CCS Charging Connector Market Global Industry Analysis and Forecast (2026–2035)

The CCS Charging Connector Market size was USD 4.28 Billion in 2025, projected to reach USD 21.73 Billion by 2035, growing at a CAGR of 17.52% from 2026 to 2035. Key drivers include European regulations, fast-charging infrastructure expansion, and truck electrification, with Europe leading the market.

Download Free Sample PDF
Base Year (2025)
$4.28 Billion
Forecast (2035)
$21.73 Billion
CAGR (2026-2035)
17.5%
Top Region
Europe

What is the CCS Charging Connector Market Size?

The global CCS Charging Connector Market reached USD 4.28 Billion in 2025 and is estimated at USD 5.08 Billion in 2026, forecast to reach USD 21.73 Billion by 2035 at a 17.52% CAGR from 2026 to 2035. Europe leads with about 45% share, while charging cable assemblies hold about 43% of revenue.
Our assessment indicates that three segmentation axes and five regions shape revenue concentration across the forecast period.

CCS Charging Connector Market Global Industry Analysis and Forecast (2026–2035) Revenue Forecast

Values in USD Billion

2025 $4.28 Billion
2025
2026 $5.08 Billion
2026
2027 $5.97 Billion
2027
2028 $7.02 Billion
2028
2029 $8.25 Billion
2029
2030 $9.69 Billion
2030
2031 $11.39 Billion
2031
2032 $13.38 Billion
2032
2033 $15.73 Billion
2033
2034 $18.48 Billion
2034
2035 $21.73 Billion
2035

Key Takeaways

By Product Type: Charging cable assemblies held the largest share, expanding from USD 1.83 Billion in 2025 to USD 9.98 Billion by 2035, and they are also the fastest growing at 18.5% CAGR from 2026–2035.

By Standard Variant: CCS2 led the field, rising from USD 2.92 Billion in 2025 to USD 17.53 Billion by 2035; CCS2 also records the quickest growth at 19.6% CAGR from 2026–2035.

By Charging Power Rating: Up to 150 kW commanded the biggest share, moving from USD 2.10 Billion in 2025 to USD 5.20 Billion by 2035; Above 350 kW is the fastest growing at 27.3% CAGR from 2026–2035.

Dominant Region: Europe, growing from USD 1.95 Billion in 2025 to USD 9.20 Billion by 2035, with about 45.3% of 2026 revenue.

Fastest-Growing Region: Latin America at 21.0% CAGR from 2026–2035, climbing from USD 0.20 Billion in 2025 to USD 1.33 Billion by 2035.

Dominant Country: U.S. leads with USD 0.82 Billion in 2025 and a projected USD 3.10 Billion by 2035.

Fastest-Growing Country: Malaysia expands at 25.1% CAGR from 2026–2035, rising from USD 0.03 Billion in 2025 to USD 0.30 Billion by 2035.

The market adds an absolute opportunity of USD 16.65 Billion between 2026 and 2035, a strong signal for capital allocation.

According to NMSC analysis, cooled cable assemblies above 350 kW carry the steepest growth because heat limits currents in conventional copper cables.

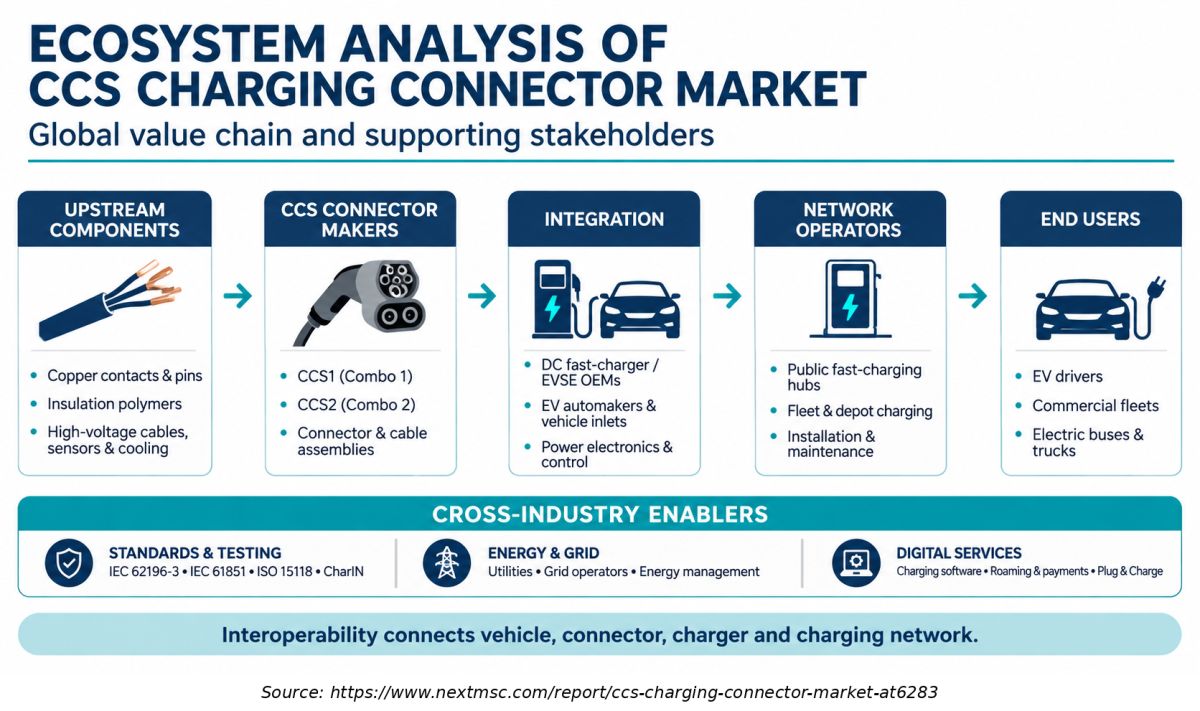
Ecosystem Analysis of the CCS charging connector market

The Ecosystem Analysis infographic illustrates the complete value chain of the CCS Charging Connector Market, highlighting key stakeholders from upstream component suppliers and connector manufacturers to EV manufacturers, charging infrastructure providers, network operators, and end users. It also emphasizes the importance of industry standards, energy and grid infrastructure, and digital charging services in supporting market development and interoperability

What Does the CCS Charging Connector Market Encompass?

The CCS Charging Connector Market covers vehicle inlets, charging plugs and charging cable assemblies built to the Combined Charging System, which adds two high current DC contacts beneath an AC interface. CCS1 extends the Type 1 interface used in North America and South Korea, while CCS2 extends the Type 2 interface specified for public DC chargers across Europe. This market report measures manufacturer revenue from these components and excludes EV charging stations, vehicles and software.
Market Drivers & Dynamics

Interactive Dataset
AFIR mandate for CCS2 on public DC chargers and TEN-T corridor hubs driver +3.2% Europe 2026–2030
Public charging expansion and rising fast charger share driver +2.9% Global 2026–2035
Truck and bus electrification needing high current inlets driver +2.4% Europe, North America, Asia-Pacific 2027–2035
Liquid cooled and megawatt class CCS cable assemblies driver +1.8% Europe, Asia-Pacific 2026–2032
Bidirectional capable connector designs driver +0.9% Europe, Asia-Pacific 2028–2035
NACS (SAE J3400) adoption reducing CCS1 additions restraint −2.1% North America 2026–2030
Small share of vehicles able to use chargers above 250 kW restraint −1.0% Global 2026–2030
Contact metal cost volatility for copper and silver restraint −0.8% Global 2026–2028
Source: Next Move Strategy Consulting

Growth Drivers

What is the primary growth driver of the CCS Charging Connector Market?

Regulation drives demand more than any other factor. Regulation (EU) 2023/1804 requires light-duty vehicle charging pools at maximum intervals of 60 km along the TEN-T core network, subject to specified power requirements and implementation deadlines. Heavy-duty charging infrastructure follows separate phased coverage and power-output requirements, including distinct provisions for TEN-T core and comprehensive networks. CCS2 is the DC connector it specifies. Each hub multiplies plug and cable assembly demand, while vehicles need matching inlets. We observed that this predictable mandate lowers revenue risk for suppliers in the CCS Charging Connector Market that focus on Europe.
How is public charging expansion driving the market growth?

The IEA reports that nearly 1.8 million public charging points were added worldwide in 2025, growth of more than 33 percent that lifted the stock beyond 7 million. The IEA reports that the share of fast and ultra-fast public charging points increased faster than the share of slow charging points in 2025, although it does not establish a 45% share of new installations. Each CCS-compatible DC charging point requires compatible charging connectors and associated cable assemblies, while replacement demand depends on utilisation levels, operating conditions, equipment quality and maintenance requirements. Our analysis shows that wear and replacement add a recurring revenue layer.

Growth Inhibitors

What is restraining the CCS Charging Connector Market?

North America presents the main restraint. Ford, General Motors, Hyundai, Rivian, Tesla and Volvo told the Federal Highway Administration in April 2024 that the overwhelming majority of vehicles and site hosts would benefit from J3400 connectors by 2026, and they urged technology neutral rules. CCS1 therefore faces slower growth while adapters bridge older vehicles. The IEA's Global EV Outlook 2026 reports that electric cars capable of using chargers above 250 kW represent less than 5% of the global electric vehicle stock, indicating that near-term demand for ultra-high-power charging infrastructure remains limited.

What Are the Growth Opportunities?

How Can Suppliers Capture Truck and Bus Charging Demand?

TE Connectivity lists box mount CCS1 and CCS2 inlets with direct busbar connection for trucks, buses and other commercial vehicles, supporting continuous currents up to 500 A. Fleets need depot charging that finishes within shifts, so demand shifts toward high current inlets in the vehicle inlets segment and cooled assemblies above 350 kW. Suppliers that qualify for heavy duty platforms secure multiyear volumes and higher unit values.

Where Does Replacement Demand Create Recurring Revenue?

Amphenol lists a CCS2 charging cable assembly rated at 380 A continuous current and up to 700 A in Boost Mode, with integrated metering capability, replaceable contacts and mating face, and 10,000 mating cycles. Operators replace worn plugs and cables during site lifetimes, and metering inputs help them meet billing rules. The charging plugs and charging cable assemblies segments benefit most, since replacement cycles recur every few years on busy fast charging sites.

What Opportunity Do Emerging Regions Offer for CCS2 Hardware?

Latin America grows at 21.0% CAGR from 2026, the fastest among regions, as CCS2 hardware enters new highway corridors and assembly plants. Distributors that combine certified inlets and cable assemblies with local technical support can win early share. The CCS2 segment is the main beneficiary because importers and charger builders in these regions standardize on it from the first deployment.

Segmentation Analysis

2025 (USD Billion)
2035 (USD Billion)
Vehicle inlets 2025: $1.45 Billion | 2035: $7.15 Billion
Vehicle inle
Charging plugs 2025: $1.00 Billion | 2035: $4.60 Billion
Charging plu
Charging cable assemblies 2025: $1.83 Billion | 2035: $9.98 Billion
Charging cab
Vehicle inlets $1.45 Billion $7.15 Billion 17.0%
Charging plugs $1.00 Billion $4.60 Billion 16.4%
Charging cable assemblies $1.83 Billion $9.98 Billion 18.5%

Which Product Type Leads the Market and Which Grows Fastest?

Charging cable assemblies lead because operators buy plug, cable and strain relief as a tested unit, and the segment grows at 18.5% CAGR from 2026 to 2035 as cooled designs spread. Vehicle inlets follow at 17.0%, supported by platform awards for suppliers such as TE Connectivity and Phoenix Contact. Charging plugs sold as loose bodies grow at 16.4% because replacement parts and custom cable builds rely on them.

2025 (USD Billion)
2035 (USD Billion)
CCS2
CCS1
Segment Item 2025 (USD Billion) 2035 (USD Billion) CAGR
CCS2 $10.0 USD Billion $40.0 USD Billion 14.0%
CCS1 $17.1 USD Billion $51.1 USD Billion 16.0%

Segment-wise data is locked

Unlock complete segment-wise numbers for By Standard variant.

Unlock Full Data
2025 (USD Billion)
2035 (USD Billion)
Up to 150 kW
151–350 kW
Above 350 kW
Segment Item 2025 (USD Billion) 2035 (USD Billion) CAGR
Up to 150 kW $10.0 USD Billion $40.0 USD Billion 21.0%
151–350 kW $17.1 USD Billion $51.1 USD Billion 19.0%
Above 350 kW $24.2 USD Billion $62.2 USD Billion 17.0%

Segment-wise data is locked

Unlock complete segment-wise numbers for By Charging power rating.

Unlock Full Data

Growth Opportunities

NMSC's analysis indicates that three opportunity pools offer the clearest route to share gains before 2035.

How Can Suppliers Capture Truck and Bus Charging Demand?

TE Connectivity lists box mount CCS1 and CCS2 inlets with direct busbar connection for trucks, buses and other commercial vehicles, supporting continuous currents up to 500 A. Fleets need depot charging that finishes within shifts, so demand shifts toward high current inlets in the vehicle inlets segment and cooled assemblies above 350 kW. Suppliers that qualify for heavy duty platforms secure multiyear volumes and higher unit values.

Where Does Replacement Demand Create Recurring Revenue?

Amphenol lists a CCS2 charging cable assembly rated at 380 A continuous current and up to 700 A in Boost Mode, with integrated metering capability, replaceable contacts and mating face, and 10,000 mating cycles. Operators replace worn plugs and cables during site lifetimes, and metering inputs help them meet billing rules. The charging plugs and charging cable assemblies segments benefit most, since replacement cycles recur every few years on busy fast charging sites.

What Opportunity Do Emerging Regions Offer for CCS2 Hardware?

Latin America grows at 21.0% CAGR from 2026, the fastest among regions, as CCS2 hardware enters new highway corridors and assembly plants. Distributors that combine certified inlets and cable assemblies with local technical support can win early share. The CCS2 segment is the main beneficiary because importers and charger builders in these regions standardize on it from the first deployment.

Regional Outlook

2025 (USD Billion)
2035 (USD Billion)
North Americ
Europe
Asia-Pacific
Middle East
Latin Americ
Region 2025 (USD Billion) 2035 (USD Billion) CAGR (%)
North America $10.0 USD Billion $40.0 USD Billion 9.0%
Europe $17.1 USD Billion $51.1 USD Billion 27.0%
Asia-Pacific $24.2 USD Billion $62.2 USD Billion 25.0%
Middle East & Africa $31.3 USD Billion $73.3 USD Billion 23.0%
Latin America $38.4 USD Billion $84.4 USD Billion 12.0%

Regional data is locked

Unlock complete regional numbers for this market.

Unlock Full Data

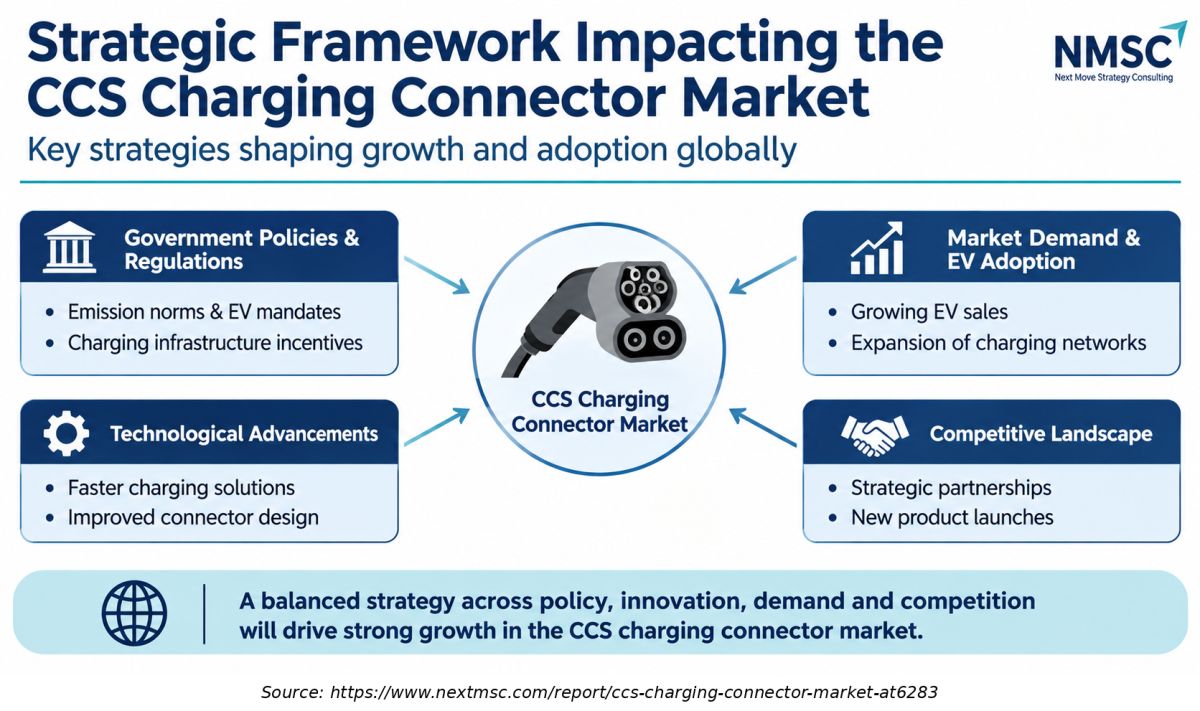
Strategic Framework Impacting the CCS charging connector market

Strategic Framework Impacting the CCS charging connector market
The Strategic Framework infographic highlights the major factors influencing the growth and development of the CCS Charging Connector Market. It focuses on government policies and regulations, technological advancements, market demand and EV adoption, and the competitive landscape. These factors collectively shape market expansion, product innovation, infrastructure investment, and the adoption of CCS charging technologies globally

Competitive Landscape

Our findings suggest that the industry rewards engineering depth, certification records and early platform awards over low unit pricing.

How Do Companies Compete in the CCS Charging Connector Market?

Competition centers on current rating, thermal performance, certification and integration support. Global groups such as TE Connectivity and Amphenol leverage manufacturing scale and automotive qualification, while Phoenix Contact, MENNEKES and HARTING compete through their mobility-focused product portfolios and engineering capabilities. Geographic expansion follows vehicle platform awards, and pricing rewards volume contracts for inlets while premium pricing holds for cooled assemblies. We observed that quality records and IEC certificates outweigh unit price in tenders.

Which Supplier Archetypes Dominate the CCS Charging Connector Market?

Three prominent supplier categories participate in the CCS Charging Connector Market: diversified interconnect manufacturers, European engineering specialists and Asian precision component manufacturers. Each category follows a different differentiation strategy based on product engineering, integration capabilities and manufacturing scale. Groups win on global qualification, specialists on integrated controllers and cooled systems, and Asian makers such as JAE and K.S. Terminals on broad current ratings and bidirectional designs. Buyers often multi source across archetypes to protect supply continuity.

How Do Suppliers Differentiate Through Innovation?

Innovation concentrates on current capacity and system integration. Phoenix Contact offers cooled CCS cables for up to 1,000 kW, K.S. Terminals lists a 500 A liquid cooled connector, Amphenol markets a 380 A replaceable plug with metering lines, and TE Connectivity supplies busbar inlets rated up to 500 A for trucks and buses. Each design reduces heat and installation effort, which shortens commissioning time for site builders.

What Is the Level of M&A Activity?

No acquisition specific to CCS connectors was identified in the verified evidence for 2025 and 2026, so competitive moves rely on organic product launches and certification programs. Larger groups retain capacity to acquire cooling or cable specialists, and Amphenol's partnership with a water-cooled cable maker shows that collaboration is preferred. Investors should watch for deals that bundle cables, cooling and control electronics.

Key Market Players

Based on research conducted by NMSC, we found that the following companies are verified through official company materials, listed in ranked order.

TE Connectivity plc Amphenol Corporation PHOENIX CONTACT GmbH & Co. KG MENNEKES Elektrotechnik GmbH & Co. KG HARTING Stiftung & Co. KG Japan Aviation Electronics Industry, Limited K.S. Terminals Inc.

Expert Insights

Erika Myers

Erika Myers

Executive Director | CharIN Inc.

"Interoperability isn’t just about technology: it’s about collaboration, transparency, and continuous testing to ensure all pieces of the charging ecosystem work together seamlessly."

Analyst Interpretation

The statement emphasizes the importance of interoperability testing in improving EV charging reliability and compatibility. CCS connector manufacturers must ensure that their products integrate effectively with vehicle inlets, charging equipment, and communication systems. This increases the importance of standardized testing, product certification, electrical safety, and consistent performance, encouraging manufacturers to develop reliable and technologically advanced charging connectors

Investment Opportunities

Where Are Capital Inflows Concentrated in the CCS Charging Connector Market?

We observed that capital flows toward high current and cooled assemblies, where margins exceed those of standard inlets. Supplier capacity additions follow vehicle platform awards in Europe and commercial vehicle programs in North America and Asia Pacific. Investors can track launches such as the Phoenix Contact integrated controller inlet, scheduled for series production in the third quarter of 2026, as signals of committed capacity. Cumulative revenue expansion of USD 16.65 Billion through 2035 rewards early capacity.

What Role Does Infrastructure Investment Play?

Investment in EV charging infrastructure can support connector demand, but the opportunity depends on the share of charging installations using CCS standards, charging power requirements and the proportion of installations requiring replacement connector assemblies. Utilities and operators’ pair fast sites with battery energy storage to manage grid limits, which raises the duty cycle of plugs and cables. Higher duty cycles increase replacement demand and favor suppliers with proven mating cycle ratings.

Which ESG Considerations Matter for Investors?

ESG screening focuses on material use, product life and energy losses. Silver plated contacts lower insertion force and heat, as MENNEKES notes for its inlets, while replaceable plug designs such as the Amphenol 380 A assembly rated for 20,000 cycles extend service life and reduce waste. Lower temperature rise cuts energy losses at high currents. Investors should evaluate suppliers based on material transparency, product durability, repairability, recyclability and manufacturing quality-management certifications, including IATF 16949 where applicable.

Key Benefits for Stakeholders

How Do Vehicle Makers and Fleet Operators Benefit?

Vehicle makers gain a clear view of inlet demand in the CCS Charging Connector Market, with vehicle inlets reaching USD 7.15 Billion by 2035, and of the shift toward integrated controllers and higher currents. Fleet operators can use the power rating analysis to match depot charging to shift patterns and to judge when cooled assemblies justify their cost. Regional forecasts help both groups plan platform launches around CCS2 in Europe and dual standard needs in North America.

How Do Investors and Financial Analysts Benefit?

Investors receive a reconciled forecast from USD 5.08 Billion in 2026 to USD 21.73 Billion by 2035, with segment and country growth rates that expose where returns concentrate. The restraint analysis flags the NACS shift in North America, which helps analysts discount CCS1 exposure appropriately. Verified company evidence and qualitative rankings support peer screening without relying on unverifiable share data.

How Do Connector Manufacturers and Charger Builders Benefit?

Manufacturers can benchmark product roadmaps against verified launches in cooling, integration and bidirectional capability, and can prioritize tooling for the IEC 62196-3:2026 interface. Charger builders see where Latin America and Asia-Pacific create new demand and which tiers of power rating carry the fastest growth. Both groups gain a framework to negotiate volume contracts using replacement cycle and duty cycle insights.

Key Market Segments Evaluated

By Product type

  • Vehicle inlets
  • Charging plugs
  • Charging cable assemblies

By Standard variant

  • CCS2
  • CCS1

By Charging power rating

  • Up to 150 kW
  • 151–350 kW
  • Above 350 kW

By Region

  • North America 
    • U.S.
    • Canada
    • Mexico
  • Europe 
    • UK
    • Germany
    • France
    • Italy
    • Spain
    • Sweden
    • Denmark
    • Finland
    • Netherlands
    • Rest of Europe
  • Asia-Pacific 
    • China
    • India
    • Japan
    • South Korea
    • Taiwan
    • Indonesia
    • Vietnam
    • Australia
    • Philippines
    • Malaysia
    • Rest of APAC
  • Middle East & Africa 
    • Saudi Arabia
    • UAE
    • Egypt
    • Israel
    • Turkey
    • Nigeria
    • South Africa
    • Rest of MEA
  • Latin America 
    • Brazil
    • Argentina
    • Chile
    • Colombia
    • Rest of LATAM

Conclusion & Recommendations

The outlook for the CCS Charging Connector Market is strongly positive, with revenue compounding at 17.52% from 2026 to 2035 as regulation, public charging growth and commercial vehicle electrification reinforce one another. Europe anchors volume through a binding CCS2 mandate, while Asia-Pacific and Latin America add the fastest incremental growth. We found that value migrates toward cooled and integrated assemblies, so revenue quality improves faster than unit counts.
What Strategic Positioning Recommendations Does NMSC Offer?

NMSC recommends that suppliers prioritize CCS2 platforms, invest in cooled assemblies above 350 kW, and secure certification to IEC 62196-3:2026 before competitors. North American players should offer dual standard products to protect CCS1 revenue while capturing NACS demand. Partnerships with cable, cooling and controller specialists will shorten development time and widen addressable content per vehicle or site.

How Strong Is the Investment Attractiveness of the CCS Charging Connector Market?

Investment attractiveness is high for suppliers with automotive qualification and exposure to commercial vehicles, and moderate for CCS1 focused producers. Recurring replacement demand on busy fast charging sites steadies cash flows, and regulation gives Europe an unusually clear demand signal. Our assessment indicates that valuation should reward cooled and integrated product lines over standard inlets.

What Are the Market Shifts and Key Risks in the CCS Charging Connector Market?

The main shift is the move from standalone plugs to engineered systems with cooling, sensing and control electronics. Key risks include faster NACS adoption in North America, contact metal cost swings and a slow rise in vehicles able to use chargers above 250 kW. Standard revisions also create retooling cost, and suppliers that miss interface updates risk losing platform awards.

What Are the Primary Growth Pathways Through 2035?

Three pathways stand out: commercial vehicle depots and corridors that need high current inlets, replacement cycles on busy fast charging sites, and new regions where CCS2 becomes the default standard. Bidirectional capable connectors add a fourth pathway as utilities value vehicle energy. Suppliers that combine these pathways with local service networks can outgrow the market.

FAQs

Sources & References

1.

IEA, Global EV Outlook 2026

iea.org
2.

IEA, Global EV Outlook 2026 technical webinar slides

iea.blob.core.windows.net
3.

IEA, Global EV Outlook 2025, Electric vehicle charging

iea.org
4.

European Union, Regulation (EU) 2023/1804 (AFIR), EUR-Lex

eur-lex.europa.eu
5.

ICCT, EU Alternative Fuel Infrastructure Regulation policy update

theicct.org
6.

Alliance for Automotive Innovation, Joint Automakers comments to FHWA on the J3400 connector

autosinnovate.org
7.

Phoenix Contact, CCS charging inlets with assembled cable set

phoenixcontact.com
8.

Phoenix Contact, CCS megawatt charging cables up to 1,000 kW

phoenixcontact.com
9.

electrive, Phoenix Contact charging inlet with integrated control system

electrive.com
10.

TE Connectivity, Charging inlet connectors

te.com
11.

TE Connectivity, CCS1 and CCS2 box mount high power charging inlets (Mouser listing)

mouser.in
12.

Amphenol, Product change notice for CCS2 mating interface (IEC 62196-3:2026)

tti.com
13.

Amphenol Industrial, HVCO charging connectors

my.avnet.com
14.

MENNEKES, Vehicle charging inlets

mennekes.org
15.

HARTING, CCS inlet Type 2

harting.com/AR/en/node/31766
16.

Japan Aviation Electronics Industry, Vehicle to grid suitable CCS2 connector KW21A series

jae.com
17.

K.S. Terminals Inc., CCS2 EV charging inlet

edm.ksterminals.com
18.

K.S. Terminals Inc., Liquid cooled CCS2 EV charging connector

edm.ksterminals.com

About the Author

Mayurima Roy

Mayurima Roy

Mayurima Roy is Research Analyst at Next Move Strategy Consulting, where she has spent 4 years working across the firm's full industry coverage rather than a single fixed vertical. Her work centers on structured research, ongoing trend tracking, competitive assessment, and insight-led content development, translating complex market data into clear, decision-ready narratives that support informed client decision-making across diverse global industries, market sectors, and world regions every day.

About the Reviewer

Supradip Baul

Supradip Baul

Supradip Baul is an accomplished business consultant and strategist with over a decade of rich experience in market intelligence, strategy, technology, and business transformation. His work has included rigorous qualitative and quantitative analysis across multiple industries, helping clients shape investment decisions and long-term roadmaps. Earlier in his career, he was associated with Gartner, where he contributed to industry-leading reports and market share analyses. He has worked with leading global companies and holds an MBA with a dual specialization in Marketing and Finance.

Download Free Sample

Gustaf Hummel Burstrom

GUSTAF HUMMEL BURSTROM

Founder

Revline Tools AB

Joseph and the team at Next Move Strategy Consulting have been excellent to work with, in supplying us with relevant market data and forecasts for our specific category. We had some special requirements and they were able to do a custom package to suit our needs. We would definitely recommend them to any other company needing market data and forecasts

Melanie Samko

MELANIE SAMKO

Director of Marketing

TOSOH BIOSCIENCE, INC.

The information provided by NMSC is incredibly valuable, thank you so much for such a excellent work. I really appreciate it. I will make sure to reference all of it, in my summary document.

Amos Chang

AMOS CHANG

Strategy Consultant

Kardex Group

I have bought the intralogistics market reports from NMSC two times so far. Joseph and his team are always very helpful and flexible in responding to any customization requirements on the report. Their expertise in market reports really helps us steer the day-to-day business. I will definitely recommend and come back myself whenever there is a need.

Nishant Awate

NISHANT AWATE

Business Development Global Sales

Zehnder Group Deutschland GmbH

Our experience working with Next Move Strategy Consulting was positive. The team was responsive, professional, and open to incorporating our specific requirements throughout the project. The India AHU market study was comprehensive and well structured, covering market value and volume forecasts, product and application segments, and key industry trends. The inclusion of both AHU and residential MVHR market insights made the study particularly relevant for our strategic market assessment. Overall, the report provides a solid foundation for evaluating market potential, identifying priority segments, and supporting business-development decisions in India.

Diana Trejo

DIANA TREJO

Assistant Manager

Sumitomo Corporation de Mexico, S.A. de C.V.

Recently, we purchased a report on the Mexico Data Center Market from Next Move Strategy Consulting. The service has been excellent, with support that is always timely and thoroughly professional. The information provided is interesting, highly useful, and delivered with clarity. I would highly recommend NextMSC for anyone seeking insightful and dependable analysis.

Custom Market Research Services

We will customize the research for you if the listed report does not fully match your requirements.

Get 30% Free Customization

Select License

This website uses cookies to ensure you get the best experience on our website. Learn more

✖