Chlor-Alkali Products Market Analysis and Forecast (2026–2035)

The Chlor-Alkali Products Market was valued at USD 55.00 billion in 2025 and is estimated to reach USD 56.60 billion in 2026. The market is projected to reach USD 76.50 billion by 2035, at a CAGR of approximately 3.4% during 2026–2035. Key drivers include membrane technology upgrades, alumina refining demand, and water disinfection requirements, with Asia-Pacific leading the market.

Download Free Sample PDF
Base Year (2025)
$55.00 Billion
Forecast (2035)
$76.50 Billion
CAGR (2026-2035)
3.4%
Top Region
Asia-Pacific

What Is the Chlor-Alkali Products Market Size?
The global Chlor-Alkali Products Market was valued at USD 55.00 Billion in 2025 and is estimated at USD 56.60 Billion in 2026. It is forecast to reach USD 76.50 Billion by 2035, growing at a 3.4% CAGR from 2026–2035. Asia-Pacific leads with about 54.0% share, and caustic soda is the dominant product with roughly 68.0% share.

Based on our market analysis, we identified that electricity costs, membrane technology adoption, and downstream integration are the key factors differentiating leading producers from weaker competitors across all evaluated segments.

Chlor-Alkali Products Market Analysis and Forecast (2026–2035) Revenue Forecast
Values in USD Billion

2025 $55.00 Billion
2025
2026 $56.60 Billion
2026
2027 $58.52 Billion
2027
2028 $60.51 Billion
2028
2029 $62.57 Billion
2029
2030 $64.70 Billion
2030
2031 $66.90 Billion
2031
2032 $69.17 Billion
2032
2033 $71.53 Billion
2033
2034 $73.96 Billion
2034
2035 $76.50 Billion
2035

Key Takeaways

By Product: Caustic soda held the largest share, expanding from USD 37.40 Billion in 2025 to USD 52.20 Billion by 2035; Potassium hydroxide is the fastest-growing product segment, expanding at a CAGR of 5.1% from 2026 to 2035.

By Technology: Membrane cell held the largest share, expanding from USD 43.50 Billion in 2025 to USD 65.20 Billion by 2035, and it is also the fastest growing at 4.2% CAGR from 2026–2035.

By Application: Vinyls (EDC, VCM and PVC) held the largest share, expanding from USD 16.60 Billion in 2025 to USD 22.00 Billion by 2035; water treatment and disinfection is the fastest growing at 4.7% CAGR from 2026–2035.

Dominant Region: Asia-Pacific accounted for about 54.0% of 2025 revenue, moving from USD 29.70 Billion in 2025 to USD 42.50 Billion by 2035.

Fastest-Growing Region: Middle East & Africa is the fastest growing region at 5.1% CAGR from 2026–2035, rising from USD 4.40 Billion in 2025 to USD 7.20 Billion by 2035.

Dominant Country: China is the largest country market, moving from USD 17.60 Billion in 2025 to USD 25.20 Billion by 2035.

Fastest-Growing Country: Saudi Arabia is the fastest growing country at 6.2% CAGR from 2026–2035, rising from USD 0.85 Billion in 2025 to USD 1.55 Billion by 2035.

The Chlor-Alkali Products Market offers an absolute revenue opportunity of USD 19.90 Billion between 2026 and 2035, which we frame as an investment case built on membrane upgrades, non-discretionary water and alumina demand, and selective capacity exits that support pricing.
According to NMSC analysis, chlorine, caustic soda and hydrogen leave the cell at a fixed ratio of 1.0 ton to 1.1 tons to 0.03 tons, so producers must sell both products, and that coupling steers operating rates more than demand for either product alone, as seen when weak chlorine demand idles plants and tightens caustic soda supply.

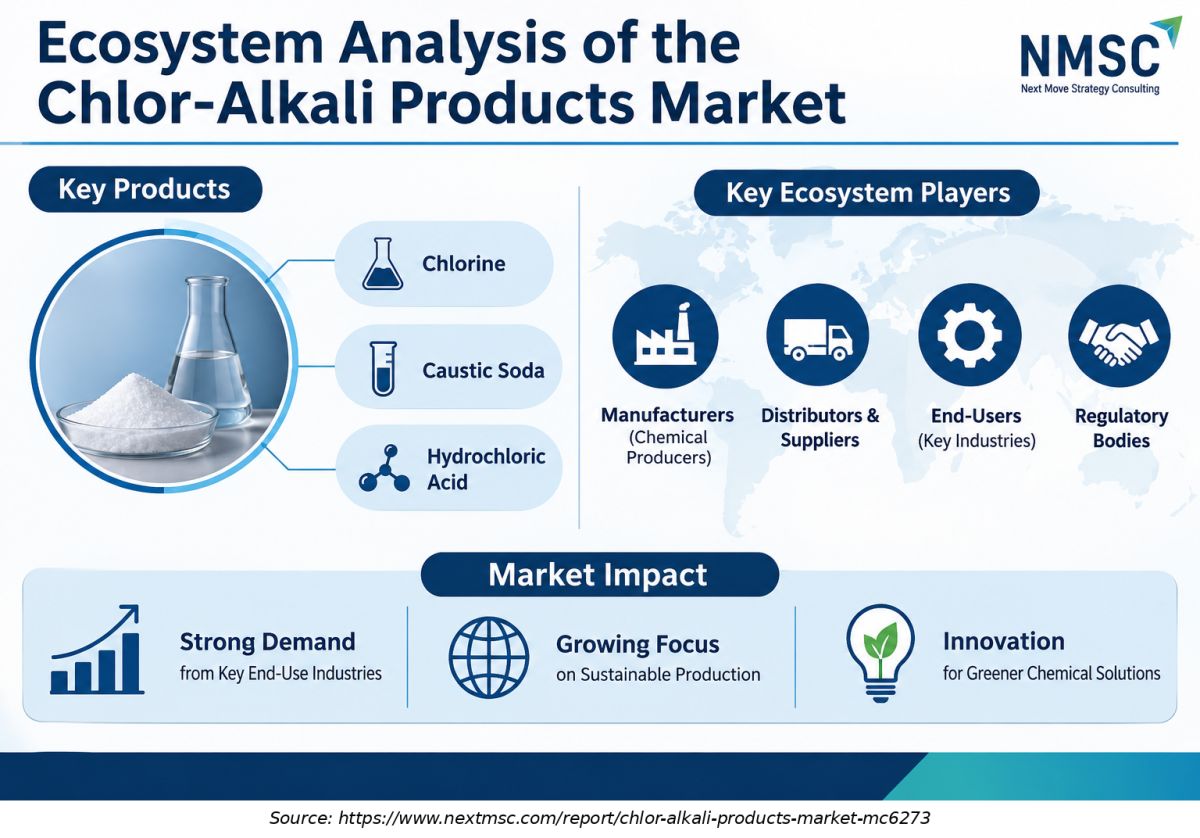
Ecosystem Analysis of the Chlor-Alkali Products Market
The chlor-alkali products market ecosystem comprises key manufacturers, raw material suppliers, distributors, end-use industries, and regulatory bodies. Manufacturers convert salt through electrolysis to produce essential chemicals such as chlorine, caustic soda, and hydrogen. These products support diverse industries, including chemicals, water treatment, pulp and paper, textiles, and pharmaceuticals. Strong collaboration among ecosystem participants, sustainable production practices, and growing industrial demand play an important role in market development

What Does the Chlor-Alkali Products Market Encompass?
The Chlor-Alkali Products Market covers chlorine and caustic soda produced through sodium chloride brine electrolysis, as well as potassium hydroxide produced through potassium chloride brine electrolysis. Production technologies include membrane, diaphragm and mercury cells, where applicable. Chlorine, caustic soda and hydrogen are co-produced during sodium chloride brine electrolysis. The combined chlorine and caustic soda output is commonly evaluated using the electrochemical unit (ECU), which reflects their linked production economics. The scope excludes soda ash made by the Solvay process, downstream plastics such as PVC resin, and hydrogen sold as a separate energy product, which keeps value counted once across the chain.
Structural change runs in two directions. Membrane technology dominates new and converted capacity because it uses less electricity per ton, and the Minamata Convention on Mercury calls for mercury cell chlor-alkali plants to be phased out by 2025. Power is the largest variable input, so we found that low-cost electricity, integrated vinyls chains and captive caustic demand give producers the strongest positions across the industry.

Market Drivers & Dynamics

Interactive Dataset
Alumina refinery additions raising caustic soda use driver +0.6% Asia-Pacific, Middle East & Africa 2026–2032
Water treatment and disinfection demand driver +0.5% Global 2026–2035
Membrane conversions and new U.S. integrated capacity driver +0.4% North America 2026–2030
Hydrogen and low carbon power integration driver +0.3% North America, Europe 2027–2035
Weak PVC and construction demand restraint −0.7% China, Europe 2026–2028
Chinese caustic soda export pressure restraint −0.5% Global trade lanes 2026–2029
High electricity cost in Europe restraint −0.4% Europe 2026–2030
Source: Next Move Strategy Consulting

Growth Drivers

What Is the Primary Growth Driver in the Chlor-Alkali Products Market?

Rising caustic soda demand from alumina refining is a major growth driver for the market. Shin-Etsu Chemical expects worldwide caustic soda demand to grow by more than 1.3 million tons a year over the next five years, citing alumina, batteries and critical mineral production. Alumina and metals processing is projected to grow at 4.5% CAGR from 2026–2035, ahead of the overall rate. We observed that producers with membrane capacity near refining hubs capture the best netbacks.

How Is Water Treatment and Disinfection Demand Driving Chlor-Alkali Products Market Growth?
Chlorine remains a core disinfectant, and the need is large. The WHO and UNICEF Joint Monitoring Programme estimates that 2.2 billion people lacked safely managed drinking water in 2022. Municipal upgrades and industrial effluent rules therefore sustain water treatment demand for chlorine and caustic soda, and the application grows at 4.7% CAGR from 2026–2035. Based on research conducted by NMSC, we found that this demand is steady through construction downturns.

Growth Inhibitors

What Is Restraining the Chlor-Alkali Products Market?

Soft chlorine demand from PVC and construction is the main restraint. Grasim Industries reported that weaker PVC and construction activity in China and parts of Europe lowered chlorine use and plant operating rates, even as caustic soda demand held up. Euro Chlor data show European utilisation at 64.8% in July 2026, and caustic soda stocks of 198,552 tonnes. We assess that high power prices and export competition keep a ceiling on near term margins.

What Are the Growth Opportunities?

How Can Producers Capture Alumina and Battery Materials Demand?

Refineries and battery material plants consume caustic soda in volume and favor reliable membrane grade supply. Producers that sign long term contracts with refiners and lithium or nickel processors lock in volume and reduce exposure to spot swings. The beneficiary segment is alumina and metals processing, which grows at 4.5% CAGR from 2026–2035 in the Chlor-Alkali Products Market.

Where Do Water Treatment Upgrades Create Chlorine Demand?

Municipal and industrial water programs need disinfectants that remain stable and affordable at scale. Producers can add bleach, hypochlorite and bulk chlorine supply close to cities in Asia-Pacific, Middle East & Africa and Latin America. The beneficiary segment is water treatment and disinfection, which expands from USD 4.90 Billion in 2025 to USD 7.70 Billion by 2035.

Can Hydrogen Recovery Improve Electrochemical Unit Economics?

Each ton of chlorine comes with about 0.03 tons of hydrogen. Operators that recover, purify, compress and sell hydrogen as fuel or feedstock can generate additional revenue. However, hydrogen recovery, treatment and compression require additional capital investment and energy consumption. The mechanism favors membrane cell sites in North America and Europe that have access to hydrogen pipelines or industrial users, and it supports margins in the Chlor-Alkali Products Market.

Segmentation Analysis

2025 (USD Billion)
2035 (USD Billion)
Caustic soda 2025: $37.40 Billion | 2035: $52.20 Billion
Caustic soda
Chlorine 2025: $15.80 Billion | 2035: $21.40 Billion
Chlorine
Potassium hydroxide 2025: $1.80 Billion | 2035: $2.90 Billion
Potassium hy
Caustic soda $37.40 Billion $52.20 Billion 3.4%
Chlorine $15.80 Billion $21.40 Billion 3.1%
Potassium hydroxide $1.80 Billion $2.90 Billion 5.1%

Which Product Dominates the Chlor-Alkali Products Market?

Caustic soda is the dominant product at 68.0% of 2025 revenue and it grows at 3.4% CAGR from 2026–2035, because it is the more transportable coproduct and serves alumina, pulp and industrial users. Chlorine is largely captive to vinyls and chlorinated products such as chloroform. Potassium hydroxide is the fastest growing at 5.1% on a small base, led by battery, fertilizer and specialty uses. Our analysis shows that caustic soda pricing sets the earnings of the whole electrochemical unit.

2025 (USD Billion)
2035 (USD Billion)
Category A
Category B
Category C
Category D
Segment Item 2025 (USD Billion) 2035 (USD Billion) CAGR
Category A $10.0 USD Billion $40.0 USD Billion 16.0%
Category B $17.1 USD Billion $51.1 USD Billion 22.0%
Category C $24.2 USD Billion $62.2 USD Billion 16.0%
Category D $31.3 USD Billion $73.3 USD Billion 26.0%

Segment-wise data is locked

Unlock complete segment-wise numbers for By Technology.

Unlock Full Data
2025 (USD Billion)
2035 (USD Billion)
Category A
Category B
Category C
Category D
Segment Item 2025 (USD Billion) 2035 (USD Billion) CAGR
Category A $10.0 USD Billion $40.0 USD Billion 18.0%
Category B $17.1 USD Billion $51.1 USD Billion 16.0%
Category C $24.2 USD Billion $62.2 USD Billion 22.0%
Category D $31.3 USD Billion $73.3 USD Billion 12.0%

Segment-wise data is locked

Unlock complete segment-wise numbers for By Application.

Unlock Full Data

Growth Opportunities

We found that three opportunities offer the clearest path to value for producers and investors in this industry.

How Can Producers Capture Alumina and Battery Materials Demand?

Refineries and battery material plants consume caustic soda in volume and favor reliable membrane grade supply. Producers that sign long term contracts with refiners and lithium or nickel processors lock in volume and reduce exposure to spot swings. The beneficiary segment is alumina and metals processing, which grows at 4.5% CAGR from 2026–2035 in the Chlor-Alkali Products Market.

Where Do Water Treatment Upgrades Create Chlorine Demand?

Municipal and industrial water programs need disinfectants that remain stable and affordable at scale. Producers can add bleach, hypochlorite and bulk chlorine supply close to cities in Asia-Pacific, Middle East & Africa and Latin America. The beneficiary segment is water treatment and disinfection, which expands from USD 4.90 Billion in 2025 to USD 7.70 Billion by 2035.

Can Hydrogen Recovery Improve Electrochemical Unit Economics?

Each ton of chlorine comes with about 0.03 tons of hydrogen. Operators that recover, purify, compress and sell hydrogen as fuel or feedstock can generate additional revenue. However, hydrogen recovery, treatment and compression require additional capital investment and energy consumption. The mechanism favors membrane cell sites in North America and Europe that have access to hydrogen pipelines or industrial users, and it supports margins in the Chlor-Alkali Products Market.

Regional Outlook

2025 (USD Billion)
2035 (USD Billion)
North Americ
Europe
Asia-Pacific
Middle East
Latin Americ
Region 2025 (USD Billion) 2035 (USD Billion) CAGR (%)
North America $10.0 USD Billion $40.0 USD Billion 9.0%
Europe $17.1 USD Billion $51.1 USD Billion 27.0%
Asia-Pacific $24.2 USD Billion $62.2 USD Billion 25.0%
Middle East & Africa $31.3 USD Billion $73.3 USD Billion 23.0%
Latin America $38.4 USD Billion $84.4 USD Billion 12.0%

Regional data is locked

Unlock complete regional numbers for this market.

Unlock Full Data

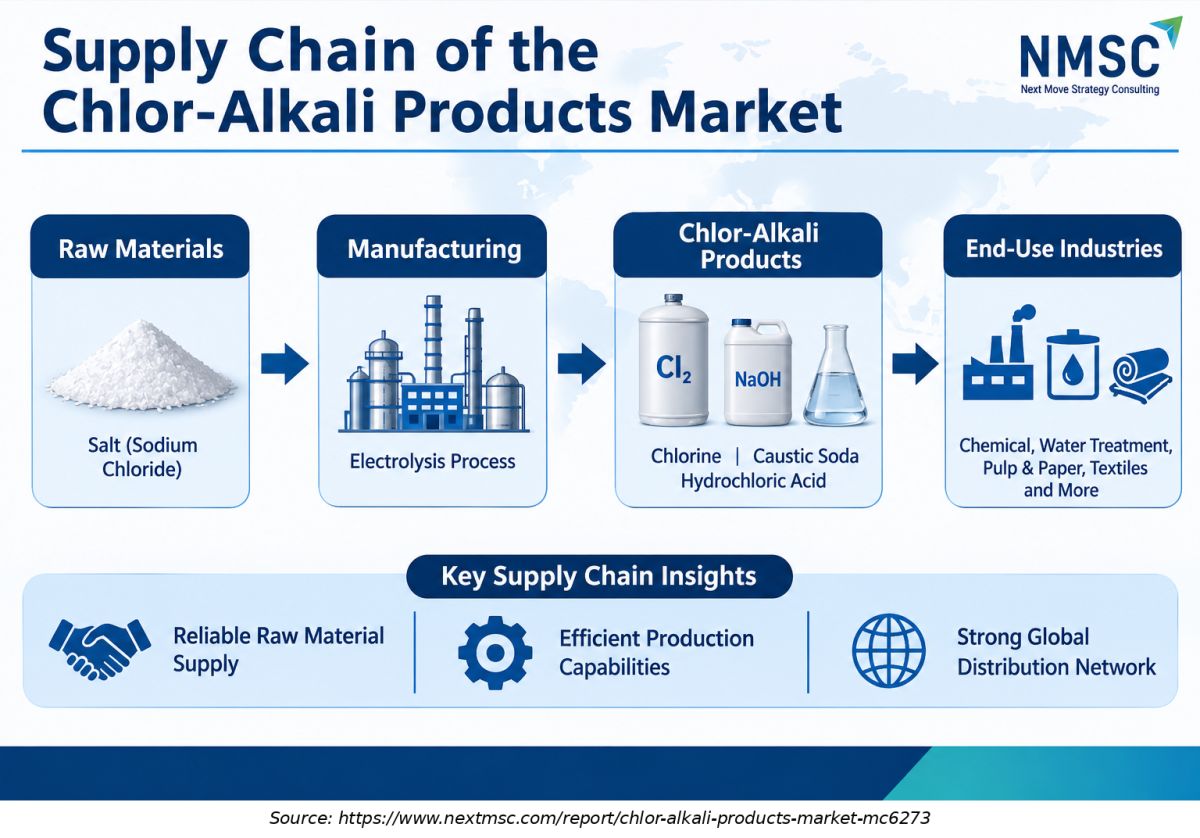
Supply Chain of the Chlor-Alkali Products Market
Supply Chain of the Chlor-Alkali Products Market

The chlor-alkali products supply chain begins with the procurement of salt (sodium chloride), which is processed into brine and supplied to electrolysis facilities. The manufacturing process produces chlorine, caustic soda, and hydrogen, which are further processed, stored, and distributed through wholesale and logistics networks. These products serve various downstream industries, including chemical manufacturing, water treatment, pulp and paper, and textiles. Reliable raw material sourcing, efficient production facilities, and strong distribution networks are essential for maintaining supply chain efficiency

Competitive Landscape

We found that the competitive landscape rewards scale, cheap power and downstream integration over pure volume.

How Do Companies Compete in the Chlor-Alkali Products Market?

Producers compete on delivered cost, reliability and the value they extract from both sides of the electrochemical unit. Olin follows a value over volume approach and reported chlor-alkali and vinyls sales of USD 3.68 Billion in 2025. Integrated players such as Westlake, Formosa Plastics and Shin-Etsu can place chlorine inside vinyls chains, which lowers their need to sell chlorine at weak prices.

Which Competitive Archetypes Dominate the Industry?

Three archetypes dominate. Merchant specialists such as Olin focus on pricing discipline. Integrated vinyls groups such as Westlake, Shin-Etsu and Formosa use chlorine captively. State linked and regional champions such as Xinjiang Zhongtai and Grasim scale on local resources and domestic demand. Differentiation themes include energy cost, safety record, logistics reach and product purity.

How Are Companies Differentiating Through Innovation and Strategy?

Companies differentiate through membrane upgrades, power sourcing and product mix. Olin continues to pursue structural cost-reduction initiatives, while Shintech announced a USD 3.40 billion investment in its Plaquemine complex in March 2026. The project includes a fourth chlor-alkali plant that will add 310,000 tons of annual caustic soda capacity, with construction scheduled for completion toward the end of 2030. We observed that geographic expansion targets low-cost sites in the United States, India and the Gulf, while pricing strategies stay disciplined.

What Is the M&A Activity in the Chlor-Alkali Products Market?

Deals focus on portfolio pruning and asset acquisition. Berkshire Hathaway completed a USD 9.70 Billion acquisition of OxyChem on January 2, 2026, and INEOS Inovyn agreed on April 21, 2026 to sell its Italian chlor-alkali business to Esseco Industrial. Westlake closed a styrene unit alongside three chlorovinyl units in late 2025. NMSC's analysis indicates that further consolidation is likely as weaker assets exit.

Key Market Players

Based on research conducted by NMSC, we found that the following verified companies lead the market on capacity, scale or integration.

Olin Corporation Occidental Chemical Corporation Westlake Corporation Formosa Plastics Corporation Shin-Etsu Chemical Co., Ltd. INEOS Group Holdings S.A. Xinjiang Zhongtai Chemical Co., Ltd. Tosoh Corporation Grasim Industries Limited

Expert Insights

Ken Lane

Ken Lane

President and CEO | Olin Corporation

"“What we need to see is some demand coming back, and that will be the biggest driver.”"

Analyst Interpretation

The comment highlights the importance of demand recovery in determining the future growth of the chlor-alkali market. Although capacity additions remain relatively limited after accounting for plant closures, stronger consumption across industrial applications will be essential to improve market conditions. Economic recovery in major chemical-producing and consuming regions, particularly Europe and China, could support improved demand for chlorine and caustic soda

Investment Opportunities

How Are Capital Inflows Shaping the Chlor-Alkali Products Market?

Capital is flowing toward low cost, integrated assets. Berkshire Hathaway paid USD 9.70 Billion for OxyChem, and Shin-Etsu committed USD 3.40 Billion to Plaquemine. At the same time, Westlake and INEOS are shedding weaker sites. We found that investors reward balance sheet strength and favor membrane capacity near feedstock and ports, while merchant exposure to Asian export prices attracts a discount.

Where Is Infrastructure Investment Most Needed?

Infrastructure needs center on membrane cell conversions, brine supply, rail and marine terminals, and storage for caustic soda and chlorine. Shintech's fourth chlor-alkali unit and Grasim's expansion of caustic soda capacity to 1,505 thousand tons show where money is moving. Our assessment indicates that Gulf and Indian projects need port and power infrastructure as much as cells.

What Are the ESG Considerations for Investors?

Environmental factors shape permits, cost and demand. The Minamata Convention calls for ending mercury cell production by 2025, and power sourcing drives carbon intensity. Power mix therefore feeds directly into buyer carbon accounting. Safety, community relations and chlorine transport risk also matter, so we observed that investors screen operators on incident history and renewable power plans.

Key Benefits for Stakeholders

How Does the Report Help Enterprise and Industry Leaders?

Enterprise leaders get segment sizing for products, technologies and applications, plus regional forecasts to USD 76.50 Billion by 2035. The analysis helps buyers of caustic soda and chlorine plan contracts, benchmark suppliers and assess supply risk in Europe and North America. Producers can use it to prioritize membrane conversion, choose export markets and link specialty chemicals growth to chlorine demand.

How Does the Report Help Investors and Financial Analysts?

Investors receive a reconciled forecast from USD 56.60 Billion in 2026 to USD 76.50 Billion by 2035, with segment and country CAGRs and a risk matrix. The data help compare merchant and integrated producers, read the cycle in operating rates, and size opportunities in water treatment and alumina. The analysis also flags divestiture candidates and regions where capacity exits could support pricing.

How Does the Report Help Technology Vendors and Product Teams?

Technology vendors can map demand for membrane cells, brine purification, power management and hydrogen recovery against regional capacity plans. Product teams see which grades and end uses grow fastest, including potassium hydroxide at 5.1% CAGR. The report also highlights conversion pipelines in China, the Gulf and North America where vendors can offer retrofit and efficiency solutions.

Key Market Segments Evaluated

By Product

  • Caustic soda
  • Chlorine
  • Potassium hydroxide

By Technology

  • Membrane cell
  • Diaphragm cell
  • Mercury cell

By Application

  • Vinyls (EDC, VCM and PVC)
  • Organic and inorganic chemicals
  • Alumina and metals processing
  • Pulp, paper and textiles
  • Water treatment and disinfection
  • Soaps, detergents and food processing

By Region

  • North America 
    • U.S.
    • Canada
    • Mexico
  • Europe 
    • UK
    • Germany
    • France
    • Italy
    • Spain
    • Sweden
    • Denmark
    • Finland
    • Netherlands
    • Rest of Europe
  • Asia-Pacific 
    • China
    • India
    • Japan
    • South Korea
    • Taiwan
    • Indonesia
    • Vietnam
    • Australia
    • Philippines
    • Malaysia
    • Rest of APAC
  • Middle East & Africa 
    • Saudi Arabia
    • UAE
    • Egypt
    • Israel
    • Turkey
    • Nigeria
    • South Africa
    • Rest of MEA
  • Latin America 
    • Brazil
    • Argentina
    • Chile
    • Colombia
    • Rest of LATAM

Conclusion & Recommendations

The outlook is steady rather than spectacular. Revenue moves from USD 56.60 Billion in 2026 to USD 76.50 Billion by 2035, driven by membrane upgrades, alumina refining and water disinfection. Weak PVC demand and power costs cap growth in mature regions, so Asia-Pacific and Middle East & Africa supply most of the expansion.

What Strategic Positioning Recommendations Does NMSC Offer?

We recommend that producers secure low-cost power, convert remaining diaphragm and mercury capacity, and tie caustic soda volumes to alumina and battery customers. Integrated players should protect chlorine outlets, while merchant producers should keep pricing discipline. Buyers should diversify suppliers and hold contingency inventory because chlorine logistics limit substitution.

How Strong Is the Investment Attractiveness of the Chlor-Alkali Products Market?

Attractiveness is selective. The USD 19.90 Billion revenue opportunity between 2026 and 2035 favors membrane capacity near cheap feedstock and ports, as the Berkshire Hathaway and Shin-Etsu commitments show. Overcapacity in China and weak European economics argue for caution on commodity exposure and for a focus on integrated assets with secure power contracts.

What Are the Market Shifts and Key Risks Through 2035?

Key shifts include the exit of mercury and older diaphragm cells, regional capacity rationalization and a rising share of low carbon product. Principal risks are Chinese export pressure, volatile electricity prices, construction downturns that cut chlorine demand, and safety incidents. Policy changes on tariffs and carbon pricing could redraw trade flows.

What Are the Primary Growth Pathways Through 2035?

Growth pathways include alumina and battery materials supply, municipal water programs, potassium hydroxide and bleach, and hydrogen recovery. Geographic pathways point to India, the Gulf and the U.S. Gulf Coast. We found that producers able to combine these pathways with low-cost power and reliable logistics can outgrow the overall 3.4% CAGR.

FAQs

Sources & References

1.

Olin Corporation, Form 10-K for fiscal 2025 (SEC)

sec.gov
2.

Olin Corporation, Form 8-K first quarter 2026 earnings (SEC)

sec.gov
3.

Olin Corporation, Form 10-Q for June 30, 2026 (SEC)

sec.gov
4.

Westlake Corporation, Form 8-K dated December 12, 2025 (SEC)

sec.gov
5.

Westlake Corporation, Form 10-K for fiscal 2025 (SEC)

sec.gov
6.

Westlake Corporation, press release on North American asset rationalization

businesswire.com
7.

Berkshire Hathaway Inc., press release on completion of the OxyChem acquisition

businesswire.com
8.

Euro Chlor, December 2025 chlorine production

eurochlor.org
9.

Euro Chlor, July 2026 chlorine production

eurochlor.org
10.

Grasim Industries Limited, Integrated Annual Report 2025–26, Chemicals

grasim.com
11.

Grasim Industries Limited, Annual Report FY25, Chemicals

grasim.com
12.

Xinjiang Zhongtai Chemical Co., Ltd., company profile (Shenzhen Stock Exchange)

szse.io
13.

Formosa Plastics Corporation, U.S.A.

fpcusa.com
14.

INEOS Group, corporate website (INEOS Inovyn announcements)

ineos.com
15.

Shin-Etsu Chemical Co., Ltd., corporate website

shinetsu.co.jp/en
16.

Tosoh Corporation, corporate website (quarterly results)

tosoh.co.jp
17.

Minamata Convention on Mercury, UNEP secretariat

minamataconvention.org
18.

WHO/UNICEF Joint Monitoring Programme for Water Supply, Sanitation and Hygiene

washdata.org
19.

National Bureau of Statistics of China

stats.gov.cn/english
20.

General Administration of Customs of China

english.customs.gov.cn

About the Author

Mayurima Roy

Mayurima Roy

Mayurima Roy is Research Analyst at Next Move Strategy Consulting, where she has spent 4 years working across the firm's full industry coverage rather than a single fixed vertical. Her work centers on structured research, ongoing trend tracking, competitive assessment, and insight-led content development, translating complex market data into clear, decision-ready narratives that support informed client decision-making across diverse global industries, market sectors, and world regions every day.

About the Reviewer

Supradip Baul

Supradip Baul

Supradip Baul is an accomplished business consultant and strategist with over a decade of rich experience in market intelligence, strategy, technology, and business transformation. His work has included rigorous qualitative and quantitative analysis across multiple industries, helping clients shape investment decisions and long-term roadmaps. Earlier in his career, he was associated with Gartner, where he contributed to industry-leading reports and market share analyses. He has worked with leading global companies and holds an MBA with a dual specialization in Marketing and Finance.

Download Free Sample

Melanie Samko

MELANIE SAMKO

Director of Marketing

TOSOH BIOSCIENCE, INC.

The information provided by NMSC is incredibly valuable, thank you so much for such a excellent work. I really appreciate it. I will make sure to reference all of it, in my summary document.

Kevin Coker

KEVIN COKER

Founder, CEO and Board Diector

Proxima Clinical Research

I have been using Next MSC reports for product positioning in a new geography for a long time. They have by far the best reports I have found and the price is reasonable too!

Diana Trejo

DIANA TREJO

Assistant Manager

Sumitomo Corporation de Mexico, S.A. de C.V.

Recently, we purchased a report on the Mexico Data Center Market from Next Move Strategy Consulting. The service has been excellent, with support that is always timely and thoroughly professional. The information provided is interesting, highly useful, and delivered with clarity. I would highly recommend NextMSC for anyone seeking insightful and dependable analysis.

Ross J Mckenzie

ROSS J MCKENZIE

Business Insight Manager

Staysure Group

“Next MSC have been incredibly helpful in providing detailed & robust information on our market, alongside quantifying growth by different segments. The process to procure was simple and easy, with sample reports and regular contact to ensure we had what we needed. Succinct detail on their sources & methodologies is also greatly received, allowing transparency in this respect helps build trust in the detail you pay for. Joseph in particular was fantastic, and helped ensure efficient provision of the insight pack – thank you NMSC!”.

Gaurav Jaiswal

GAURAV JAISWAL

Founder & CEO

Yano Charge Private Limited

The EV Charging market research report provided by the NextMSC was exceptionally detailed and insightful. It offered a comprehensive analysis that proved to be a game-changer for our strategic planning. Truly a testament to the NextMSC’s expertise and thoroughness in EV market landscape & analysis.

Custom Market Research Services

We will customize the research for you if the listed report does not fully match your requirements.

Get 30% Free Customization

Select License

This website uses cookies to ensure you get the best experience on our website. Learn more

✖