Cloud-Optimized Hardware Market Size, Share, Trends and Growth Analysis, By Component (Servers, Storage Systems, Networking Equipment, Accelerators and Custom Silicon, and Cooling and Power Infrastructure), By Deployment (Hyperscale Data Center, Colocation Data Center, and Edge Data Center), By Processor Architecture, By End User (Cloud Service Providers, Enterprise, and Telecom Operators), and Region — Global Industry Report and Forecast, 2026–2035
Industry: ICT & Media | Publishing Date: August 7, 2026 | Last Updated: August 7, 2026 | No of Pages: N/A | No. of Tables: N/A | No. of Figures: N/A | Format: PDF | Report Code: IC5638
What Is the Cloud-Optimized Hardware Market Size?
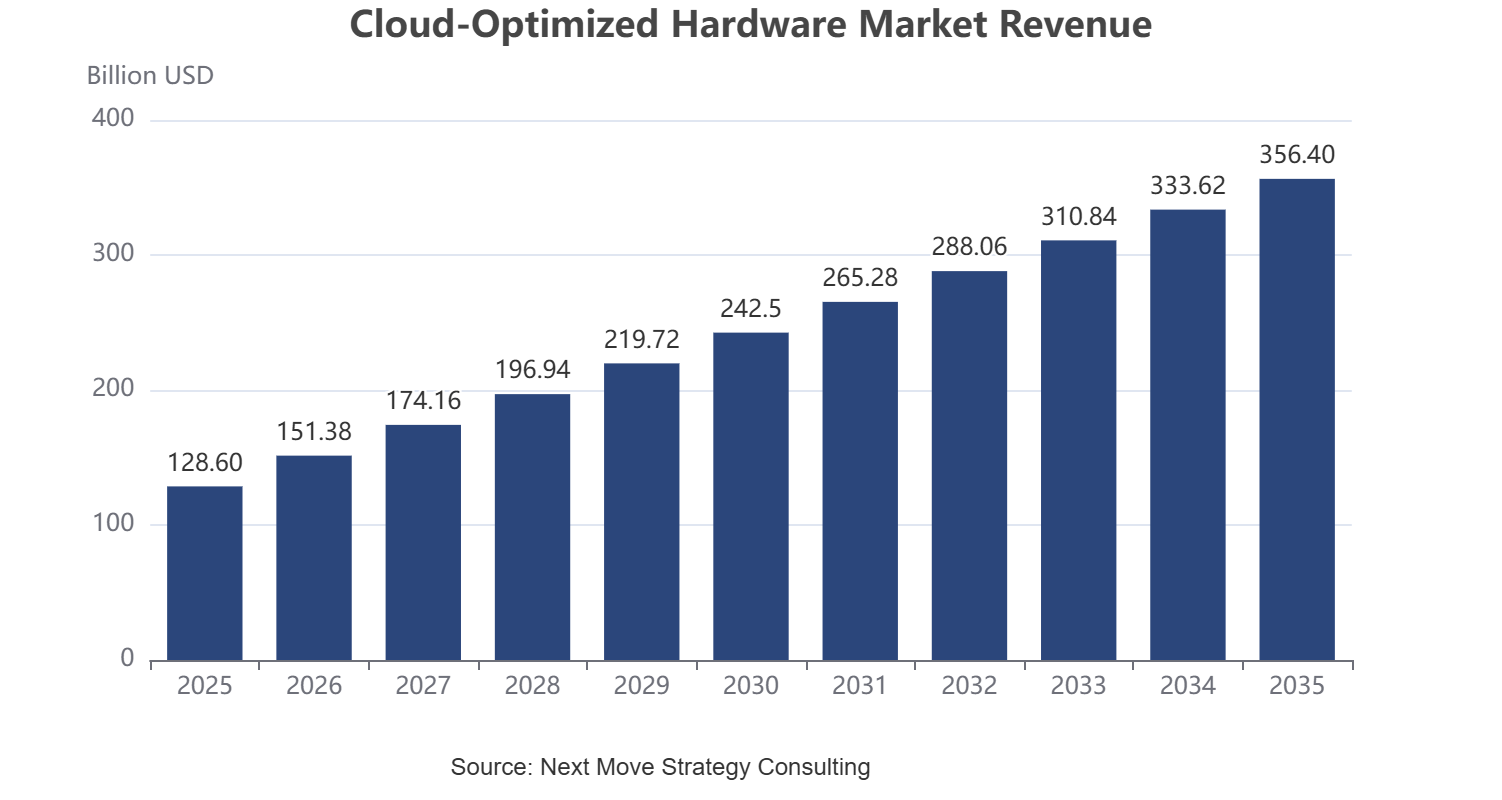
The global cloud-optimized hardware market size was valued at USD 128.60 Billion in 2025 and is estimated at USD 142.80 Billion in 2026, forecast to reach USD 356.40 Billion by 2035, expanding at a 10.70% CAGR between 2026 and 2035. North America leads with approximately 42% share, while servers dominate all other component categories with approximately 34% share.
We observed that hyperscale data center capacity expansion and rising demand for custom silicon accelerators are driving broad-based revenue growth across every segmentation axis, with accelerators and custom silicon and Asia-Pacific registering the fastest growth through 2035.
|
Key Takeaways |
|
By Component: Servers held the largest share of approximately 34% (USD 43.72 Billion) in 2025; Accelerators and Custom Silicon is the fastest-growing sub-segment at 14.8% CAGR from 2026–2035. |
|
By Deployment: Hyperscale Data Center held the largest share of approximately 58% (USD 74.59 Billion) in 2025; Edge Data Center is the fastest-growing sub-segment at 11.6% CAGR from 2026–2035. |
|
By Processor Architecture: x86 Architecture held the largest share of approximately 54% (USD 69.44 Billion) in 2025; Custom ASIC and Silicon is the fastest-growing sub-segment at 14.6% CAGR from 2026–2035. |
|
By End User: Cloud Service Providers held the largest share of approximately 61% (USD 78.45 Billion) in 2025; Telecom Operators is the fastest-growing end user at 13.2% CAGR from 2026–2035. |
|
Dominant Region: North America dominated with approximately 42% revenue share (USD 54.01 Billion) in 2025. |
|
Fastest-Growing Region: Asia-Pacific is expected to register the highest CAGR of 13.0% during 2026–2035. |
|
Dominant Country: The U.S. led with approximately USD 40.50 Billion in 2025. |
|
Fastest-Growing Country: India is the fastest-growing country at approximately 15.2% CAGR from 2026–2035. |
Market Opportunity: The cloud-optimized hardware market is expected to create an absolute dollar opportunity of USD 213.60 Billion between 2026 and 2035, presenting significant investment potential across custom silicon development, hyperscale server manufacturing, and edge data center infrastructure.
According to Next Move Strategy Consulting analysis, hyperscale cloud providers are increasingly designing proprietary silicon and server architectures in-house rather than relying solely on merchant silicon vendors, a shift that favors companies with deep custom ASIC design capabilities over traditional general-purpose hardware manufacturers as competitive intensity increases through 2035.
What Does the Cloud-Optimized Hardware Market Encompass?
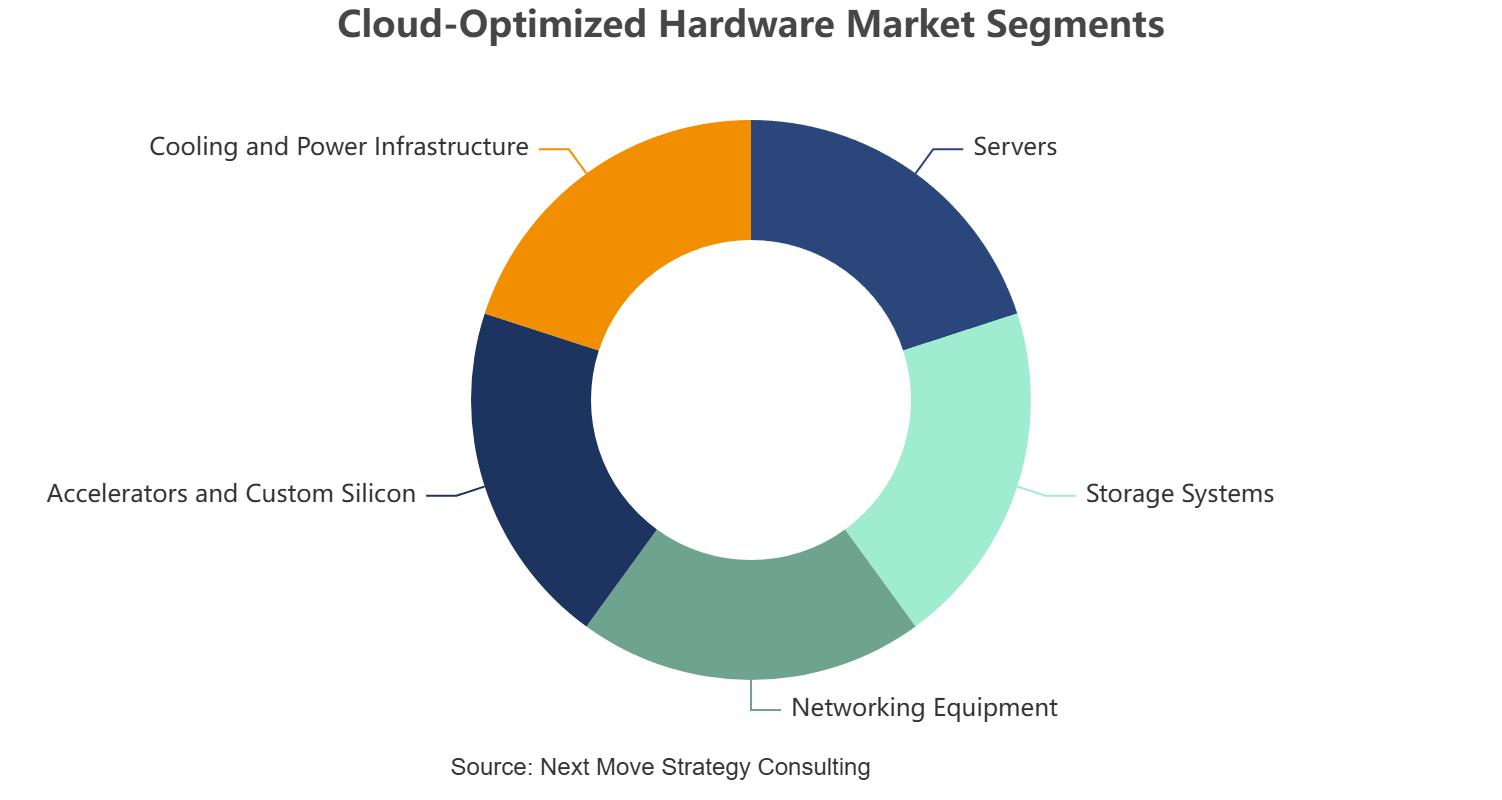
The cloud-optimized hardware market encompasses servers, storage systems, networking equipment, accelerators and custom silicon, and cooling and power infrastructure engineered specifically for hyperscale, colocation, and edge data center deployment. Our assessment indicates that the market report scope spans chipmakers, server original design manufacturers, and networking equipment providers serving cloud service providers, enterprises, and telecom operators, with demand shaped by rack-density optimization, power efficiency, and workload-specific silicon design.
We observed that the market has evolved from general-purpose x86 server deployment into a differentiated hardware category incorporating custom ASICs, GPUs, and ARM-based processors optimized for artificial intelligence and cloud-native workloads. Regulatory frameworks such as U.S. Department of Commerce export control rules on advanced semiconductors shape cross-border hardware trade, while technology adoption is shifting toward liquid cooling and disaggregated infrastructure, and Next Move Strategy Consulting's analysis indicates that this convergence of custom silicon design and power-efficient infrastructure is redefining competitive positioning across the cloud-optimized hardware market.
|
Parameters |
Details |
|
Market Size in 2025 |
USD 128.60 Billion |
|
Market Size in 2026 |
USD 142.80 Billion |
|
Revenue Forecast in 2035 |
USD 356.40 Billion |
|
Growth Rate |
CAGR of 10.70% from 2026 to 2035 |
|
Analysis Period |
2025–2035 |
|
Base Year Considered |
2025 |
|
Forecast Period |
2026–2035 |
|
Market Size Estimation |
Revenue (USD Billion) |
|
Companies Profiled |
20 |
|
Countries Covered |
33 |
|
Market Share |
Available for Top 10 Companies |
Key Emerging Trends
Based on research conducted by Next Move Strategy Consulting, we found that four structural trends are reshaping hardware design, deployment, and stakeholder demand across the cloud-optimized hardware market.
How Is Custom Silicon Development Transforming Cloud Infrastructure?
Hyperscale cloud providers are increasingly designing proprietary processors and accelerators to optimize performance and cost for internal workloads. We observed that Amazon.com's AWS division continues to expand its Graviton and Trainium custom silicon lineup in official product disclosures. This shift is reshaping vendor relationships industry-wide, as cloud providers reduce dependence on merchant silicon vendors for a growing share of their internal compute infrastructure.
Why Is Liquid Cooling Adoption Accelerating Across Data Centers?
Rising rack power density from AI accelerator deployment is driving adoption of liquid cooling systems over traditional air-cooling infrastructure. Our findings suggest that companies such as Super Micro Computer are prioritizing liquid-cooled server platforms in their official product roadmaps. This trend is accelerating a shift toward direct-to-chip and immersion cooling architectures as accelerator power densities continue to rise across hyperscale deployments.
How Is Disaggregated Infrastructure Reshaping Server Architecture?
Hardware manufacturers are increasingly designing modular, disaggregated server architectures that separate compute, memory, and storage resources for independent scaling. We observed that this shift is expanding fastest within the accelerators and custom silicon category, which registers a materially higher growth rate than traditional integrated server designs. Companies with established modular hardware platforms are capturing disproportionate share of incremental hyperscale infrastructure spending.
What Role Does Edge Data Center Expansion Play in Market Evolution?
Edge data center deployment, while representing a smaller base than hyperscale facilities, is expanding fastest among deployment categories as latency-sensitive workloads and content delivery requirements drive distributed infrastructure investment. The U.S. Federal Communications Commission maintains public broadband infrastructure deployment data relevant to edge facility siting decisions. This is intensifying hardware development investment among companies pursuing compact, power-efficient server designs for edge deployment.
Porter’s Five Forces Analysis of the Cloud-Optimized Hardware Market
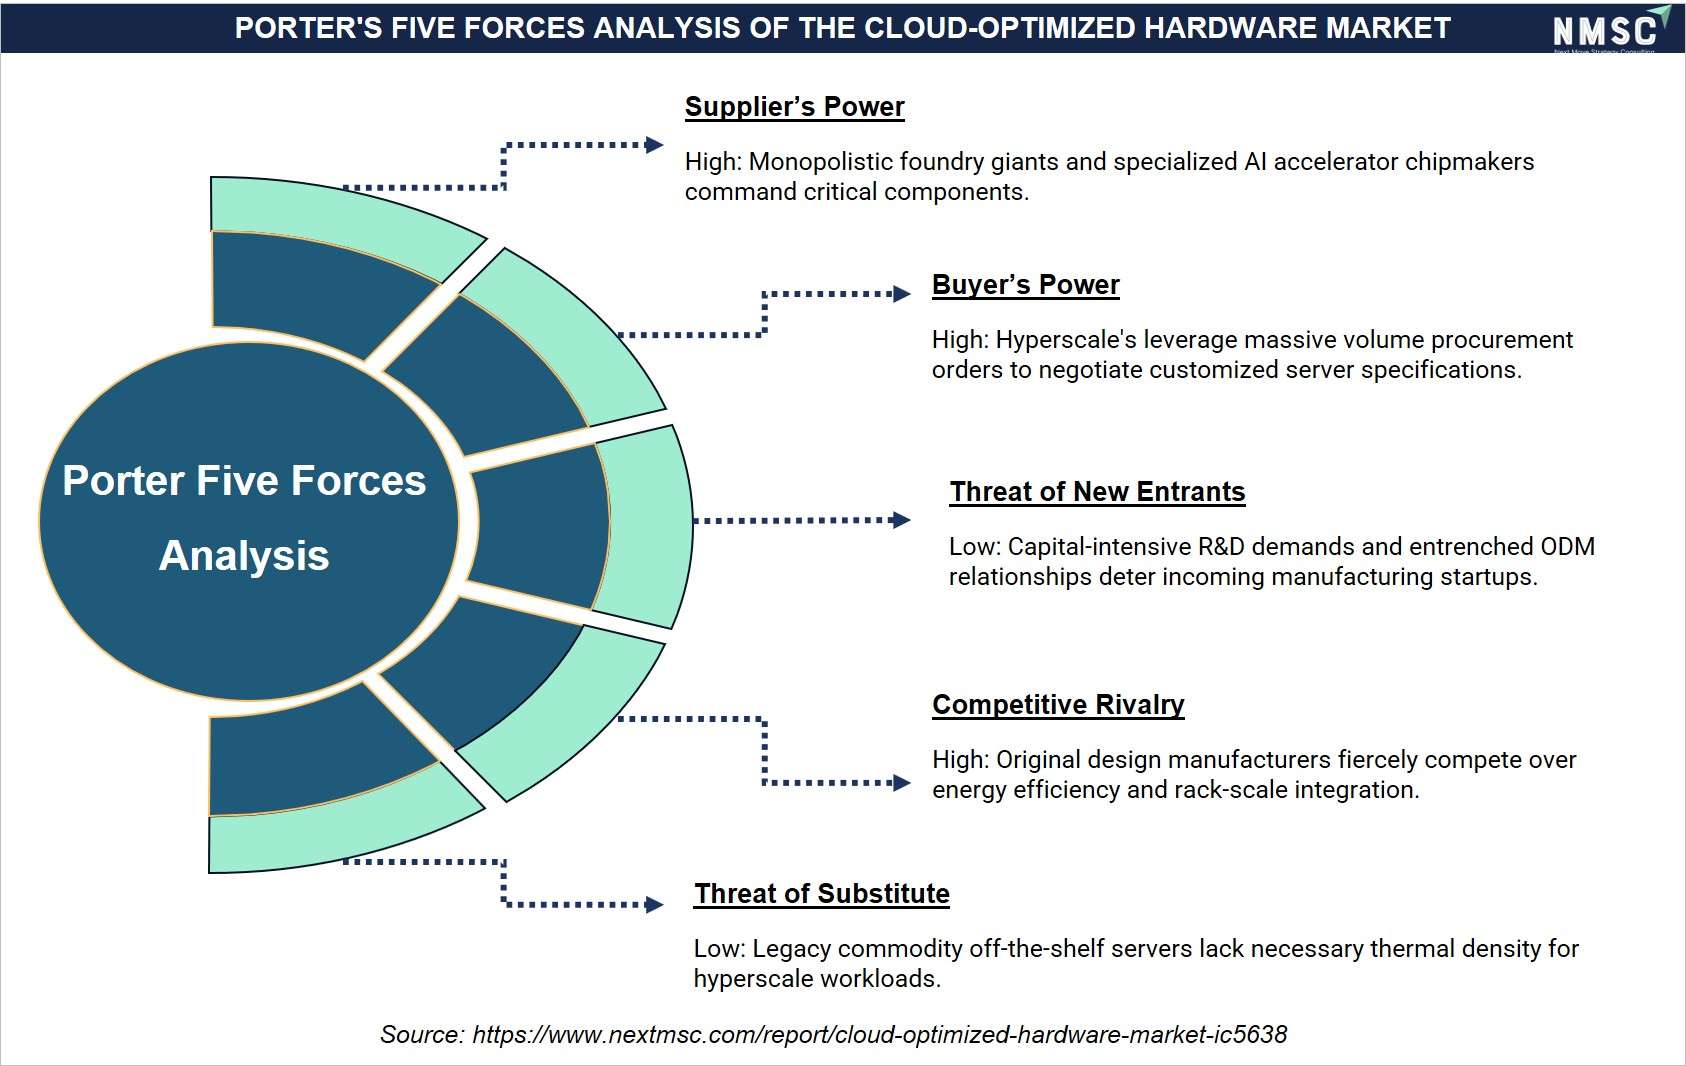
NMSC's analysis indicates that competitive rivalry in the Cloud-Optimized Hardware Market is high as ODMs compete fiercely on energy efficiency and rack integration. Simultaneously, foundry giants and AI accelerator chipmakers hold high supplier power, while hyperscalers exert high buyer leverage through massive procurement orders. Furthermore, capital-intensive R&D keeps new entrant threats low, and legacy off-the-shelf servers present a low substitution threat due to insufficient thermal density.
Growth Drivers and Restraints
Growth Catalyst and Risk Assessment Matrix
|
Factors |
Type |
(+/-) % Impact on CAGR |
Geographic Relevance |
|
Rising demand for AI accelerator and custom silicon deployment |
Driver |
+2.6% |
Global |
|
Sustained hyperscale data center capacity expansion |
Driver |
+1.9% |
North America, Asia-Pacific |
|
Growing enterprise cloud migration and workload modernization |
Driver |
+1.1% |
Global |
|
Expansion of edge data center deployment for latency-sensitive workloads |
Driver |
+0.8% |
North America, Europe, Asia-Pacific |
|
Advances in liquid cooling and power-efficient infrastructure |
Driver |
+0.6% |
Global |
|
Rising telecom operator investment in cloud-native network infrastructure |
Driver |
+0.5% |
Asia-Pacific, Europe |
|
Export control restrictions on advanced semiconductor trade |
Restraint |
-1.2% |
Asia-Pacific, Middle East |
|
Persistent semiconductor supply chain constraints |
Restraint |
-0.7% |
Global |
|
Rising power infrastructure and grid capacity constraints |
Restraint |
-0.5% |
North America, Europe |
What Is the Primary Growth Driver of the Cloud-Optimized Hardware Market?
Rising demand for AI accelerator and custom silicon deployment is the primary driver of the market. The U.S. Bureau of Economic Analysis reports sustained annual growth in information-processing equipment investment as a share of private nonresidential fixed investment. We observed that this steady shift toward specialized compute infrastructure is expanding the addressable revenue base for accelerator and custom silicon manufacturers at a faster rate than general-purpose server hardware.
How Is Hyperscale Data Center Expansion Driving Market Growth?
Sustained hyperscale data center capacity expansion by major cloud service providers continues to increase demand for cloud-optimized server, storage, and networking hardware. The U.S. Energy Information Administration's electricity consumption data confirms sustained annual growth in data center electricity demand as a share of total commercial sector consumption. Our assessment indicates that this capacity expansion is directly supporting sustained hardware procurement cycles among hyperscale cloud providers.
What Is Restraining Cloud-Optimized Hardware Market Expansion?
Export control restrictions on advanced semiconductor trade restrain market expansion by limiting cross-border hardware and component availability in certain geographies. The U.S. Department of Commerce's Bureau of Industry and Security maintains public export control rules applicable to advanced computing semiconductors and associated manufacturing equipment. We found that this regulatory fragmentation disproportionately affects companies without diversified regional manufacturing and supply chain infrastructure, reinforcing the advantage held by larger, multi-region hardware manufacturers.
Segmentation Analysis
Segment Sizing: By Component
|
Segment |
2025 (USD) |
2035 (USD) |
CAGR% (2026–2035) |
|
Servers |
USD 43.72 Billion |
USD 103.36 Billion |
9.0% |
|
Storage Systems |
USD 24.43 Billion |
USD 57.02 Billion |
8.8% |
|
Networking Equipment |
USD 20.58 Billion |
USD 53.46 Billion |
10.0% |
|
Accelerators and Custom Silicon |
USD 27.01 Billion |
USD 106.92 Billion |
14.8% |
|
Cooling and Power Infrastructure |
USD 12.86 Billion |
USD 35.64 Billion |
10.7% |
|
Total |
USD 128.60 Billion |
USD 356.40 Billion |
10.70% |
What Is Driving Segment Sizing By Component in the Cloud-Optimized Hardware Market?
This axis separates the core hardware categories that define the market's scope. Servers dominate on the strength of established hyperscale and colocation deployment infrastructure. Accelerators and custom silicon register the fastest growth as AI workload deployment drives sustained demand for GPUs, ASICs, and other specialized compute hardware, while storage and networking equipment retain stable secondary positions anchored by consistent infrastructure refresh cycles.
Segment Sizing: By Deployment
|
Segment |
2025 (USD) |
2035 (USD) |
CAGR% (2026–2035) |
|
Hyperscale Data Center |
USD 74.59 Billion |
USD 217.40 Billion |
11.3% |
|
Colocation Data Center |
USD 37.29 Billion |
USD 89.10 Billion |
9.1% |
|
Edge Data Center |
USD 16.72 Billion |
USD 49.90 Billion |
11.6% |
|
Total |
USD 128.60 Billion |
USD 356.40 Billion |
10.70% |
Why Is Edge Data Center the Fastest-Growing Deployment Category?
Hyperscale data centers retain the largest deployment share, reflecting sustained capacity investment by major cloud service providers. Edge data centers grow fastest as latency-sensitive workloads and content delivery requirements drive distributed infrastructure investment closer to end users. Colocation data centers remain a stable secondary deployment category, anchored by enterprises seeking managed facility access without hyperscale-level capital investment.
Segment Sizing: By End User
|
Segment |
2025 (USD) |
2035 (USD) |
CAGR% (2026–2035) |
|
Cloud Service Providers |
USD 78.45 Billion |
USD 224.53 Billion |
11.1% |
|
Enterprise |
USD 34.72 Billion |
USD 78.41 Billion |
8.5% |
|
Telecom Operators |
USD 15.43 Billion |
USD 53.46 Billion |
13.2% |
|
Total |
USD 128.60 Billion |
USD 356.40 Billion |
10.70% |
Why Is the Telecom Operators End User Segment Growing Fastest?
Cloud service providers retain the largest end-user share, anchored by sustained hyperscale infrastructure procurement across major cloud platforms. Telecom operators register the fastest growth as network function virtualization and cloud-native 5G core deployment drive increased hardware investment. Enterprise buyers remain a stable secondary segment, anchored by steady on-premises and hybrid cloud infrastructure modernization spending.
Growth Opportunities
Beyond the core growth drivers, three forward-looking whitespace opportunities stand out for stakeholders positioning ahead of 2035 demand.
Why Does Custom ASIC Design Present a Growth Opportunity?
Chipmakers can capture value by expanding custom ASIC design services for hyperscale cloud providers seeking workload-specific silicon, benefiting cloud service providers pursuing performance and cost optimization beyond merchant silicon alternatives.
How Can Edge-Optimized Server Design Unlock New Demand?
Hardware manufacturers can expand compact, power-efficient server platforms designed specifically for edge data center constraints, benefiting telecom operators and content delivery providers seeking distributed infrastructure closer to end users.
What Opportunity Exists in Liquid Cooling Infrastructure?
Manufacturers can pursue liquid cooling system development for high-density accelerator deployments, benefiting hyperscale data center operators seeking to manage rising rack power density without proportional facility expansion costs.
Regional Outlook
|
Region |
2025 (USD) |
2035 (USD) |
CAGR% (2026–2035) |
Key Driver |
|
North America |
USD 54.01 Billion |
USD 135.43 Billion |
9.6% |
Established hyperscale infrastructure and custom silicon investment |
|
Asia-Pacific |
USD 34.72 Billion |
USD 117.61 Billion |
13.0% |
Rapid hyperscale capacity expansion and manufacturing scale |
|
Europe |
USD 27.01 Billion |
USD 64.15 Billion |
9.0% |
Regulatory-driven data sovereignty infrastructure investment |
|
Latin America |
USD 7.72 Billion |
USD 24.95 Billion |
12.4% |
Expanding colocation and telecom infrastructure investment |
|
Middle East and Africa |
USD 5.14 Billion |
USD 14.26 Billion |
10.7% |
Government-backed digital infrastructure development programs |
|
Total |
USD 128.60 Billion |
USD 356.40 Billion |
10.70% |
|
North America Cloud-Optimized Hardware Market Outlook
North America represents the most mature cloud-optimized hardware market, anchored by established hyperscale data center infrastructure and leading custom silicon design capability. We observed that sustained capital expenditure by major cloud service providers continues to drive server and accelerator procurement cycles. Regulatory influence remains significant under U.S. export control rules, and strategic outlook favors continued investment in custom silicon and liquid cooling infrastructure through 2035.
Asia-Pacific Cloud-Optimized Hardware Market Outlook
Asia-Pacific combines rapid hyperscale capacity expansion with concentrated hardware manufacturing scale, positioning it as the fastest-growing region through 2035. We found that expanding cloud infrastructure investment across China and India is accelerating regional hardware procurement. Strategic outlook favors continued manufacturing capacity expansion and localized hardware development as regional hyperscale deployment continues to scale.
Europe Cloud-Optimized Hardware Market Outlook
Europe benefits from regulatory-driven data sovereignty requirements that support sustained regional data center infrastructure investment. Technology adoption is advancing through custom silicon and liquid cooling deployment, though semiconductor supply chain constraints affect procurement timelines. Our assessment indicates that regulatory data localization requirements are reinforcing Europe's position as a compliance-driven regional infrastructure market.
Latin America Cloud-Optimized Hardware Market Outlook
Latin America is expanding on the strength of growing colocation and telecom infrastructure investment, particularly across Brazil and Argentina. Our findings suggest that expanding cloud service provider presence is increasing demand for cost-effective server and networking hardware. Strategic outlook favors continued growth in colocation deployment across major regional economies.
Middle East and Africa Cloud-Optimized Hardware Market Outlook
The Middle East and Africa region is expanding through government-backed digital infrastructure development programs tied to economic diversification initiatives. We observed that Gulf state sovereign cloud investment programs are increasing demand for hyperscale-grade server and networking hardware. Strategic outlook favors continued investment in regional data center infrastructure across the forecast period.
U.S. Cloud-Optimized Hardware Market
Based on our estimates, the U.S. cloud-optimized hardware market was valued at approximately USD 40.50 billion in 2025 and is projected to reach USD 98.55 billion by 2035, expanding at a 9.3% CAGR. Demand structure centers on hyperscale cloud service providers and enterprise data center operators, supported by leading custom silicon design infrastructure. Regulatory influence remains significant under Department of Commerce export control rules, and strategic outlook favors continued accelerator investment.
Canada Cloud-Optimized Hardware Market
The market in Canada was valued at approximately USD 8.50 billion in 2025 and is projected to reach USD 21.65 billion by 2035, expanding at a 9.8% CAGR. Adoption levels are supported by expanding hyperscale capacity in Ontario and Quebec, while technology penetration benefits from proximity to U.S. hardware manufacturing and design infrastructure. Strategic outlook favors steady growth in accelerator deployment.
UK Cloud-Optimized Hardware Market
As per our estimate, the UK cloud-optimized hardware market was valued at approximately USD 7.20 billion in 2025 and is projected to reach USD 16.58 billion by 2035, expanding at a 8.7% CAGR. Demand structure reflects strong colocation and hyperscale infrastructure alongside growing telecom cloud investment, with regulatory influence from UK data protection standards shaping deployment requirements. Strategic outlook favors continued hyperscale capacity growth.
Germany Cloud-Optimized Hardware Market
According to our analysis, the Germany cloud-optimized hardware market was valued at approximately USD 8.80 billion in 2025 and is projected to reach USD 20.64 billion by 2035, expanding at a 8.9% CAGR. Adoption levels benefit from strong data sovereignty requirements and established colocation infrastructure. Competitive intensity is high given the concentration of European data center operators, and strategic outlook favors continued regional infrastructure investment.
France Cloud-Optimized Hardware Market
Based on our estimates, the France cloud-optimized hardware market was valued at approximately USD 5.10 billion in 2025 and is projected to reach USD 11.64 billion by 2035, expanding at a 8.6% CAGR. Demand structure centers on established colocation infrastructure and growing hyperscale investment across major urban centers. Regulatory influence from French data sovereignty compliance supports specification-grade demand, and strategic outlook favors continued cloud infrastructure expansion.
China Cloud-Optimized Hardware Market
The market in China was valued at approximately USD 13.50 billion in 2025 and is projected to reach USD 49.61 billion by 2035, expanding at a 13.9% CAGR. Adoption levels are rising rapidly as domestic hyperscale providers expand data center capacity at scale. Regulatory influence remains more restrictive on cross-border semiconductor trade than North America, and strategic outlook favors continued domestic hardware manufacturing expansion.
India Cloud-Optimized Hardware Market
As per our estimate, the India cloud-optimized hardware market was valued at approximately USD 6.20 billion in 2025 and is projected to reach USD 25.52 billion by 2035, expanding at a 15.2% CAGR, the fastest among covered countries. Demand structure is driven by expanding hyperscale cloud investment and government digital infrastructure programs. Strategic outlook favors accelerated hardware procurement through the forecast period.
Japan Cloud-Optimized Hardware Market
According to our analysis, the Japan cloud-optimized hardware market was valued at approximately USD 5.80 billion in 2025 and is projected to reach USD 14.37 billion by 2035, expanding at a 9.5% CAGR. Adoption levels benefit from established domestic hyperscale infrastructure and high technology penetration, though competitive intensity remains concentrated among established regional providers. Strategic outlook favors gradual accelerator deployment growth.
South Korea Cloud-Optimized Hardware Market
Based on our estimates, the South Korea cloud-optimized hardware market was valued at approximately USD 3.90 billion in 2025 and is projected to reach USD 11.90 billion by 2035, expanding at a 11.8% CAGR. Demand structure reflects growing hyperscale investment and strong domestic semiconductor manufacturing capability. Strategic outlook favors continued growth supported by expanding regional cloud infrastructure.
Australia Cloud-Optimized Hardware Market
The market in Australia was valued at approximately USD 2.30 billion in 2025 and is projected to reach USD 6.47 billion by 2035, expanding at a 10.9% CAGR. Adoption levels are supported by expanding hyperscale and colocation capacity investment. Strategic outlook favors continued steady growth aligned with regional cloud infrastructure expansion.
UAE Cloud-Optimized Hardware Market
As per our estimate, the UAE cloud-optimized hardware market was valued at approximately USD 1.35 billion in 2025 and is projected to reach USD 4.01 billion by 2035, expanding at a 11.5% CAGR. Demand structure is anchored by sovereign cloud infrastructure investment and growing regional data center capacity. Strategic outlook favors continued growth concentrated in metropolitan digital infrastructure hubs.
Saudi Arabia Cloud-Optimized Hardware Market
According to our analysis, the Saudi Arabia cloud-optimized hardware market was valued at approximately USD 1.60 billion in 2025 and is projected to reach USD 5.01 billion by 2035, expanding at a 12.1% CAGR. Adoption levels are rising as Vision 2030 digital infrastructure initiatives expand hyperscale-grade data center capacity. Strategic outlook favors continued growth tied to sovereign cloud investment programs.
South Africa Cloud-Optimized Hardware Market
Based on our estimates, the South Africa cloud-optimized hardware market was valued at approximately USD 1.05 billion in 2025 and is projected to reach USD 2.88 billion by 2035, expanding at a 10.6% CAGR. Demand structure centers on expanding colocation and telecom infrastructure investment in major urban centers. Strategic outlook favors continued growth supported by regional cloud service provider expansion.
Brazil Cloud-Optimized Hardware Market
The market in Brazil was valued at approximately USD 4.30 billion in 2025 and is projected to reach USD 14.09 billion by 2035, expanding at a 12.6% CAGR. Adoption levels benefit from expanding hyperscale and colocation infrastructure investment across major urban regions. Strategic outlook favors continued growth across both cloud service provider and telecom operator segments.
Argentina Cloud-Optimized Hardware Market
As per our estimate, the Argentina cloud-optimized hardware market was valued at approximately USD 1.35 billion in 2025 and is projected to reach USD 3.90 billion by 2035, expanding at a 11.2% CAGR. Demand structure reflects growing colocation investment and expanding telecom cloud infrastructure. Strategic outlook favors steady growth concentrated in major metropolitan centers.
Supply Chain Structure of the Cloud-Optimized Hardware Market
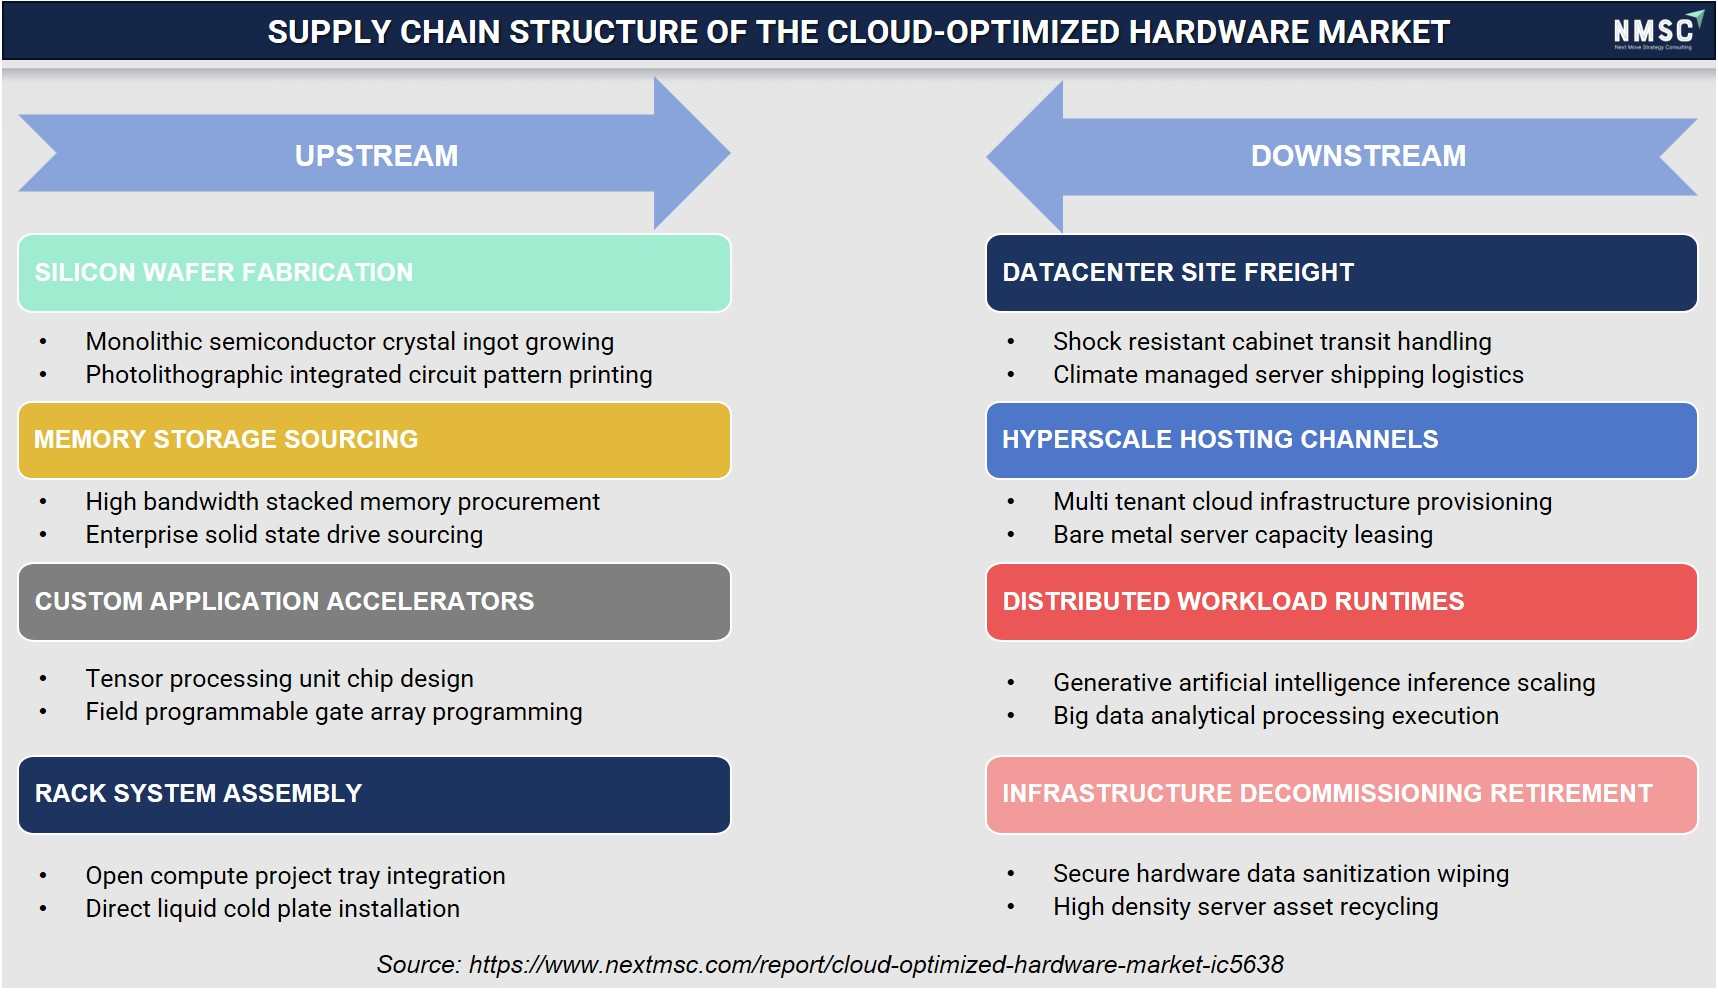
Based on research conducted by NMSC, we found that the supply chain structure of the Cloud-Optimized Hardware Market connects silicon wafer fabrication, high-bandwidth stacked memory, custom accelerator programming, and liquid-cooled rack assembly with specialized datacenter freight. Downstream, hyperscalers provision multi-tenant capacity for generative AI inference and big data processing. Ultimately, secure hardware data wiping and high-density asset recycling ensure safe infrastructure decommissioning and sustainable hardware management.
Competitive Landscape
We observed that the cloud-optimized hardware market remains moderately concentrated, with competitive intensity centered among large diversified semiconductor and server manufacturers alongside hyperscale providers designing proprietary silicon.
|
Aspect |
Details |
|
Market Structure |
Moderately concentrated, with the Top 10 companies holding an available market share while original design manufacturers serve high-volume hyperscale procurement. |
|
Innovation Focus |
Custom ASIC and accelerator design, liquid cooling infrastructure, and disaggregated server architecture. |
|
M&A Activity |
Selective acquisitions of custom silicon design firms and networking technology providers to expand product and architecture coverage. |
How Do Companies Compete in the Cloud-Optimized Hardware Market?
Companies compete primarily on silicon performance benchmarks and power efficiency metrics, since hyperscale buyers select hardware based on documented compute-per-watt and total cost of ownership data. Our analysis shows that companies with established custom silicon design capabilities and high-volume manufacturing partnerships command stronger hyperscale customer relationships than narrow, single-product manufacturers, while pricing strategies increasingly reflect performance-based premiums for accelerator and custom ASIC hardware.
Which Competitive Archetypes Dominate the Cloud-Optimized Hardware Market?
Three archetypes dominate: large diversified semiconductor companies with extensive accelerator and processor design infrastructure, server original design manufacturers with high-volume hyperscale production capacity, and hyperscale cloud providers designing proprietary silicon for internal workloads. We found that diversified semiconductor companies compete on architecture breadth and manufacturing scale, while hyperscale providers differentiate through workload-specific silicon optimization unavailable from merchant vendors.
What Innovation and Differentiation Strategies Are Companies Pursuing?
Manufacturers are investing in custom ASIC design services and advanced packaging technology to differentiate accelerator product lines from general-purpose alternatives. Our findings suggest that companies are increasingly publishing official performance benchmark disclosures to differentiate hardware on documented compute efficiency metrics, while some companies are piloting liquid cooling integration to support next-generation high-density accelerator deployments.
What M&A Activity Is Shaping the Cloud-Optimized Hardware Market?
Mergers and acquisitions activity centers on custom silicon design firm consolidation, as larger semiconductor companies acquire specialized chip design teams and networking technology providers to expand architecture coverage without ground-up development. We observed that companies are also pursuing selective partnerships with server original design manufacturers to expand hyperscale production capacity, reflecting a broader industry shift toward vertically integrated hardware supply chains.
Key Market Players
We found that the following companies represent the leading manufacturers and providers of cloud-optimized hardware globally, ranked by market-specific scale of operations.
-
NVIDIA Corporation
-
Intel Corporation
-
Advanced Micro Devices, Inc.
-
Dell Technologies Inc.
-
Hewlett Packard Enterprise Company
-
Super Micro Computer, Inc.
-
Lenovo Group Limited
-
Cisco Systems, Inc.
-
Arista Networks, Inc.
-
Broadcom Inc.
-
Marvell Technology, Inc.
-
Amazon.com, Inc.
-
Alphabet Inc.
-
Microsoft Corporation
-
Hon Hai Precision Industry Co., Ltd.
-
Quanta Computer Inc.
-
Wiwynn Corporation
-
Inspur Electronic Information Industry Co., Ltd.
-
Samsung Electronics Co., Ltd.
-
Western Digital Corporation
Latest Developments
We observed several verifiable developments across custom silicon and hardware infrastructure that are shaping near-term market direction.
|
Date |
Event |
|
July 2026 |
AMD announced an expanded long-term strategic partnership with Microsoft to supply next-generation hardware infrastructure for Azure. Microsoft will deploy the AMD Helios Rackscale Solution, integrating AMD Instinct MI455X GPUs, 6th Gen EPYC Venice CPUs, and Pensando DPUs to scale frontier AI inference workloads and cloud networking performance. |
|
June 2026 |
Dell Technologies introduced the PowerEdge XE8812 server as part of the expanded Dell AI Factory with NVIDIA. Featuring liquid-cooled NVIDIA Vera Rubin NVL4 architecture, the OCP-standard rack system scales up to 144 GPUs per rack to accelerate high-performance computing, complex simulations, and enterprise generative AI workloads. |
|
March 2026 |
NVIDIA announced its next-generation Vera Rubin platform for agentic AI infrastructure. Featuring seven new chips in full production, including Vera CPUs, Rubin GPUs, NVLink 6 Switches, ConnectX-9 SuperNICs, BlueField-4 DPUs, Spectrum-6 Ethernet switches, and Groq 3 LPUs, the platform provides configurable rack- and POD-scale infrastructure designed to scale large AI factory deployments through global cloud providers and system manufacturers. |
|
March 2026 |
Intel announced that its Xeon 6 processors were selected as host CPUs for NVIDIA DGX Rubin NVL8 systems. Designed to govern orchestration, memory bandwidth, and confidential compute, Xeon 6 delivers high memory bandwidth and PCIe 5.0 lanes required to maximize real-time AI inference performance in accelerated server architectures. |
Investment Opportunities
Where Is Capital Flowing Within the Cloud-Optimized Hardware Market?
Capital continues to concentrate in custom silicon design and accelerator manufacturing capacity expansion. We observed that NVIDIA Corporation has directed continued capital expenditure toward data center accelerator production capacity, per official corporate disclosures, signaling sustained investor confidence in AI-optimized hardware infrastructure.
How Is Infrastructure Investment Shaping the Market?
Infrastructure investment is concentrated in liquid cooling system deployment and power distribution upgrades that support high-density accelerator installations. Our findings suggest that companies operating in North America and Asia-Pacific are directing capital toward advanced cooling infrastructure specifically to accommodate rising rack power density from accelerator deployment.
What ESG Considerations Are Relevant to Cloud-Optimized Hardware Market Investment?
Environmental, social, and governance considerations center on data center energy efficiency and renewable power procurement given rising electricity consumption from accelerator-dense infrastructure. Social considerations include semiconductor supply chain labor practices, while governance considerations relate to transparent compliance with export control regulations and responsible sourcing of critical minerals used in hardware manufacturing.
Key Benefits for Stakeholders
How Does This Report Benefit Industry Leaders?
Industry leaders gain a validated market-sizing and segmentation framework to prioritize hardware investment across components, deployment types, and regions. The report's country-level revenue and CAGR data support capital-allocation decisions for companies evaluating new manufacturing-capacity investment through 2035.
How Does This Report Benefit Investors and Financial Analysts?
Investors and financial analysts gain a fundamentals-based CAGR methodology, competitive landscape mapping, and a Top 20 company benchmark set, supporting valuation and portfolio-allocation decisions across semiconductor, server manufacturing, and networking hardware companies.
How Does This Report Benefit Technology Vendors and Product Teams?
Technology vendors and product teams gain segment-level demand signals, including the fastest-growing accelerators and custom silicon and edge data center categories, to prioritize product roadmaps around custom ASIC design and power-efficient cooling infrastructure.
Key Market Segments
By Component
-
Servers
-
Storage Systems
-
Networking Equipment
-
Accelerators and Custom Silicon
-
Cooling and Power Infrastructure
By Deployment
-
Hyperscale Data Center
-
Colocation Data Center
-
Edge Data Center
By Processor Architecture
-
x86 Architecture
-
ARM Architecture
-
Custom ASIC and Silicon
By End User
-
Cloud Service Providers
-
Enterprise
-
Telecom Operators
By Region
-
North America: U.S., Canada, Mexico
-
Europe: UK, Germany, France, Italy, Spain, Sweden, Denmark, Finland, Netherlands, Rest of Europe
-
Asia-Pacific: China, India, Japan, South Korea, Taiwan, Indonesia, Vietnam, Australia```html , Philippines, Malaysia, Rest of APAC
-
Middle East & Africa: Saudi Arabia, UAE, Egypt, Israel, Turkey, Nigeria, South Africa, Rest of MEA
-
Latin America: Brazil, Argentina, Chile, Colombia, Rest of LATAM
Conclusion and Recommendations
What Is the Long-Term Outlook for the Cloud-Optimized Hardware Market?
The long-term outlook remains strongly positive, with the market projected to expand from USD 128.60 billion in 2025 to USD 356.40 billion by 2035 at a 10.70% CAGR. We observed that structural drivers, including AI accelerator deployment and hyperscale capacity expansion, are durable rather than cyclical, supporting continued double-digit growth across most segments through the forecast period.
What Strategic Positioning Should Providers Pursue?
Providers should prioritize custom silicon design capability and power-efficient cooling infrastructure over undifferentiated general-purpose hardware positioning, since hyperscale customer retention correlates strongly with documented performance-per-watt metrics. Our assessment indicates that companies integrating accelerator design with high-volume manufacturing partnerships will differentiate as competitive intensity increases through 2035.
How Attractive Is the Market for New Investment?
Investment attractiveness is high across custom silicon development and edge infrastructure expansion, given a USD 213.60 billion absolute dollar opportunity between 2026 and 2035. We found that accelerators and custom silicon offer the strongest risk-adjusted entry point given their 14.8% segment CAGR and sustained hyperscale procurement demand.
What Market Shifts and Key Risks Should Stakeholders Monitor?
Stakeholders should monitor export control restrictions on advanced semiconductor trade, which could limit cross-border hardware availability, alongside persistent semiconductor supply chain constraints affecting production timelines. Our analysis shows that companies with diversified regional manufacturing and supply chain infrastructure are better positioned to absorb these regulatory and supply risks than narrowly concentrated hardware manufacturers.
What Are the Primary Growth Pathways Through 2035?
Primary growth pathways include expansion of custom ASIC design services, deeper integration of liquid cooling infrastructure, and continued edge data center hardware development. We observed that companies combining at least two of these pathways are best positioned to capture disproportionate share of the USD 227.80 billion in incremental revenue generated between 2025 and 2035.
About the Author
 Saista Faiyaz
— Saista Faiyaz is Research Associate at Next Move Strategy Consulting, where she has covered consumer markets and healthcare technologies for 3 years. Her work includes primary interview review, secondary-source validation, market sizing, and structured analysis of company and industry data. She supports research by comparing evidence across sources, organizing findings into market narratives, and documenting assumptions used in analysis. Her scope includes cross-market benchmarking, and reports.
Saista Faiyaz
— Saista Faiyaz is Research Associate at Next Move Strategy Consulting, where she has covered consumer markets and healthcare technologies for 3 years. Her work includes primary interview review, secondary-source validation, market sizing, and structured analysis of company and industry data. She supports research by comparing evidence across sources, organizing findings into market narratives, and documenting assumptions used in analysis. Her scope includes cross-market benchmarking, and reports.
About the Reviewer
 Supradip Baul
— Supradip Baul is an accomplished business consultant and strategist with over a decade of rich experience in market intelligence, strategy, technology, and business transformation. His work has included rigorous qualitative and quantitative analysis across multiple industries, helping clients shape investment decisions and long-term roadmaps. Earlier in his career, he was associated with Gartner, where he contributed to industry-leading reports and market share analyses. He has worked with leading global companies and holds an MBA with a dual specialization in Marketing and Finance.
Supradip Baul
— Supradip Baul is an accomplished business consultant and strategist with over a decade of rich experience in market intelligence, strategy, technology, and business transformation. His work has included rigorous qualitative and quantitative analysis across multiple industries, helping clients shape investment decisions and long-term roadmaps. Earlier in his career, he was associated with Gartner, where he contributed to industry-leading reports and market share analyses. He has worked with leading global companies and holds an MBA with a dual specialization in Marketing and Finance.
At Next Move Strategy Consulting, we understand that insightful market research is the cornerstone of successful business decisions. That's why we employ a robust and multifaceted approach, combining various methodologies to deliver the most accurate and actionable data for our clients.

Research Landscape
We navigate the world of research with two primary approaches:
Qualitative Approach
Our qualitative research methodologies involve immersive techniques such as in-depth interviews, focus groups, and observational studies. By engaging directly with individuals and stakeholders, we uncover valuable insights that quantitative data alone may overlook.

Quantitative Research
In tandem with qualitative methodologies, NMSC leverages the power of Quantitative Research to provide a robust foundation of numerical insights. Through systematic data collection and analysis, we quantify patterns, preferences, and market trends, offering a comprehensive view of the business landscape.
Our quantitative research approach employs diverse tools, including surveys, experiments, and statistical modelling. These methodologies enable us to gather data from a large and representative sample, ensuring the statistical significance of our findings. By employing structured questionnaires and standardized data collection methods, we guarantee the reliability and validity of the information we present to our clients.
Quantitative research is particularly effective in measuring the prevalence of trends, assessing market size, and gauging the impact of various factors on consumer behavior. The numerical precision attained through this approach equips our clients with actionable insights, facilitating data-driven decision-making and strategy formulation.


Our Specialized Toolbox for Industry-Specific Market Research
We deploy a specialized arsenal of techniques tailored to meet your unique requirements. Here's a glimpse into our comprehensive toolbox:

Information Procurement
The stage entails acquiring market data or relevant information through various sources and methodologies.


Market Research Approach
We utilize both top-down and bottom-up approaches in market research analysis to achieve a comprehensive understanding of the market dynamics, leveraging the broad perspective of industry trends and macroeconomic factors alongside detailed insights from specific segments and individual companies.

Porters Five Forces Analysis
We conduct Porter's Five Forces analysis to evaluate the competitive landscape of an industry, providing us with insights into factors that affect profitability and strategic positioning.

SWOT Analysis

Forecasting
We utilize a forecasting model to predict future consumption by considering parameters like population, economics, regulations, market competition, drivers, constraints, technology, and pricing. We also employ statistical techniques such as multilinear regression, exponential smoothing, moving average, ARIMA, and Monte Carlo simulations for accurate predictions. In econometric forecasting, we analyzed short-term and long-term event impacts, attributing values based on regulatory frameworks, economic factors, and market events.





 Speak to Our Analyst