Critical Minerals and Rare Earths Market Global Industry Analysis and Forecast (2026–2035)

The global Critical Minerals and Rare Earths Market size was valued at USD 368.4 billion in 2025 and is estimated at USD 401.2 billion in 2026, forecast to reach USD 943.7 billion by 2035, expanding at a 9.97% CAGR between 2026 and 2035. Asia-Pacific leads with approximately 46% share, while Copper dominates all other mineral types with approximately 28% share.

Download Free Sample PDF
Base Year (2025)
$368.40 Billion
Forecast (2035)
$943.70 Billion
CAGR (2026-2035)
10.0%
Top Region
Asia-Pacific

What Are the Critical Minerals and Rare Earths Market Size?

The global critical minerals and rare earths market size was valued at USD 368.4 billion in 2025 and is estimated at USD 401.2 billion in 2026, forecast to reach USD 943.7 billion by 2035, expanding at a 9.97% CAGR between 2026 and 2035. Asia-Pacific leads with approximately 46% share, while Copper dominates all other mineral types with approximately 28% share.

We observed that growth is broad-based across every segmentation axis, with defense-driven stockpiling and Western processing capacity investment driving the most pronounced structural shifts through 2035.

Critical Minerals and Rare Earths Market Global Industry Analysis and Forecast (2026–2035) Revenue Forecast

Values in USD Billion

2025 $368.40 Billion
2025
2026 $401.20 Billion
2026
2027 $441.20 Billion
2027
2028 $485.19 Billion
2028
2029 $533.56 Billion
2029
2030 $586.76 Billion
2030
2031 $645.26 Billion
2031
2032 $709.59 Billion
2032
2033 $780.33 Billion
2033
2034 $858.13 Billion
2034
2035 $943.70 Billion
2035

Key Takeaways

By Mineral Type: Copper held the largest share of approximately 28% (USD 103.15 billion) in 2025; Graphite is the fastest-growing sub-segment at 13.5% CAGR from 2026–2035.

By Value Chain Stage: Mining and Extraction held the largest share of approximately 58% (USD 213.67 billion) in 2025; Recycling and Recovery is the fastest-growing sub-segment at 17.9% CAGR from 2026–2035.

By Application: Battery and Energy Storage held the largest share of approximately 32% (USD 117.88 billion) in 2025; Defense and Aerospace is the fastest-growing sub-segment at 14.6% CAGR from 2026–2035.

By End-Use Industry: Automotive held the largest share of approximately 30% (USD 110.52 billion) in 2025; Defense and Aerospace is the fastest-growing sub-segment at 14.6% CAGR from 2026–2035.

Dominant Region: Asia-Pacific dominated with approximately 46% revenue share (USD 169.46 billion) in 2025.

Fastest-Growing Region: North America is expected to register the highest CAGR of 11.9% during 2026–2035.

Dominant Country: China led with approximately USD 88,119 million in 2025.

Fastest-Growing Country: Saudi Arabia is the fastest-growing country at approximately 13.0% CAGR from 2026–2035.

What Does the Critical Minerals and Rare Earths Market Encompass?

The critical minerals and rare earths market encompasses copper, nickel, lithium, rare earth elements, cobalt, graphite, platinum group metals, and other critical minerals extracted, processed, refined, and recycled for use in battery and energy storage, permanent magnets and electronics, renewable energy technologies, defense and aerospace, and catalyst and industrial applications. We observed that the scope spans automotive, electronics and semiconductor, renewable energy, defense and aerospace, and industrial manufacturing end-use industries sourcing minerals across mining and extraction, processing and refining, and recycling and recovery value chain stages. The category has evolved from a commodity input business into a geopolitically strategic sector as supply concentration risk has become a defining policy concern for importing nations.
Regulatory frameworks such as China's Ministry of Commerce export licensing controls on rare earth elements and equipment shape global supply availability across the industry. Our assessment indicates that technology adoption is shifting toward recycling and recovery processes that reduce reliance on newly mined material, alongside government-backed offtake agreements that de-risk Western processing capacity investment. Next Move Strategy Consulting's analysis indicates that this structural shift, combined with the International Energy Agency's finding that China refines 19 of 20 strategic minerals with an average 70% market share, is redefining supply chain strategy across the critical minerals and rare earths market.

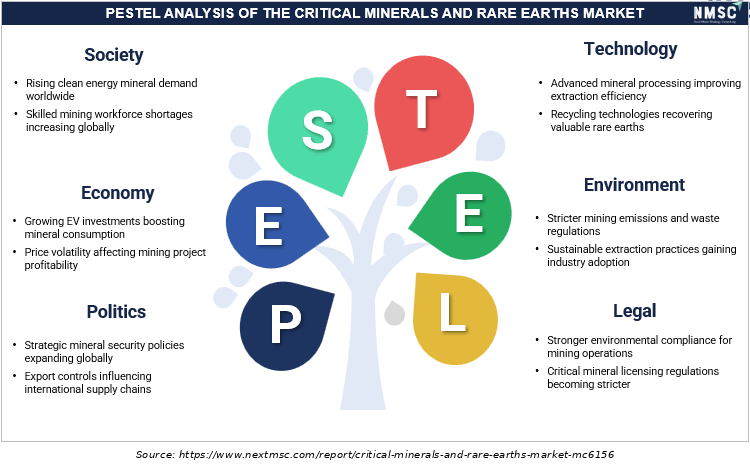
PESTEL ANALYSIS OF THE CRITICAL MINERALS AND RARE EARTHS MARKET

PESTEL ANALYSIS OF THE CRITICAL MINERALS AND RARE EARTHS MARKET
The PESTEL analysis of the Critical Minerals and Rare Earths Market evaluates the external factors influencing industry growth. Political support for resource security, economic demand from clean energy and EVs, social emphasis on sustainability, technological advancements in extraction and recycling, environmental regulations, and evolving legal frameworks collectively shape market dynamics. These factors impact investment decisions, supply chain resilience, production capacity, and the long-term competitiveness of critical mineral and rare Earths industries worldwide.

Market Drivers & Dynamics

Interactive Dataset
Rising electric vehicle and battery storage demand for lithium and nickel driver +3.2% Global 2026–2035
Government-backed offtake agreements financing Western processing capacity driver +2.4% North America, Europe 2026–2032
Defense and aerospace stockpiling following China's export control expansion driver +2.9% North America, Europe 2026–2030
New bilateral mineral supply partnerships diversifying sourcing driver +1.6% Middle East & Africa, Global 2026–2035
Expanding renewable energy and permanent magnet manufacturing demand driver +1.9% Global 2026–2035
Growing recycling and recovery infrastructure investment driver +1.3% Global 2026–2032
China's export licensing controls creating supply availability uncertainty restraint −2.1% Global 2026–2030
High capital cost and long lead times for new processing capacity restraint −1.4% North America, Europe 2026–2032
Environmental permitting delays for new mining and processing projects restraint −0.8% Global 2026–2030
Source: Next Move Strategy Consulting

Growth Drivers

What Is the Primary Growth Driver of the Critical Minerals and Rare Earths Market?

Rising electric vehicle and battery storage demand for lithium and nickel remains the primary growth driver of the market. The International Energy Agency's Global Critical Minerals Outlook 2025 confirmed that China refines 19 of 20 important strategic minerals with an average market share of 70%, underscoring the scale of processing capacity that battery and permanent magnet supply chains depend on. We observed that this concentration is sustaining sequential demand for both primary mined material and alternative processing capacity.

How Is Defense Stockpiling Driving the Market Growth?

Defense and aerospace stockpiling is driving growth following China's escalating rare earth export control regime. The U.S. Department of Defense confirmed its USD 400 million investment in MP Materials Corp. in July 2025, structured with a ten-year offtake agreement at a USD 110 per kilogram price floor to secure domestic magnet production for defense applications. Our assessment indicates that this government-backed financing model is accelerating similar investment commitments across allied nations seeking supply chain resilience.

Growth Inhibitors

What Is Restraining Critical Minerals and Rare Earths Market Expansion?

China's export licensing controls restrain broader market expansion by creating supply availability uncertainty for downstream manufacturers. China's Ministry of Commerce confirmed that its October 2025 export control expansion extended licensing requirements extraterritorially to foreign-made products containing Chinese-origin rare earth content, though implementation was subsequently suspended for one year following an October 30, 2025 bilateral agreement. We found that this policy volatility continues to complicate long-term procurement planning for manufacturers dependent on rare earth magnet supply.

What Are the Growth Opportunities?

How Can Government-Backed Offtake Agreements Unlock Value for Western Producers?

Government-backed offtake agreements present a whitespace opportunity for non-Chinese rare earth and critical mineral producers seeking financing certainty. Companies that secure price floor guarantees, following the model established by MP Materials' agreement with the U.S. Department of Defense, stand to capture stable, long-term revenue that de-risks capital-intensive processing capacity investment.

Where Does Recycling and Recovery Infrastructure Create New Demand?

Recycling and recovery infrastructure creates a significant opportunity for companies seeking to reduce primary mining dependence and supply chain concentration risk. Suppliers that scale battery and magnet recycling capacity can capture growing demand from manufacturers seeking to diversify feedstock sources away from geographically concentrated mining and refining operations.

How Can Bilateral Mineral Partnerships Benefit Emerging Producer Nations?

Bilateral government mineral partnerships create an opportunity for emerging producer nations with untapped critical mineral reserves. Countries that establish diplomatic supply agreements, following the U.S.-Saudi Arabia Strategic Framework for Cooperation, can attract international processing investment and technical expertise to develop domestic mining and refining capacity ahead of competing emerging producers.

Segmentation Analysis

2025 (USD Billion)
2035 (USD Billion)
Copper 2025: $103.15 Billion | 2035: $226.47 Billion
Copper
Nickel 2025: $58.94 Billion | 2035: $141.56 Billion
Nickel
Lithium 2025: $51.58 Billion | 2035: $169.87 Billion
Lithium
Rare Earth Elements 2025: $44.21 Billion | 2035: $132.12 Billion
Rare Earth E
Cobalt 2025: $29.47 Billion | 2035: $75.50 Billion
Cobalt
Graphite 2025: $22.10 Billion | 2035: $75.50 Billion
Graphite
Platinum Group Metals 2025: $33.16 Billion | 2035: $66.06 Billion
Platinum Gro
Other Critical Minerals 2025: $25.79 Billion | 2035: $56.62 Billion
Other Critic
Copper $103.15 Billion $226.47 Billion 8.1%
Nickel $58.94 Billion $141.56 Billion 9.2%
Lithium $51.58 Billion $169.87 Billion 13.1%
Rare Earth Elements $44.21 Billion $132.12 Billion 11.9%
Cobalt $29.47 Billion $75.50 Billion 10.0%
Graphite $22.10 Billion $75.50 Billion 13.5%
Platinum Group Metals $33.16 Billion $66.06 Billion 6.9%
Other Critical Minerals $25.79 Billion $56.62 Billion 8.1%

Which Mineral Type Segment Dominates the Critical Minerals and Rare Earths Market?

Copper led the market with USD 103.15 billion in 2025, supported by its status as the highest-volume critical mineral consumed across electrification, construction, and industrial manufacturing applications. We observed that Graphite is the fastest-growing mineral type, expanding at a 13.5% CAGR from 2026 to 2035, as battery anode demand scales alongside China's export control measures on graphite items, which are prompting importing nations to diversify graphite supply sources.

2025 (USD Billion)
2035 (USD Billion)
Mining and E
Processing a
Recycling an
Segment Item 2025 (USD Billion) 2035 (USD Billion) CAGR
Mining and Extraction $10.0 USD Billion $40.0 USD Billion 15.0%
Processing and Refining $17.1 USD Billion $51.1 USD Billion 25.0%
Recycling and Recovery $24.2 USD Billion $62.2 USD Billion 15.0%

Segment-wise data is locked

Unlock complete segment-wise numbers for By Value Chain Stage.

Unlock Full Data
2025 (USD Billion)
2035 (USD Billion)
Battery and
Permanent Ma
Renewable En
Defense and
Catalysts an
Segment Item 2025 (USD Billion) 2035 (USD Billion) CAGR
Battery and Energy Storage $10.0 USD Billion $40.0 USD Billion 15.0%
Permanent Magnets and Electronics $17.1 USD Billion $51.1 USD Billion 21.0%
Renewable Energy Technologies $24.2 USD Billion $62.2 USD Billion 11.0%
Defense and Aerospace $31.3 USD Billion $73.3 USD Billion 21.0%
Catalysts and Industrial Applications $38.4 USD Billion $84.4 USD Billion 14.0%

Segment-wise data is locked

Unlock complete segment-wise numbers for By Application.

Unlock Full Data

Which Application Segment Leads Market Demand?

Battery and Energy Storage remained the leading application, valued at USD 117.88 billion in 2025, reflecting sustained electric vehicle and grid storage deployment worldwide. Our findings suggest that Defense and Aerospace is the fastest-growing application, registering a 14.6% CAGR from 2026 to 2035, as governments accelerate rare earth magnet stockpiling and domestic supply chain investment following China's escalating export control measures on strategic minerals.

2025 (USD Billion)
2035 (USD Billion)
Automotive
Electronics
Renewable En
Industrial M
Defense and
Segment Item 2025 (USD Billion) 2035 (USD Billion) CAGR
Automotive $10.0 USD Billion $40.0 USD Billion 9.0%
Electronics and Semiconductors $17.1 USD Billion $51.1 USD Billion 11.0%
Renewable Energy $24.2 USD Billion $62.2 USD Billion 25.0%
Industrial Manufacturing $31.3 USD Billion $73.3 USD Billion 15.0%
Defense and Aerospace $38.4 USD Billion $84.4 USD Billion 16.0%

Segment-wise data is locked

Unlock complete segment-wise numbers for By End-Use Industry.

Unlock Full Data

Which End-Use Industry Segment Dominates the Critical Minerals and Rare Earths Market?

Automotive remained the leading end-use industry, reaching USD 110.52 billion in 2025, as electric vehicle production continues to scale globally and consume lithium, nickel, cobalt, and rare earth magnet materials. Based on research conducted by Next Move Strategy Consulting, we found that Defense and Aerospace is the fastest-growing end-use industry, expanding at a 14.6% CAGR from 2026 to 2035, as government procurement programs prioritize secure, non-Chinese rare earth magnet supply for military applications.

Growth Opportunities

Our analysis shows that three forward-looking opportunities stand out for stakeholders positioning within the critical minerals and rare earths market over the 2026–2035 forecast period.

How Can Government-Backed Offtake Agreements Unlock Value for Western Producers?

Government-backed offtake agreements present a whitespace opportunity for non-Chinese rare earth and critical mineral producers seeking financing certainty. Companies that secure price floor guarantees, following the model established by MP Materials' agreement with the U.S. Department of Defense, stand to capture stable, long-term revenue that de-risks capital-intensive processing capacity investment.

Where Does Recycling and Recovery Infrastructure Create New Demand?

Recycling and recovery infrastructure creates a significant opportunity for companies seeking to reduce primary mining dependence and supply chain concentration risk. Suppliers that scale battery and magnet recycling capacity can capture growing demand from manufacturers seeking to diversify feedstock sources away from geographically concentrated mining and refining operations.

How Can Bilateral Mineral Partnerships Benefit Emerging Producer Nations?

Bilateral government mineral partnerships create an opportunity for emerging producer nations with untapped critical mineral reserves. Countries that establish diplomatic supply agreements, following the U.S.-Saudi Arabia Strategic Framework for Cooperation, can attract international processing investment and technical expertise to develop domestic mining and refining capacity ahead of competing emerging producers.

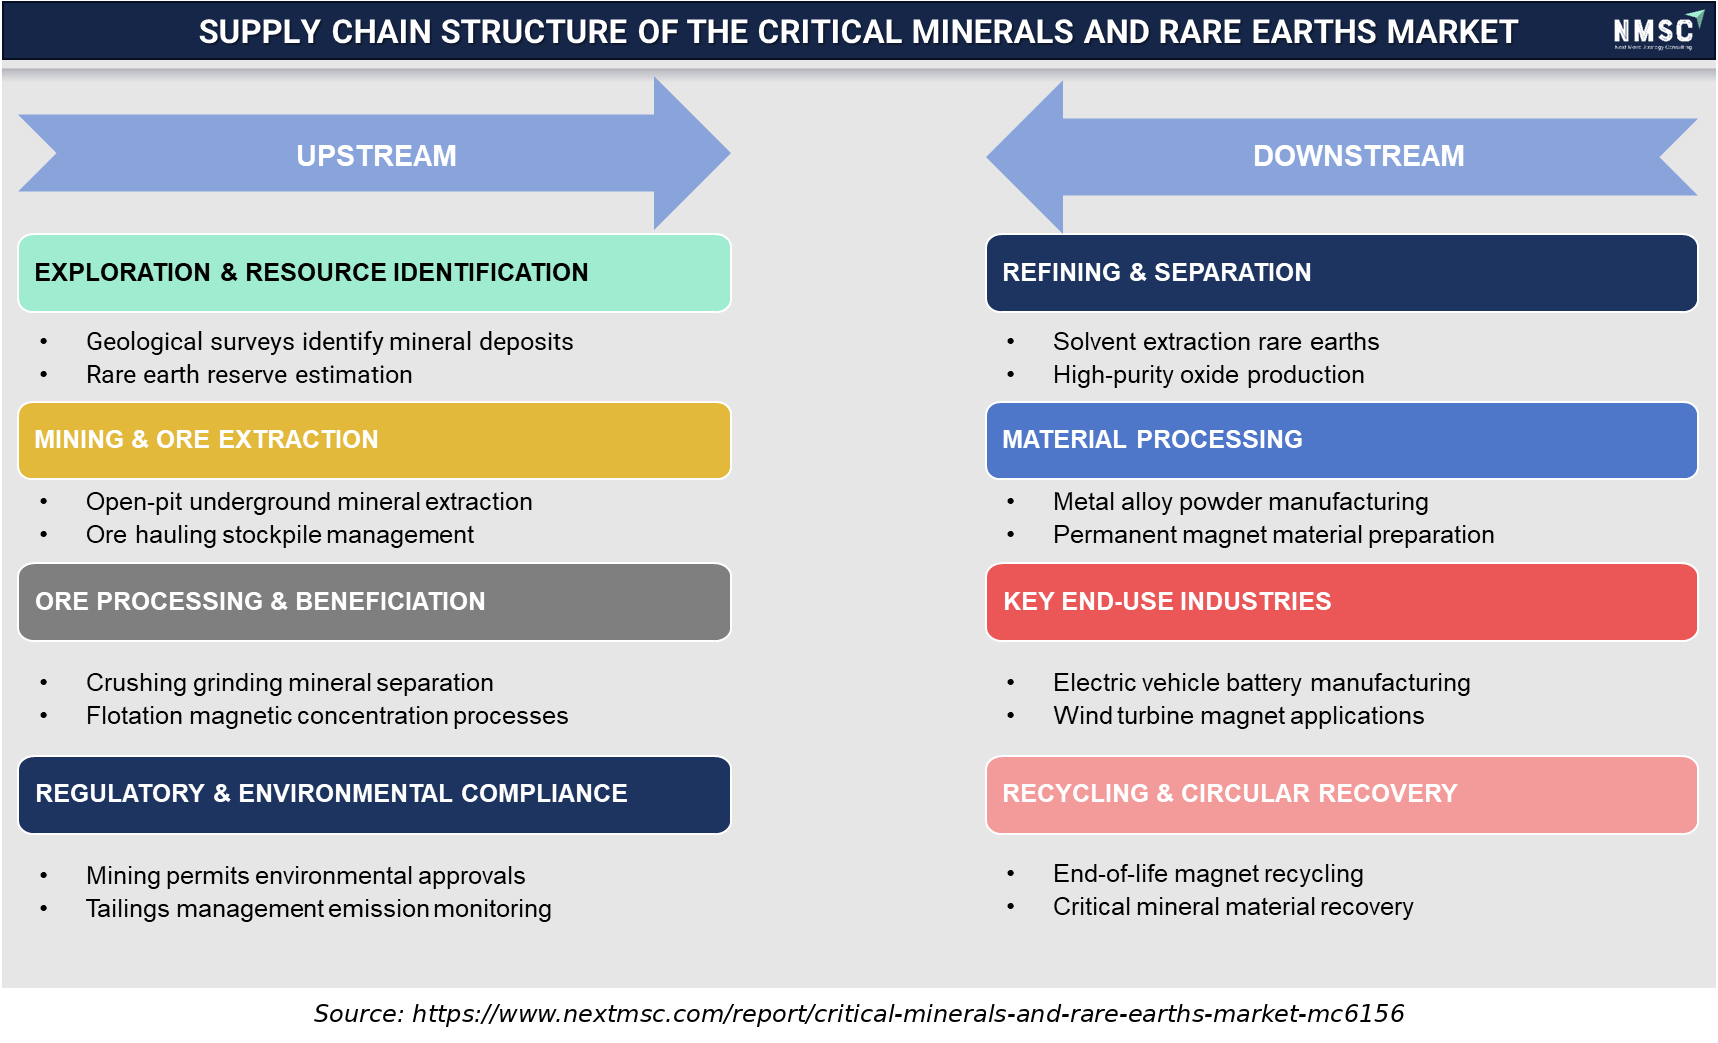
SUPPLY CHAIN STRUCTURE OF THE CRITICAL MINERALS AND RARE EARTHS MARKET

SUPPLY CHAIN STRUCTURE OF THE CRITICAL MINERALS AND RARE EARTHS MARKET
The supply chain structure of the Critical Minerals and Rare Earths Market spans upstream exploration, mining, ore processing, and regulatory compliance, followed by downstream refining, material processing, end-use manufacturing, and recycling. Each stage plays a vital role in ensuring a stable supply of critical minerals for electric vehicles, renewable energy systems, electronics, and defense applications. Efficient supply chain integration enhances resource security, sustainability, value addition, and circular economy initiatives across the global market.

Regional Outlook

2025 (USD Billion)
2035 (USD Billion)
North Americ
Europe
Asia-Pacific
Middle East
Latin Americ
Region 2025 (USD Billion) 2035 (USD Billion) CAGR (%)
North America $10.0 USD Billion $40.0 USD Billion 9.0%
Europe $17.1 USD Billion $51.1 USD Billion 27.0%
Asia-Pacific $24.2 USD Billion $62.2 USD Billion 25.0%
Middle East & Africa $31.3 USD Billion $73.3 USD Billion 23.0%
Latin America $38.4 USD Billion $84.4 USD Billion 12.0%

Regional data is locked

Unlock complete regional numbers for this market.

Unlock Full Data

Competitive Landscape

We observed that the competitive landscape spans state-owned Chinese processing giants, diversified global mining conglomerates, and emerging Western and allied-nation producers backed by government financing.

Dimension Description
Category Assessment
Market Structure Highly concentrated in processing; Chinese state-owned producers hold dominant refining share, while diversified global miners and emerging Western producers compete for primary extraction and downstream diversification
Innovation Focus Government-backed offtake financing, recycling and recovery technology, domestic magnet manufacturing, and supply chain traceability
M&A Activity Strategic government investment activity, including the U.S. Department of Defense's equity stake in MP Materials and new bilateral mineral supply partnerships

How Do Companies Compete in the Critical Minerals and Rare Earths Market?

Companies compete primarily on processing capacity scale, government relationship depth, and the ability to secure long-term offtake agreements that de-risk capital investment. We found that government-backed price floor guarantees, exemplified by MP Materials' agreement with the U.S. Department of Defense, increasingly anchor competitive positioning for non-Chinese producers. Pricing strategies remain closely tied to Chinese benchmark pricing, pushing Western producers toward government financing to remain viable against lower-cost Chinese supply.

Which Competitive Archetypes Dominate the Critical Minerals and Rare Earths Market?

Two archetypes dominate the critical minerals and rare earths market: state-backed Chinese processing giants that compete on integrated scale and cost efficiency, and diversified global mining conglomerates and emerging Western producers that compete on supply chain security and government-backed financing access. Our analysis shows that differentiation increasingly centers on non-Chinese origin certification, positioning allied-nation producers to capture defense and government procurement contracts requiring diversified sourcing.

How Are Companies Differentiating Through Innovation?

Leading companies are differentiating through recycling and recovery technology, domestic magnet manufacturing capability, and supply chain traceability certification. During our market evaluation, we noticed that several producers are simultaneously expanding processing capacity and pursuing government offtake agreements, positioning themselves as strategically essential suppliers rather than commodity producers competing purely on price.

What M&A and Geographic Expansion Activity Is Reshaping the Market?

Geographic expansion through new processing facilities and bilateral government partnerships is reshaping competitive positioning across the industry. We observed that Neo Performance Materials' new Estonia processing facility and the U.S.-Saudi Arabia Strategic Framework for Cooperation both illustrate how producers and governments are simultaneously diversifying geographic supply concentration away from China, a pattern likely to continue as importing nations prioritize supply chain resilience through 2035.

Key Market Players

Our assessment indicates that the following companies represent the leading producers shaping competitive dynamics across the critical minerals and rare earths market.

China Northern Rare Earth Group High-Tech Co., Ltd. China Rare Earth Group Co., Ltd. MP Materials Corp. Lynas Rare Earths Limited Iluka Resources Limited Albemarle Corporation Sociedad Química y Minera de Chile S.A. (SQM) Ganfeng Lithium Group Co., Ltd. Tianqi Lithium Corporation Glencore plc Vale S.A. Rio Tinto Group BHP Group Limited Freeport-McMoRan Inc. CMOC Group Limited Umicore SA MMC Norilsk Nickel PJSC Sumitomo Metal Mining Co., Ltd. Shenghe Resources Holding Co., Ltd. Neo Performance Materials Inc.

Latest Developments

We found that recent export control actions, government investments, and bilateral agreements underscore the pace of change across the critical minerals and rare earths supply chain.

Date Event
July 2026 SQM and Wesfarmers approved the final investment decision to expand the Mt Holland lithium project in Western Australia. The expansion is expected to double nameplate spodumene concentrate production from approximately 380,000 tonnes per year to 760,000 tonnes per year. Construction of a second concentrator is expected to commence in the second half of 2027, with first production from the expansion targeted for the first half of 2030.
April 2026 Neo Performance Materials commissioned a small-scale Heavy Rare Earth (HREE) solvent-extraction production line at its Silmet facility in Estonia. The line reached nameplate operation and produced its first separated terbium and dysprosium process solutions from mixed rare-earth carbonate feedstock, with the entire processing sequence completed in Europe.

Investment Opportunities

Where Are Capital Inflows Concentrated in the Critical Minerals and Rare Earths Market?

Capital inflows are concentrated in government-backed processing capacity and bilateral supply partnerships. We observed that the U.S. Department of Defense's USD 400 million investment in MP Materials Corp. and the U.S.-Saudi Arabia Strategic Framework for Cooperation both represent significant government capital commitments since mid-2025. This pattern reflects sustained public sector confidence in the strategic necessity of diversified critical mineral supply chains.

How Is Infrastructure Investment Expanding Processing Capacity?

Infrastructure investment is expanding processing capacity as producers scale operations to serve growing defense, automotive, and electronics demand. We found that Neo Performance Materials' new Estonia processing facility and MP Materials' expanded domestic operations both reflect sustained investment in non-Chinese rare earth separation and magnet manufacturing capability commissioned during 2025.

What ESG Considerations Are Shaping Critical Minerals and Rare Earths Investment?

Environmental, social, and governance considerations are shaping investment as mining and processing operations face increasing scrutiny over environmental permitting and community impact. Our findings suggest that producers with documented environmental compliance and transparent sourcing practices increasingly attract institutional and government investment, favoring companies that can demonstrate responsible extraction practices over less transparent operations facing permitting delays.

Key Benefits for Stakeholders

How Does This Report Benefit Enterprise and Industry Leaders?

Enterprise and industry leaders gain a structured view of segment-level demand across mineral type, value chain stage, application, and end-use industry, supported by Next Move Strategy Consulting's forecasts through 2035. Our analysis shows that this data enables supply chain planning decisions, helping manufacturers prioritize investment in the fastest-growing segments, including defense-linked applications and recycling and recovery infrastructure.

How Does This Report Benefit Investors and Financial Analysts?

Investors and financial analysts benefit from validated market sizing, regional growth differentials, and competitive landscape analysis that inform capital allocation decisions. We found that the report's country-level revenue breakdowns and CAGR projections support comparative evaluation of expansion opportunities across North America, Europe, Asia-Pacific, the Middle East & Africa, and Latin America, strengthening due diligence on mineral-related investment targets.

How Does This Report Benefit Technology Vendors and Product Teams?

Technology vendors and product teams gain insight into emerging trends, including government-backed offtake financing, recycling and recovery technology, and bilateral supply chain partnerships. Our assessment indicates that this analysis helps product teams prioritize research and development roadmaps toward the mineral types and applications showing the strongest forecast growth, improving alignment between innovation investment and evolving government procurement requirements.

Key Market Segments Evaluated

By Mineral Type

  • Copper
  • Nickel
  • Lithium
  • Rare Earth Elements
  • Cobalt
  • Graphite
  • Platinum Group Metals
  • Other Critical Minerals

By Value Chain Stage

  • Mining and Extraction
  • Processing and Refining
  • Recycling and Recovery

By Application

  • Battery and Energy Storage
  • Permanent Magnets and Electronics
  • Renewable Energy Technologies
  • Defense and Aerospace
  • Catalysts and Industrial Applications
  • Other Applications

By End-Use Industry

  • Automotive
  • Electronics and Semiconductors
  • Renewable Energy
  • Industrial Manufacturing
  • Defense and Aerospace
  • Other Industries

By Region

  • North America 
    • U.S.
    • Canada
    • Mexico
  • Europe 
    • UK
    • Germany
    • France
    • Italy
    • Spain
    • Sweden
    • Denmark
    • Finland
    • Netherlands
    • Rest of Europe
  • Asia-Pacific 
    • China
    • India
    • Japan
    • South Korea
    • Taiwan
    • Indonesia
    • Vietnam
    • Australia
    • Philippines
    • Malaysia
    • Rest of APAC
  • Middle East & Africa 
    • Saudi Arabia
    • UAE
    • Egypt
    • Israel
    • Turkey
    • Nigeria
    • South Africa
    • Rest of MEA
  • Latin America 
    • Brazil
    • Argentina
    • Chile
    • Colombia
    • Rest of LATAM

Conclusion & Recommendations

The long-term outlook remains strongly positive, with the market projected to expand from USD 401.2 billion in 2026 to USD 943.7 billion by 2035 at a 9.97% CAGR. Our assessment indicates that this growth will be increasingly shaped by government-backed supply chain diversification as importing nations reduce dependence on concentrated Chinese processing capacity through 2035.

What Strategic Positioning Should Producers Pursue?

Producers should pursue government-partnership positioning that combines processing capacity investment with long-term offtake agreements. We found that companies securing price floor guarantees, following MP Materials' model with the U.S. Department of Defense, are best positioned to fund capital-intensive Western processing capacity despite structurally higher costs than Chinese competitors.

How Attractive Is the Market for New Investment?

The market presents high investment attractiveness given its 9.97% forecast CAGR and the scale of government commitment to supply chain diversification. Our findings suggest that investors focusing on non-Chinese processing capacity, recycling and recovery infrastructure, and defense-linked supply agreements stand to benefit from above-market growth relative to the broader critical minerals and rare earths category.

What Are the Key Market Shifts and Risks?

Key shifts include accelerating government-backed processing capacity investment and expanding bilateral mineral supply partnerships. We observed that principal risks include continued Chinese export licensing policy volatility, high capital costs and long lead times for new processing capacity, and environmental permitting delays, all of which could shape the pace of the industry's supply chain diversification if unresolved.

What Are the Primary Growth Pathways Through 2035?

Primary growth pathways include scaling government-backed Western processing capacity, expanding recycling and recovery infrastructure, and deepening bilateral mineral supply partnerships. Based on research conducted by Next Move Strategy Consulting, we found that producers combining these three pathways with defense-linked offtake agreements are best positioned to capture the USD 542.5 billion absolute dollar opportunity created between 2026 and 2035.

FAQs

About the Author

Liza Phukan

Liza Phukan

Liza Phukan is Research Associate at Next Move Strategy Consulting, where she has covered emerging industries and market research across sectors for 3.5 years. Her work includes analyzing industry developments, validating market data, and developing structured business content from research findings. She uses secondary research and data-validation practices to turn complex market information into clear decision-useful market analysis for business audiences and support report development and B2B.

About the Reviewer

Supradip Baul

Supradip Baul

Supradip Baul is an accomplished business consultant and strategist with over a decade of rich experience in market intelligence, strategy, technology, and business transformation. His work has included rigorous qualitative and quantitative analysis across multiple industries, helping clients shape investment decisions and long-term roadmaps. Earlier in his career, he was associated with Gartner, where he contributed to industry-leading reports and market share analyses. He has worked with leading global companies and holds an MBA with a dual specialization in Marketing and Finance.

Download Free Sample

Diana Trejo

DIANA TREJO

Assistant Manager

Sumitomo Corporation de Mexico, S.A. de C.V.

Recently, we purchased a report on the Mexico Data Center Market from Next Move Strategy Consulting. The service has been excellent, with support that is always timely and thoroughly professional. The information provided is interesting, highly useful, and delivered with clarity. I would highly recommend NextMSC for anyone seeking insightful and dependable analysis.

Ross J Mckenzie

ROSS J MCKENZIE

Business Insight Manager

Staysure Group

“Next MSC have been incredibly helpful in providing detailed & robust information on our market, alongside quantifying growth by different segments. The process to procure was simple and easy, with sample reports and regular contact to ensure we had what we needed. Succinct detail on their sources & methodologies is also greatly received, allowing transparency in this respect helps build trust in the detail you pay for. Joseph in particular was fantastic, and helped ensure efficient provision of the insight pack – thank you NMSC!”.

Kishu Kanda

KISHU KANDA

Strategy Analyst

Accenture

We purchased the AI Consumer Market Report from this company. Not only did they customize the report to meet our specific requirements, but they also showed great flexibility in accommodating our budget. The report we received fully met our expectations. Additionally, they provided prompt and thorough responses to both our pre-purchase and follow-up questions. We look forward to working with this company again in the future.

Amos Chang

AMOS CHANG

Strategy Consultant

Kardex Group

I have bought the intralogistics market reports from NMSC two times so far. Joseph and his team are always very helpful and flexible in responding to any customization requirements on the report. Their expertise in market reports really helps us steer the day-to-day business. I will definitely recommend and come back myself whenever there is a need.

Gustaf Hummel Burstrom

GUSTAF HUMMEL BURSTROM

Founder

Revline Tools AB

Joseph and the team at Next Move Strategy Consulting have been excellent to work with, in supplying us with relevant market data and forecasts for our specific category. We had some special requirements and they were able to do a custom package to suit our needs. We would definitely recommend them to any other company needing market data and forecasts

Custom Market Research Services

We will customize the research for you if the listed report does not fully match your requirements.

Get 30% Free Customization

Select License

This website uses cookies to ensure you get the best experience on our website. Learn more

✖