Data Center As a Service Market Global Industry Analysis and Forecast (2026–2035)

The Data Center As a Service Market size was USD 221.51 Billion in 2025 and is projected to reach USD 1,442.62 Billion by 2035, advancing at a 17.28% CAGR between 2026 and 2035. Consumption based pricing, AI workload demand and data sovereignty rules lift spending, with North America holding the lead.

Download Free Sample PDF
Base Year (2025)
$343.62 Billion
Forecast (2035)
$1,442.62 Billion
CAGR (2026-2035)
17.3%
Top Region
North America

What Is the Data Center As a Service Market Size?

The Data Center As a Service Market was valued at USD 221.51 Billion in 2025 and is estimated at USD 343.62 Billion in 2026, forecast to reach USD 1,442.62 Billion by 2035 at a CAGR of 17.28% from 2026 to 2035. North America led with approximately 38% share in 2025, while Compute as a service held approximately 37%.

We observed that enterprises are shifting from owning data center capacity toward buying compute, storage, networking and floor space as a metered service. This change moves infrastructure spending from capital budgets to operating budgets, shortens procurement cycles, and lets buyers scale AI and analytics workloads without carrying idle hardware. Vendors, in turn, earn recurring revenue tied to actual consumption rather than one time equipment sales.

Our analysis shows the following headline takeaways across segments, regions and countries for the forecast period.

Data Center As a Service Market Global Industry Analysis and Forecast (2026–2035) Revenue Forecast
Values in USD Billion

2025 $221.51 Billion
2025
2026 $343.62 Billion
2026
2027 $403.00 Billion
2027
2028 $472.64 Billion
2028
2029 $554.31 Billion
2029
2030 $650.09 Billion
2030
2031 $762.43 Billion
2031
2032 $894.17 Billion
2032
2033 $1,048.69 Billion
2033
2034 $1,229.90 Billion
2034
2035 $1,442.62 Billion
2035

Key Takeaways

By Service Type: Compute as a service held the largest share, expanding from USD 81.96 Billion in 2025 to USD 519.34 Billion by 2035; Networking as a service is the fastest growing at 20.10% CAGR from 2026–2035.

By Deployment Model: On premises consumption held the largest share, expanding from USD 90.82 Billion in 2025 to USD 533.77 Billion by 2035; Provider hosted private cloud is the fastest growing at 18.53% CAGR from 2026–2035.

By End User Industry: IT and telecom held the largest share, expanding from USD 66.45 Billion in 2025 to USD 375.08 Billion by 2035; Healthcare and life sciences is the fastest growing at 19.58% CAGR from 2026–2035.

Dominant Region: North America dominated with approximately 38% revenue share in 2025, valued at USD 84.17 Billion, anchored by early adoption of consumption based infrastructure among large enterprises and hyperscale platform vendors.

Fastest-Growing Region: Asia-Pacific is expected to register the highest CAGR of 20.43% during 2026–2035, expanding from USD 55.38 Billion in 2025 to USD 483.28 Billion by 2035 on rapid digital infrastructure investment.

Dominant Country: The U.S. led the market with an estimated USD 70.70 Billion in 2025, supported by the deepest base of enterprise buyers and platform vendors.

Fastest-Growing Country: India is projected to expand from USD 4.71 Billion in 2025 to USD 72.49 Billion by 2035 at a CAGR of 26.69%, driven by rapid capacity additions and enterprise cloud adoption.

The Data Center As a Service Market presents an absolute investment opportunity of approximately USD 1,099.00 Billion between 2026 and 2035, calculated as the difference between the 2035 forecast of USD 1,442.62 Billion and the 2026 base of USD 343.62 Billion. That scale makes consumption priced compute, networking and facility services the most capital efficient categories for infrastructure investors.

According to NMSC analysis, the shift toward sovereign and air gapped private infrastructure is the most structurally significant change in demand, because regulated buyers need cloud style operations inside jurisdictions and facilities they control. Only a service based delivery model can supply that capability at scale, which explains why governments and banks now write sovereignty terms into infrastructure contracts.

What Does the Data Center As a Service Market Encompass?
The Data Center As a Service Market covers infrastructure delivered on a subscription or metered basis, in which a provider owns, installs, operates or hosts compute, storage, networking and facility capacity and the customer pays for what it uses. Offerings run inside customer premises, inside carrier neutral colocation sites, or inside provider operated private clouds. Public cloud workloads, plain hardware sales, and pure software licences sit outside the scope of this report.
The regulatory environment is shaped by data sovereignty rules, operational resilience mandates for financial entities, and energy efficiency reporting for data centers. Technology adoption centres on hyperconverged and disaggregated hardware, unified management planes, agentic automation, and liquid cooling for dense AI racks. We found that buyers now judge providers on service level outcomes, such as availability and recovery targets, rather than on hardware specifications.

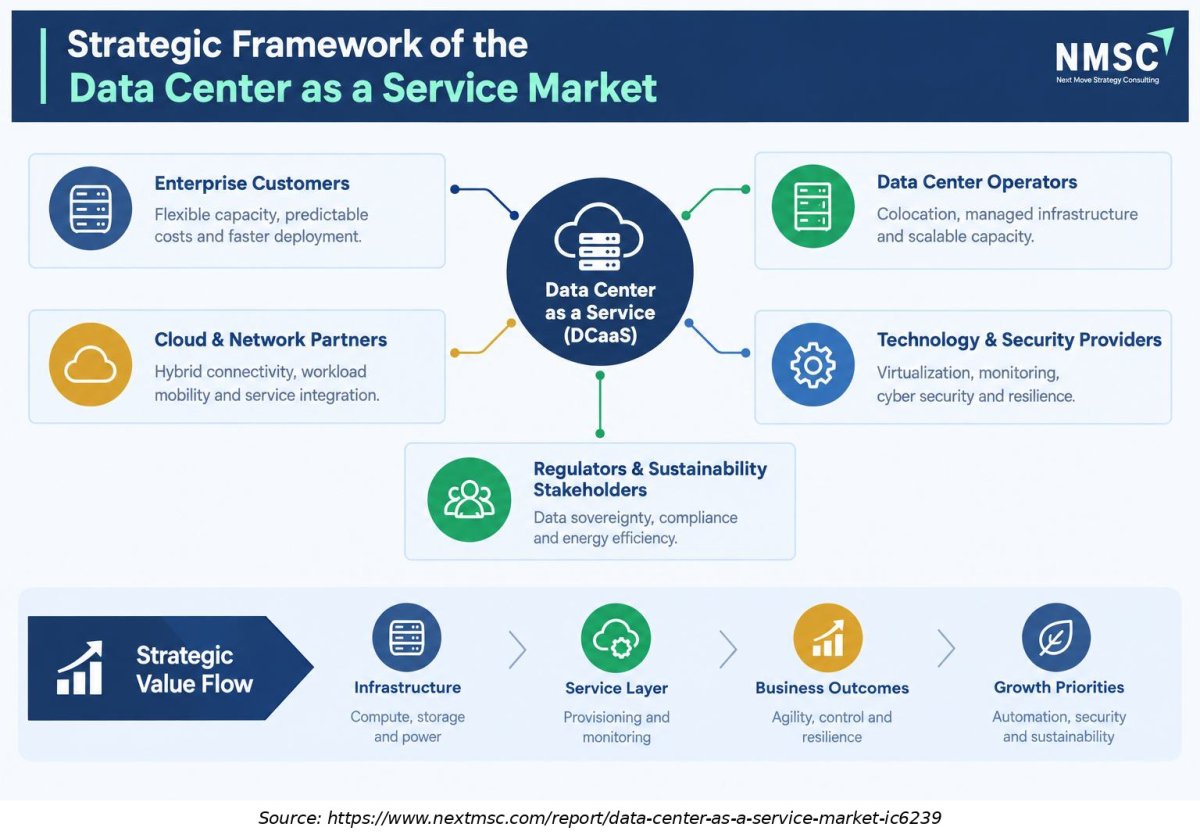
Strategic Framework of the Data Center as a Service Market

Strategic Framework of the Data Center as a Service Market
The strategic framework of the Data Center as a Service (DCaaS) market highlights the interconnected roles of enterprise customers, data center operators, cloud and network partners, and technology providers. Market development depends on scalable infrastructure, flexible service delivery, security, and operational efficiency. These factors influence service adoption, cost optimization, business continuity, and long-term market growth.

Market Drivers & Dynamics

Interactive Dataset
Shift of infrastructure budgets from capital to operating expenditure driver +3.40% Global 2026–2035
AI and analytics workloads needing flexible accelerator capacity driver +3.10% North America, Asia-Pacific 2026–2033
Data sovereignty and operational resilience regulation driver +2.40% Europe, Middle East & Africa 2026–2031
Hyperscale and colocation capacity build out driver +1.90% Asia-Pacific, North America 2026–2032
Grid interconnection delays and power availability restraint −2.30% North America, Europe 2026–2031
Customer rights to reduce usage or end contracts early restraint −1.60% Global 2026–2030
Integration complexity across mixed vendor estates restraint −1.20% Global 2026–2029
Source: Next Move Strategy Consulting

Growth Drivers

What Is the Primary Growth Driver in the Data Center As a Service Market?

The primary driver is the move from owning infrastructure to paying for it as consumed. Dell states that its utility, subscription and as a service payment options typically involve multiyear agreements that generate recurring revenue, and HPE reported annualized revenue run rate of USD 3.20 Billion in the fourth quarter of fiscal 2025, up 63% year over year. We found that finance teams favour this model because it aligns cost with usage and removes refresh cycle risk.

How Is AI Workload Demand Driving the Data Center As a Service Market Growth?
The International Energy Agency estimates that global data centre electricity use reached about 415 TWh in 2024, and its base case reaches about 945 TWh by 2030, a growth rate near 15% a year. Our findings suggest that this surge pushes enterprises toward flexible capacity, because few can forecast accelerator needs over a five year hardware cycle, and service based contracts let them add or release capacity as projects change.

Growth Inhibitors

What Is Restraining the Data Center As a Service Market?

Power availability is the primary restraint. The IEA reports that about 20% of planned data centre projects face delay risk unless grid constraints ease, new transmission lines take four to eight years in advanced economies, and waiting times for transformers and cables have doubled in three years. Dell also notes that customers can reduce usage or end contracts early on payment of agreed fees, which makes recurring revenue less predictable than headline commitments suggest.

What Are the Growth Opportunities?

Can Sovereign Private Cloud Programs Open a Premium Tier for Government and Defense Buyers?

Government and defense accounts want certified, air gapped infrastructure that a vendor operates under contract. Microsoft reports that Azure Local now scales to thousands of nodes in its Sovereign Private Cloud, and HPE has readied the PC7000 for Department of Defense Impact Level 4 certification. Providers that secure accreditation can price at a premium, and the segment is expected to reach USD 187.54 Billion by 2035.

Does Healthcare and Life Sciences Offer the Strongest Consumption Based Demand Pocket?

Healthcare and life sciences is the fastest growing end user group at 19.58% CAGR, rising from USD 22.15 Billion in 2025 to USD 180.33 Billion by 2035. Imaging, genomics and clinical AI generate bursty compute and storage needs that fit metered contracts, and compliance obligations favour providers able to host capacity near regulated patient records.

Can Networking as a Service Become the Next Scalable Revenue Layer?

Networking as a service is the fastest growing service type at 20.10% CAGR, climbing from USD 22.15 Billion in 2025 to USD 187.54 Billion by 2035. Equinix sells interconnection and its Fabric Geo Zones tool keeps traffic within chosen jurisdictions, which shows how routing control can be packaged and billed as a service.

Segmentation Analysis

2025 (USD Billion)
2035 (USD Billion)
Compute as a service 2025: $81.96 Billion | 2035: $519.34 Billion
Compute as a
Storage as a service 2025: $46.52 Billion | 2035: $259.67 Billion
Storage as a
Networking as a service 2025: $22.15 Billion | 2035: $187.54 Billion
Networking a
Colocation and facility services 2025: $70.88 Billion | 2035: $476.07 Billion
Colocation a
Compute as a service $81.96 Billion $519.34 Billion 16.93%
Storage as a service $46.52 Billion $259.67 Billion 15.29%
Networking as a service $22.15 Billion $187.54 Billion 20.10%
Colocation and facility services $70.88 Billion $476.07 Billion 17.89%

Which Service Type Leads the Data Center As a Service Market?

Compute as a service remains the largest service type, reflecting the breadth of hosted and on premises compute platforms such as AWS Outposts, Azure Local, HPE GreenLake and Dell APEX. Networking as a service is the fastest growing at 20.10% CAGR from 2026–2035, because software defined fabrics and interconnection services are now bought on a metered basis. We observed that storage as a service grows more slowly as buyers consolidate on unified platforms.

2025 (USD Billion)
2035 (USD Billion)
On premises
Colocation h
Provider hos
Segment Item 2025 (USD Billion) 2035 (USD Billion) CAGR
On premises consumption $10.0 USD Billion $40.0 USD Billion 25.0%
Colocation hosted $17.1 USD Billion $51.1 USD Billion 11.0%
Provider hosted private cloud $24.2 USD Billion $62.2 USD Billion 25.0%

Segment-wise data is locked

Unlock complete segment-wise numbers for By Deployment Model.

Unlock Full Data
2025 (USD Billion)
2035 (USD Billion)
IT and telec
BFSI
Healthcare a
Government a
Retail and e
Segment Item 2025 (USD Billion) 2035 (USD Billion) CAGR
IT and telecom $10.0 USD Billion $40.0 USD Billion 27.0%
BFSI $17.1 USD Billion $51.1 USD Billion 9.0%
Healthcare and life sciences $24.2 USD Billion $62.2 USD Billion 19.0%
Government and defense $31.3 USD Billion $73.3 USD Billion 17.0%
Retail and ecommerce $38.4 USD Billion $84.4 USD Billion 18.0%

Segment-wise data is locked

Unlock complete segment-wise numbers for By End User Industry.

Unlock Full Data

Growth Opportunities

We found that three opportunity pools offer the clearest route to above market revenue growth through 2035.

Can Sovereign Private Cloud Programs Open a Premium Tier for Government and Defense Buyers?

Government and defense accounts want certified, air gapped infrastructure that a vendor operates under contract. Microsoft reports that Azure Local now scales to thousands of nodes in its Sovereign Private Cloud, and HPE has readied the PC7000 for Department of Defense Impact Level 4 certification. Providers that secure accreditation can price at a premium, and the segment is expected to reach USD 187.54 Billion by 2035.

Does Healthcare and Life Sciences Offer the Strongest Consumption Based Demand Pocket?

Healthcare and life sciences is the fastest growing end user group at 19.58% CAGR, rising from USD 22.15 Billion in 2025 to USD 180.33 Billion by 2035. Imaging, genomics and clinical AI generate bursty compute and storage needs that fit metered contracts, and compliance obligations favour providers able to host capacity near regulated patient records.

Can Networking as a Service Become the Next Scalable Revenue Layer?

Networking as a service is the fastest growing service type at 20.10% CAGR, climbing from USD 22.15 Billion in 2025 to USD 187.54 Billion by 2035. Equinix sells interconnection and its Fabric Geo Zones tool keeps traffic within chosen jurisdictions, which shows how routing control can be packaged and billed as a service.

Regional Outlook

2025 (USD Billion)
2035 (USD Billion)
North Americ
Europe
Asia-Pacific
Middle East
Latin Americ
Region 2025 (USD Billion) 2035 (USD Billion) CAGR (%)
North America $10.0 USD Billion $40.0 USD Billion 9.0%
Europe $17.1 USD Billion $51.1 USD Billion 27.0%
Asia-Pacific $24.2 USD Billion $62.2 USD Billion 25.0%
Middle East & Africa $31.3 USD Billion $73.3 USD Billion 23.0%
Latin America $38.4 USD Billion $84.4 USD Billion 12.0%

Regional data is locked

Unlock complete regional numbers for this market.

Unlock Full Data

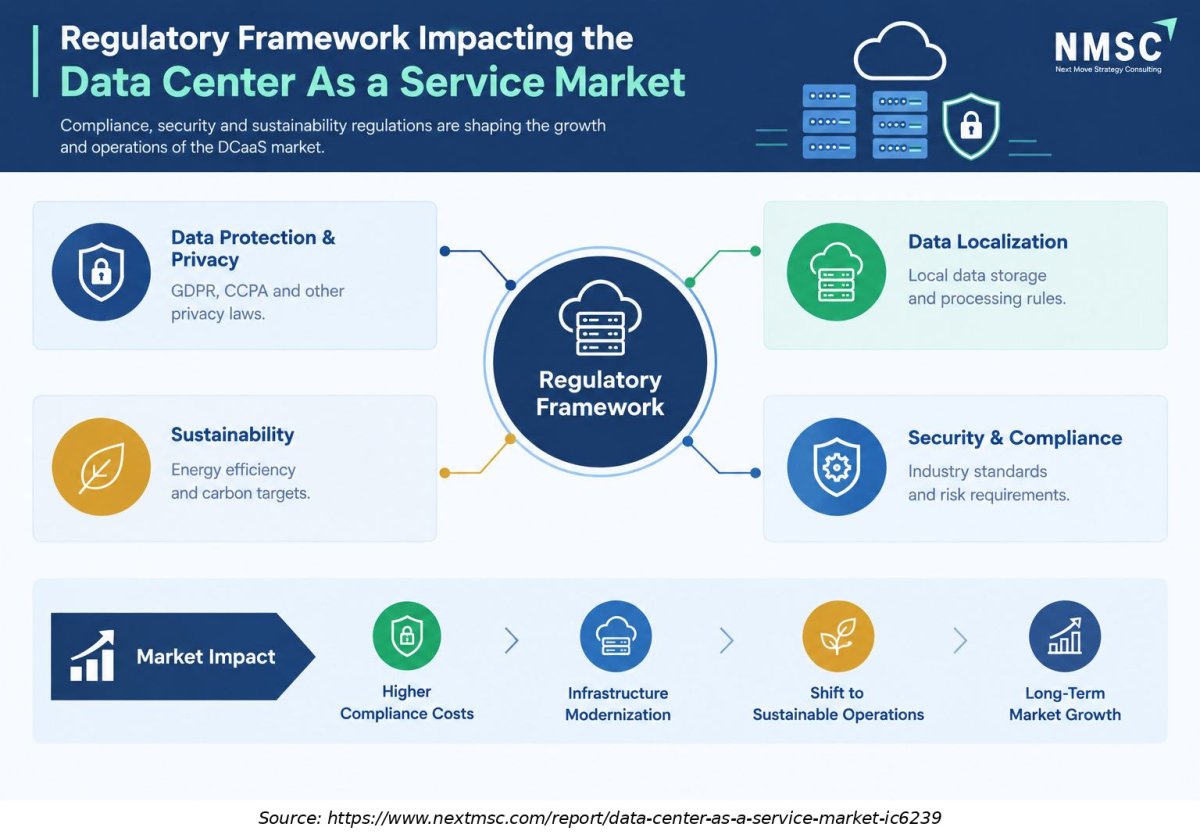
Regulatory Framework Impacting the Data Center as a Service Market

The regulatory framework of the Data Center as a Service (DCaaS) market encompasses data protection, privacy legislation, data localization, cybersecurity standards, and sustainability requirements. Compliance with regulations such as GDPR and CCPA influences infrastructure design, data management, and operating costs. These requirements encourage providers to strengthen security controls, modernize infrastructure, and adopt energy-efficient practices while supporting sustainable market development.

Competitive Landscape

Based on research conducted by NMSC, the competitive field mixes infrastructure vendors, hyperscale platforms, colocation operators and managed service providers.

Dimension Description
Market Structure Fragmented across infrastructure vendors, hyperscale platforms, colocation operators and managed service providers, with no single provider dominant
Innovation Focus Sovereign and air gapped private clouds, agentic operations, AI ready capacity and outcome based service levels
M&A Activity Selective capability deals, such as Everpure acquiring 1touch in 2026, alongside large organic capacity programs rather than broad consolidation

How Do Companies Compete in the Data Center As a Service Market?

Competition runs along three lines in the Data Center As a Service Market: pricing structure, geographic reach of operated capacity, and depth of service commitments. Vendors such as Dell, HPE and Lenovo sell metered versions of their own hardware, hyperscale platforms extend their control planes into customer sites, and operators such as Equinix and Digital Realty compete on facility footprint. We found that buyers weigh recovery commitments and operating cost transparency as heavily as headline unit price.

Which Competitive Archetypes Dominate the Data Center As a Service Market?

Four archetypes stand out. Infrastructure vendors turn product lines into subscriptions, hyperscale platforms project cloud services into customer sites, colocation operators sell neutral facilities and interconnection, and managed service providers run private clouds for clients. The differentiation themes are sovereignty, service level outcomes, power density and ecosystem breadth. Our analysis shows that the strongest positions combine two archetypes, for example hardware plus managed operations.

What Innovation and Differentiation Strategies Are Companies Pursuing?

Providers differentiate through automation, certification and packaging. Oracle introduced Dedicated Region25 in October 2025 to run a full cloud region in as few as three racks, Amazon released second generation single rack Outposts in September 2026, and Hitachi Vantara tied EverFlex fees to measured outcomes in May 2026. Geographic expansion follows regulated demand, and pricing strategies increasingly blend committed capacity with metered overage.

What M&A and Partnership Activity Is Shaping the Data Center As a Service Market?

Partnerships matter more than large acquisitions. NetApp and Google Cloud agreed in April 2026 to bring NetApp storage into Google Distributed Cloud air gapped environments, and Everpure completed the purchase of 1touch after its February 2026 rename. NTT DATA added about 115 MW of new commitments in early 2026 under a plan exceeding USD 10 Billion through 2027. Our assessment indicates that capacity partnerships will continue to outnumber outright consolidation.

Key Market Players

Based on research conducted by NMSC, the following 19 companies form the validated leadership set Data Center As a Service Market.

Hewlett Packard Enterprise Company Dell Technologies Inc. Amazon.com, Inc. Microsoft Corporation Alphabet Inc. Oracle Corporation International Business Machines Corporation Lenovo Group Limited Cisco Systems, Inc. NetApp, Inc. Everpure, Inc. (formerly Pure Storage, Inc.) Hitachi, Ltd. Equinix, Inc. Digital Realty Trust, Inc. Kyndryl Holdings, Inc. Nippon Telegraph and Telephone Corporation DXC Technology Company Rackspace Technology, Inc. Iron Mountain Incorporated

Latest Developments

We observed that vendor announcements between late 2025 and September 2026 concentrate on sovereign cloud, agentic operations and private AI infrastructure.

Date Event
Sep 2026 Amazon Web Services (AWS) made its second-generation single-rack AWS Outposts generally available, delivering up to 2,688 vCPUs and 100 TB of Amazon EBS storage per rack for low-latency, on-premises workloads.
Aug 2026 Rackspace Technology launched Rackspace Cloud, a fully managed, multitenant cloud platform built on VMware Cloud Foundation 9.1, featuring elastic, consumption-based capacity for enterprise applications and AI workloads.
Jul 2026 DXC Technology launched DXC Private Cloud+, a hybrid private cloud offering consumption-based pricing through its Core edition and dedicated single-tenant infrastructure for enterprises requiring greater isolation, security, and data sovereignty.
Jun 2026 Hewlett Packard Enterprise expanded GreenLake with agentic AI-powered IT operations and enhanced HPE Morpheus Software, while announcing air-gapped deployment capabilities for its PC3000 and PC7000 private cloud systems.
May 2026 Hitachi Vantara enhanced EverFlex with outcome-based service-level agreements covering availability, performance, optimization, and recovery, alongside flexible consumption and purchasing models for enterprise infrastructure.

Investment Opportunities

Where Are Capital Inflows Concentrating in the Data Center As a Service?

Capital is flowing to facilities and power. Digital Realty reported about 2.9 GW of in place IT capacity and about 770 MW under construction at the end of 2025. NTT DATA plans more than USD 10 Billion of spending through 2027, and India reports about USD 70 Billion of data center investment underway with a further USD 90 Billion announced. We found that investors favour platforms with secured power and long contracts.

How Is Infrastructure Investment Shaping Market Capacity?

Power and permitting determine how quickly capacity arrives. The International Energy Agency finds that about 50% of US data centers under development sit in existing large clusters, and a July 2025 US executive order accelerates permitting for projects above USD 0.5 Billion in capital spending. During our market evaluation, we noticed that providers with grid access and standardized designs can win contracts that rivals cannot yet serve.

What ESG Considerations Are Influencing Market Investment?

Energy and water use are now investment screens. The European Commission proposed a data center rating scheme in September 2026 covering energy use, water use, waste heat reuse and grid flexibility for sites above 500 kW, and first labels are expected in 2027. Our analysis shows that service providers able to report verified efficiency data will find it easier to win public sector and financial services contracts.

Key Benefits for Stakeholders

How Does This Report Benefit Enterprise IT Leaders and Procurement Teams?

Enterprise buyers gain a segment level view of service types, deployment models and industries, with 2025 and 2035 values and growth rates for each. The analysis helps them compare on premises, colocation and provider hosted options, benchmark vendor strategies, and judge when metered contracts beat ownership. Regional and country sections support sourcing decisions under local sovereignty and resilience rules.

How Does This Report Benefit Investors and Financial Analysts?

Investors receive a reconciled forecast that rises from USD 221.51 Billion in 2025 to USD 1,442.62 Billion in 2035, together with the opportunity measured between 2026 and 2035. The report identifies the fastest growing service types, deployment models, industries and regions, maps the competitive field, and outlines power, contract and integration risks. These insights support capital allocation across facilities, equipment and services.

How Does This Report Benefit Technology Vendors and Service Providers?

Vendors and providers obtain a view of where demand is rising, which archetypes are winning, and how rivals price and package their offers. The report highlights sovereign, healthcare and networking opportunities, tracks recent product launches, and clarifies regulatory drivers in Europe and Asia-Pacific. Product teams can use these findings to prioritize certification, automation and partnership investments.

Key Market Segments Evaluated

By Service Type

  • Compute as a service
  • Storage as a service
  • Networking as a service
  • Colocation and facility services

By Deployment Model

  • On premises consumption
  • Colocation hosted
  • Provider hosted private cloud

By End User Industry

  • IT and telecom
  • BFSI
  • Healthcare and life sciences
  • Government and defense
  • Retail and ecommerce
  • Manufacturing

By Region

  • North America 
    • U.S.
    • Canada
    • Mexico
  • Europe 
    • UK
    • Germany
    • France
    • Italy
    • Spain
    • Sweden
    • Denmark
    • Finland
    • Netherlands
    • Rest of Europe
  • Asia-Pacific 
    • China
    • India
    • Japan
    • South Korea
    • Taiwan
    • Indonesia
    • Vietnam
    • Australia
    • Philippines
    • Malaysia
    • Rest of APAC
  • Middle East & Africa 
    • Saudi Arabia
    • UAE
    • Egypt
    • Israel
    • Turkey
    • Nigeria
    • South Africa
    • Rest of MEA
  • Latin America 
    • Brazil
    • Argentina
    • Chile
    • Colombia
    • Rest of LATAM

Conclusion & Recommendations

The outlook is strongly positive, with revenue rising from USD 343.62 Billion in 2026 to USD 1,442.62 Billion by 2035 at a CAGR of 17.28%. Sovereign requirements, AI workloads and the shift to operating expenditure support demand across every segment and region. Asia-Pacific and Middle East & Africa grow fastest, while North America keeps the largest base through the forecast period.

What Strategic Positioning Recommendations Does NMSC Offer?

We recommend that providers build positions in certified sovereign and air gapped offers, invest in automation that cuts operating cost per contract, and tie pricing to measurable service outcomes. Vendors should partner for facility capacity instead of building every site, and prioritize healthcare, government and financial accounts where compliance creates durable switching costs.

How Strong Is the Investment Attractiveness of the Market?

Our assessment indicates that attractiveness is high for platforms with secured power, long dated contracts and diversified customers. Recurring revenue improves visibility, while contract flexibility and construction risk call for disciplined underwriting. Investors should favour operators with proven delivery track records and exposure to the faster growing regions and service types identified in this report.

What Market Shifts and Key Risks Could Alter the Outlook?

The key shifts are rising sovereignty requirements, denser AI racks and growing outcome based contracts. The main risks are grid delays, customer rights to cut usage, integration complexity and security incidents at shared facilities. A slower pace of AI adoption would reduce growth, so we advise scenario testing of utilization and power cost assumptions.

What Are the Primary Growth Pathways Through 2035?

Growth pathways include networking services growing at 20.10%, provider hosted private cloud at 18.53%, and healthcare at 19.58%. Geographic expansion into India and the Gulf adds further momentum, because both areas combine fast capacity growth with strong sovereignty demand. Vendors that combine these pathways with disciplined operations and secured power should outgrow the market as a whole.

FAQs

Sources & References

1.

Hewlett Packard Enterprise, fiscal 2025 results release

sec.gov
2.

Hewlett Packard Enterprise, GreenLake and Morpheus agentic operations release

hpe.com
3.

Dell Technologies, fiscal 2026 annual report (Form 10-K)

sec.gov
4.

Dell Technologies, fiscal 2026 results release

sec.gov
5.

Amazon, second generation single rack AWS Outposts announcement

aws.amazon.com
6.

Microsoft, Azure Local product page

azure.microsoft.com
7.

Microsoft, Sovereign Private Cloud scales with Azure Local

blogs.microsoft.com
8.

Microsoft, Azure Local disconnected operations

blogs.microsoft.com
9.

Alphabet, Google Distributed Cloud

cloud.google.com/distributed-cloud
10.

Oracle, OCI Dedicated Region25 announcement

oracle.com
11.

IBM, Power Virtual Server

ibm.com
12.

Lenovo, first quarter fiscal 2025/26 results

investor.lenovo.com
13.

Cisco, Compute Hardware as a Service offer description

cisco.com
14.

NetApp, Keystone storage as a service

netapp.com/services/keystone
15.

NetApp, Google Cloud air gapped agreement

netapp.com
16.

NetApp, second quarter fiscal 2026 results and Keystone for Enterprise AI

businesswire.com
17.

Everpure, company rename and 1touch acquisition

everpuredata.com
18.

Everpure, Evergreen//One

everpuredata.com
19.

Hitachi Vantara, EverFlex outcome based service levels

hitachivantara.com/en-us/news/gl260527
20.

Hitachi Vantara, EverFlex infrastructure as a service

hitachivantara.com
21.

Equinix, Form 10-K for fiscal 2025

sec.gov
22.

Equinix, Fabric Geo Zones release

newsroom.equinix.com
23.

Digital Realty, Form 10-K for fiscal 2025

sec.gov
24.

Kyndryl, fiscal 2026 annual report (Form 10-K)

sec.gov
25.

Kyndryl, fiscal 2026 results release

sec.gov
26.

NTT DATA, data center momentum announcement

services.global.ntt
27.

DXC Technology, DXC Private Cloud+ introduction

dxc.com
28.

Rackspace Technology, Rackspace Cloud launch

ir.rackspace.com
29.

Iron Mountain, data centers overview

ironmountain.com/data-centers/about
30.

Iron Mountain, fourth quarter and full year 2025 results

investors.ironmountain.com
31.

International Energy Agency, Energy and AI, energy demand from AI

iea.org
32.

International Energy Agency, Energy and AI, executive summary

iea.org
33.

Lawrence Berkeley National Laboratory, 2024 United States Data Center Energy Usage Report

escholarship.org
34.

U.S. Department of Energy, data center electricity demand report announcement

energy.gov
35.

The White House, Executive Order 14318 on permitting of data center infrastructure

whitehouse.gov
36.

European Commission, data center rating scheme proposal (IP/26/1667)

ec.europa.eu
37.

European Commission, Data Act explained

digital-strategy.ec.europa.eu
38.

European Securities and Markets Authority, Digital Operational Resilience Act

esma.europa.eu
39.

European Supervisory Authorities, list of designated critical ICT third party providers

esma.europa.eu
40.

Eurostat, cloud computing statistics on use by enterprises

ec.europa.eu
41.

Press Information Bureau, Government of India, Data Centres in India

pib.gov.in

About the Author

Mihul Sharma

Mihul Sharma

Mihul Sharma is Research Associate at Next Move Strategy Consulting, where he has covered technology, industrial, and healthcare markets for 3 years. His work applies structured business research, market analysis, and secondary-source review to assess market trends, competitive developments, and growth opportunities. He supports report development by fully synthesizing industry data, company information, and market signals into concise findings for strategy and investment-focused research teams.

About the Reviewer

Supradip Baul

Supradip Baul

Supradip Baul is an accomplished business consultant and strategist with over a decade of rich experience in market intelligence, strategy, technology, and business transformation. His work has included rigorous qualitative and quantitative analysis across multiple industries, helping clients shape investment decisions and long-term roadmaps. Earlier in his career, he was associated with Gartner, where he contributed to industry-leading reports and market share analyses. He has worked with leading global companies and holds an MBA with a dual specialization in Marketing and Finance.

Download Free Sample

Diana Trejo

DIANA TREJO

Assistant Manager

Sumitomo Corporation de Mexico, S.A. de C.V.

Recently, we purchased a report on the Mexico Data Center Market from Next Move Strategy Consulting. The service has been excellent, with support that is always timely and thoroughly professional. The information provided is interesting, highly useful, and delivered with clarity. I would highly recommend NextMSC for anyone seeking insightful and dependable analysis.

Nishant Awate

NISHANT AWATE

Business Development Global Sales

Zehnder Group Deutschland GmbH

Our experience working with Next Move Strategy Consulting was positive. The team was responsive, professional, and open to incorporating our specific requirements throughout the project. The India AHU market study was comprehensive and well structured, covering market value and volume forecasts, product and application segments, and key industry trends. The inclusion of both AHU and residential MVHR market insights made the study particularly relevant for our strategic market assessment. Overall, the report provides a solid foundation for evaluating market potential, identifying priority segments, and supporting business-development decisions in India.

Pratyush Kumar Das

PRATYUSH KUMAR DAS

Assistant Manager

Polycab India Limited

We would like to express our appreciation for the data and insights provided by nextmsc. We are very pleased with the quality and depth of the information, which has proven to be highly valuable and beneficial for our business decision-making.

Mohit Agarwal

MOHIT AGARWAL

Chief Manager

DryChem India Pvt. Ltd.

Next Move Strategy Consulting is an amazing team of consultants. We required a market study report for our investors on top priority and the team went above and beyond our expectations to deliver the same with ample supporting data within a short time span enabling us to secure the investments and keep our project timeline maintained. Their professionalism, attention to detail, and timely delivery of actionable recommendations have left a lasting impression on our organization.

Gaurav Jaiswal

GAURAV JAISWAL

Founder & CEO

Yano Charge Private Limited

The EV Charging market research report provided by the NextMSC was exceptionally detailed and insightful. It offered a comprehensive analysis that proved to be a game-changer for our strategic planning. Truly a testament to the NextMSC’s expertise and thoroughness in EV market landscape & analysis.

Custom Market Research Services

We will customize the research for you if the listed report does not fully match your requirements.

Get 30% Free Customization

Select License

This website uses cookies to ensure you get the best experience on our website. Learn more

✖