Containerized Data Center Market Global Industry Analysis and Forecast (2026–2035)

Containerized Data Center Market size is projected to rise from USD 6.60 Billion in 2025 to USD 24.30 Billion by 2035, a 13.5% CAGR from 2026 to 2035, as AI capacity needs, edge rollouts and grid delays push buyers toward factory-built units, with North America in front.

Download Free Sample PDF
Base Year (2025)
$6.60 Billion
Forecast (2035)
$24.30 Billion
CAGR (2026-2035)
13.5%
Top Region
North America

What Is the Containerized Data Center Market Size?
The global Containerized Data Center Market was valued at USD 6.60 Billion in 2025 and is estimated at USD 7.78 Billion in 2026, forecast to reach USD 24.30 Billion by 2035 at a CAGR of 13.5% from 2026 to 2035. North America leads with approximately 38% share, while the 40-foot segment holds approximately 48% of 2025 revenue.

Demand spans single-container edge deployments and larger multi-container facilities. However, the cited evidence does not establish a market-wide shift from isolated edge installations to multi-megawatt arrays. Operators accept this format because factory assembly shortens site work, and because transportable power and cooling blocks can be added in step with each GPU delivery. Power access, not floor space, now sets the pace of new capacity, and a unit that ships with its own electrical and thermal plant fits that constraint better than a purpose-built hall.

Our analysis shows that leading segments hold 35% to 48% of 2025 revenue, while the fastest growing groups compound at 15% or more.

Containerized Data Center Market Global Industry Analysis and Forecast (2026–2035) Revenue Forecast

Values in USD Billion

2025 $6.60 Billion
2025
2026 $7.78 Billion
2026
2027 $8.83 Billion
2027
2028 $10.02 Billion
2028
2029 $11.38 Billion
2029
2030 $12.91 Billion
2030
2031 $14.65 Billion
2031
2032 $16.63 Billion
2032
2033 $18.88 Billion
2033
2034 $21.43 Billion
2034
2035 $24.30 Billion
2035

Key Takeaways

By container size, the 40-foot segment held the largest share, increasing from USD 3.17 billion in 2025 to a projected USD 11.35 billion in 2035. Multi-container and custom configurations are forecast to be the fastest-growing segment, with a CAGR of 15.0% from 2026 to 2035.

By Module type: The IT module held the largest share, expanding from USD 2.31 Billion in 2025 to USD 8.20 Billion by 2035; the Cooling module is the fastest growing at 15.8% CAGR from 2026–2035.

By End user: Cloud and colocation providers held the largest share, expanding from USD 2.38 Billion in 2025 to USD 9.55 Billion by 2035; Industrial and energy is the fastest growing at 15.0% CAGR from 2026–2035.

Dominant Region: North America, rising from USD 2.52 Billion in 2025 to USD 8.55 Billion by 2035 at 12.6% CAGR from 2026–2035.

Fastest-Growing Region: Middle East & Africa, rising from USD 0.52 Billion in 2025 to USD 2.22 Billion by 2035 at 15.2% CAGR from 2026–2035.

Dominant Country: The U.S., rising from USD 2.18 Billion in 2025 to USD 7.45 Billion by 2035 at 12.7% CAGR from 2026–2035.

Fastest-Growing Country: India, rising from USD 0.20 Billion in 2025 to USD 1.05 Billion by 2035 at 17.3% CAGR from 2026–2035.

The Market offers an absolute investment opportunity of approximately USD 16.52 Billion between 2026 and 2035, which signals that capital placed in factory-built capacity and its component supply chain can more than triple over the decade.

According to NMSC analysis, the most underpriced element is the cooling module, because liquid cooling retrofits are shifting from an option to a purchase condition for any unit sold into AI workloads.

Supply Chain Impacting the Containerized Data Center Market

Supply Chain Impacting the Containerized Data Center Market
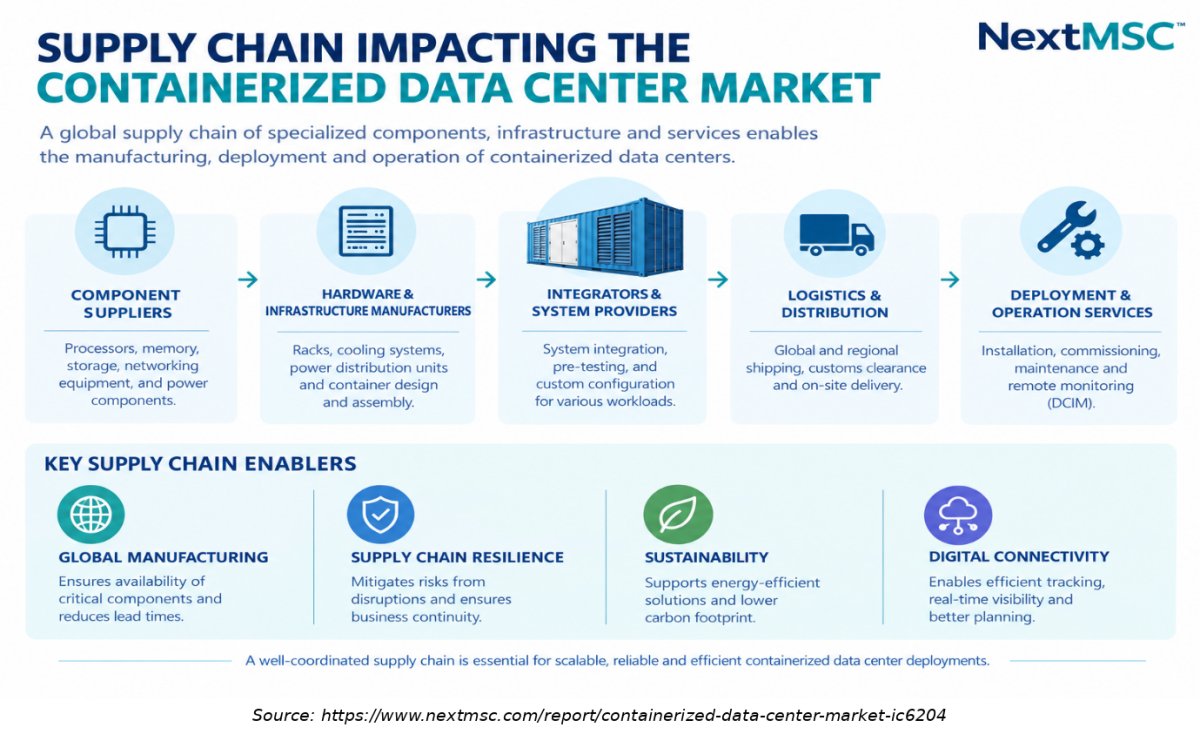
The infographic illustrates the key stages of the containerized data center supply chain, from component suppliers and hardware manufacturers to system integrators, logistics providers, and installation and maintenance services. It highlights coordinated sourcing, power and cooling integration, transportation, and commissioning. Resilient supplier networks and reliable digital connectivity help support efficient deployment and the growing demand for modular computing infrastructure.

What Does the Containerized Data Center Market Encompass?

The Containerized Data Center Market covers factory-built data center units housed in ISO shipping containers or container sized steel modules, delivered with racks, power distribution, cooling, fire protection and monitoring already installed. The scope includes IT containers, power containers, cooling containers, integrated units and multi container clusters. Standalone enclosures, rack level pods and permanent buildings fall outside this definition, as do cloud service revenues earned by operators who use these units.

Market Drivers & Dynamics

Interactive Dataset
AI and high-density compute needing fast capacity driver +2.6% Global 2026–2035
Grid connection and construction delays favoring factory build driver +1.9% North America, Europe 2026–2030
Telecom and edge site expansion driver +1.2% Asia-Pacific, Middle East & Africa 2026–2032
Factory integrated liquid cooling and 800 VDC power driver +1.4% Global 2026–2035
Power availability and transformer lead times restraint −1.8% Global 2026–2030
Capacity ceiling versus permanent halls at gigawatt scale restraint −1.1% North America, Asia-Pacific 2028–2035
Local certification and code differences restraint −0.7% Europe, Middle East & Africa 2026–2031
Source: Next Move Strategy Consulting

Growth Drivers

What Is the Primary Growth Driver in the Containerized Data Center Industry?

AI compute demand is the primary driver. Data center electricity use reached about 415 TWh in 2024, around 1.5% of world consumption, and is projected to rise to roughly 945 TWh by 2030. In the United States, data centers used 4.4% of electricity in 2023 and may reach between 6.7% and 12% by 2028. Buyers that must add capacity at this pace turn to datacenterinfrastructure that arrives tested, which favors containers.

How Is Faster Capacity Delivery Driving Market Growth?

Capital spending by five large technology companies exceeded USD 400 billion in 2025 and is set to rise a further 75% in 2026. Speed to power now decides contract awards, and vendors claim large time savings: Delta states that its containerized unit cuts deployment time by about 60% against traditional builds, and Schneider Electric reports an 80% cut in onsite installation hours for prefabricated pods. We found that these claims, once verified in tenders, pull projects into the container format.

Growth Inhibitors

What Is Restraining the Containerized Data Center Market?

Grid access is the primary restraint. Grid-equipment procurement is a significant constraint on data center deployment. In February 2025, the IEA reported that procurement times for essential components, including power transformers and cables, had nearly doubled since 2021; large power transformers could require up to four years to procure, while cables could take two to three years. Containerized data centers cannot begin operation until the required electrical infrastructure is available. Grid-interconnection delays and equipment procurement constraints can postpone commissioning even when the container is ready; however, the effect on this market's growth rate and the timing of individual orders should be identified as NMSC model assumptions unless supported by project-specific evidence.

What Are the Growth Opportunities?

Can Liquid Cooled Container Retrofits Unlock Brownfield AI Capacity?

Owners of existing sites can add a cooling or power container beside a hall instead of rebuilding it. The Cooling module segment, growing at 15.8% CAGR to USD 4.15 Billion by 2035, benefits most, because retrofit demand scales with the installed base of air-cooled halls. Vendors that sell cooling containers with controls and service contracts can capture recurring revenue.

Will Industrial and Energy Sites Become a Distinct Buyer Segment?

Mines, refineries, wind and solar farms and power utilities need local compute for analytics and automation where no building exists. Industrial and energy buyers grow at 15.0% CAGR to USD 2.75 Billion by 2035, and they value ruggedized, self-contained units with remote monitoring. Vendors with sealed enclosures and wide temperature ratings can price at a premium.

Can Middle East & Africa Leapfrog Through Containerized Capacity?

National AI programs in the UAE and Saudi Arabia are placing orders ahead of permanent construction, and African telecom operators use containers to reach cities without large halls. Middle East & Africa grows at 15.2% CAGR from USD 0.62 Billion in 2026 to USD 2.22 Billion in 2035, the highest rate among regions. Local assembly partnerships and heat tolerant designs create entry points.

Segmentation Analysis

2025 (USD Billion)
2035 (USD Billion)
Category A
Category B
Category C
Category D
Segment Item 2025 (USD Billion) 2035 (USD Billion) CAGR
Category A $10.0 USD Billion $40.0 USD Billion 14.0%
Category B $17.1 USD Billion $51.1 USD Billion 8.0%
Category C $24.2 USD Billion $62.2 USD Billion 10.0%
Category D $31.3 USD Billion $73.3 USD Billion 8.0%

Segment-wise data not detailed in this view

Unlock complete segment-wise numbers for By Module type.

Unlock Full Data

By Module type: The IT module held the largest share, expanding from USD 2.31 Billion in 2025 to USD 8.20 Billion by 2035; the Cooling module is the fastest growing at 15.8% CAGR from 2026–2035.

2025 (USD Billion)
2035 (USD Billion)
Category A
Category B
Category C
Category D
Segment Item 2025 (USD Billion) 2035 (USD Billion) CAGR
Category A $10.0 USD Billion $40.0 USD Billion 26.0%
Category B $17.1 USD Billion $51.1 USD Billion 16.0%
Category C $24.2 USD Billion $62.2 USD Billion 18.0%
Category D $31.3 USD Billion $73.3 USD Billion 8.0%

Segment-wise data is locked

Unlock complete segment-wise numbers for By End user.

Unlock Full Data

By End user: Cloud and colocation providers held the largest share, expanding from USD 2.38 Billion in 2025 to USD 9.55 Billion by 2035; Industrial and energy is the fastest growing at 15.0% CAGR from 2026–2035.

2025 (USD Billion)
2035 (USD Billion)
20-foot
40-foot
Multi-contai
Integrated a
IT module
Segment Item 2025 (USD Billion) 2035 (USD Billion) CAGR
20-foot $10.0 USD Billion $40.0 USD Billion 16.0%
40-foot $17.1 USD Billion $51.1 USD Billion 10.0%
Multi-container and custom configurations $24.2 USD Billion $62.2 USD Billion 16.0%
Integrated all-in-one $31.3 USD Billion $73.3 USD Billion 26.0%
IT module $38.4 USD Billion $84.4 USD Billion 25.0%

Segment-wise data is locked

Unlock complete segment-wise numbers for By Container size.

Unlock Full Data

Which Container Size Leads the Containerized Data Center Market?

The 40-foot unit leads with USD 3.17 Billion in 2025, or about 48% of revenue, because it fits a full row of racks with integrated power and cooling and ships on standard freight. Multi-container and custom configurations are the fastest growing at 15.0% CAGR, since AI campuses order linked blocks. The 20-foot unit grows at 12.0% and stays the preferred choice for edge, telecom and remote sites with limited road access.

2025 (USD Billion)
2035 (USD Billion)
Category A
Category B
Category C
Category D
Segment Item 2025 (USD Billion) 2035 (USD Billion) CAGR
Category A $10.0 USD Billion $40.0 USD Billion 10.0%
Category B $17.1 USD Billion $51.1 USD Billion 8.0%
Category C $24.2 USD Billion $62.2 USD Billion 18.0%
Category D $31.3 USD Billion $73.3 USD Billion 8.0%

Segment-wise data is locked

Unlock complete segment-wise numbers for By Region.

Unlock Full Data

Dominant Region: North America, rising from USD 2.52 Billion in 2025 to USD 8.55 Billion by 2035 at 12.6% CAGR from 2026–2035.

Fastest-Growing Region: Middle East & Africa, rising from USD 0.52 Billion in 2025 to USD 2.22 Billion by 2035 at 15.2% CAGR from 2026–2035.

Growth Opportunities

Our assessment indicates that three whitespace opportunities can generate outsized value for vendors with the right module mix.

Can Liquid Cooled Container Retrofits Unlock Brownfield AI Capacity?

Owners of existing sites can add a cooling or power container beside a hall instead of rebuilding it. The Cooling module segment, growing at 15.8% CAGR to USD 4.15 Billion by 2035, benefits most, because retrofit demand scales with the installed base of air-cooled halls. Vendors that sell cooling containers with controls and service contracts can capture recurring revenue.

Will Industrial and Energy Sites Become a Distinct Buyer Segment?

Mines, refineries, wind and solar farms and power utilities need local compute for analytics and automation where no building exists. Industrial and energy buyers grow at 15.0% CAGR to USD 2.75 Billion by 2035, and they value ruggedized, self-contained units with remote monitoring. Vendors with sealed enclosures and wide temperature ratings can price at a premium.

Can Middle East & Africa Leapfrog Through Containerized Capacity?

National AI programs in the UAE and Saudi Arabia are placing orders ahead of permanent construction, and African telecom operators use containers to reach cities without large halls. Middle East & Africa grows at 15.2% CAGR from USD 0.62 Billion in 2026 to USD 2.22 Billion in 2035, the highest rate among regions. Local assembly partnerships and heat tolerant designs create entry points.

Regional Outlook

2025 (USD Billion)
2035 (USD Billion)
North Americ
Europe
Asia-Pacific
Middle East
Latin Americ
Region 2025 (USD Billion) 2035 (USD Billion) CAGR (%)
North America $10.0 USD Billion $40.0 USD Billion 9.0%
Europe $17.1 USD Billion $51.1 USD Billion 27.0%
Asia-Pacific $24.2 USD Billion $62.2 USD Billion 25.0%
Middle East & Africa $31.3 USD Billion $73.3 USD Billion 23.0%
Latin America $38.4 USD Billion $84.4 USD Billion 12.0%

Regional data is locked

Unlock complete regional numbers for this market.

Unlock Full Data

Ecosystem Analysis Impacting the Containerized Data Center Market
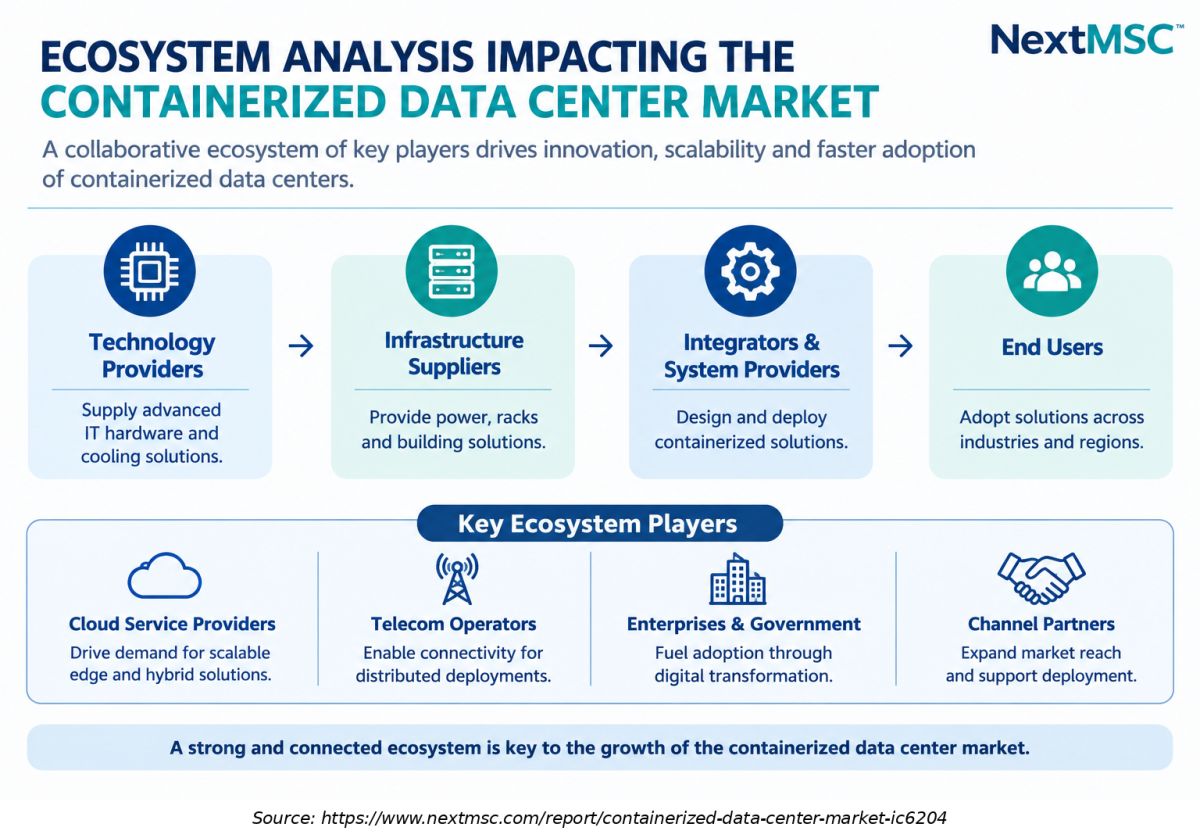
The infographic highlights the key stakeholders in the containerized data center ecosystem, including technology providers, infrastructure suppliers, system integrators, logistics partners, and service providers. It also shows how cloud and colocation providers, enterprises, telecom operators, and government and industrial users drive adoption. Collaboration across the ecosystem enables efficient deployment, edge computing, and scalable modular infrastructure.

Competitive Landscape

Our findings suggest that the competitive landscape of this industry is moderately fragmented, with power, thermal and IT specialists meeting inside the same container.

How Do Companies Compete in the Containerized Data Center Market?

Vendors compete on time to deliver, thermal performance, power density and the ability to certify units locally. STULZ quotes delivery in under 24 weeks for typical projects, ZTE cites projects delivered in as little as seven months, and Delta cites a 60% cut in deployment time. Pricing follows bundles of container, power and cooling, and geographic expansion often relies on local integrators and service partners.

Which Competitive Archetypes Dominate the Containerized Data Center Market?

Three archetypes stand out. Power and energy groups such as Schneider Electric, Eaton and Delta differentiate through electrical content and service networks. Telecom and IT groups such as Huawei, ZTE, Inspur and Sugon differentiate through integrated compute and cooling for AI and edge. Specialists such as Rittal, STULZ, Kehua and Kstar differentiate through enclosure engineering, climate control and regional delivery.

What Innovation and Differentiation Strategies Are Companies Pursuing?

We observed that vendors are shifting from standalone enclosures to complete product families with common controls. Delta pairs a 20-foot liquid cooled container with CDU technology, Schneider Electric offers reference designs built with NVIDIA, and Huawei markets prefabricated modules that cut delivery time by more than half. Digital twin validation and 800 VDC power are becoming the main differentiators.

What M&A and Partnership Activity Is Shaping the Market?

Our analysis shows that partnerships matter more than acquisitions. Eaton collaborates with Flexnode on prefabricated halls of 3.5 to 35 megawatts and led its funding round, while Schneider Electric coauthored an installation time study with a large data center operator. Vertiv and Flex expanded their broader prefabricated data center infrastructure offerings in 2025–2026. These developments indicate growing competition in modular infrastructure, but direct competition in the containerized data center market should be established through specific containerized product evidence.

Key Market Players

Based on research conducted by NMSC, the following 11 companies represent the validated leadership set across containerized data center supply as of 2026.

Huawei Technologies Co., Ltd. Schneider Electric SE Delta Electronics, Inc. Eaton Corporation plc ZTE Corporation Inspur Electronic Information Industry Co., Ltd. Friedhelm Loh Stiftung & Co. KG (Rittal) STULZ GmbH Dawning Information Industry Co., Ltd. (Sugon) Kehua Data Co., Ltd. Shenzhen Kstar Science & Technology Co., Ltd.

Latest Developments

During our market evaluation, we noticed that 2025–2026 activity centers on AI ready prefabricated systems, higher voltage power and capacity expansion by adjacent suppliers.

Date Event
October 2026 Schneider Electric unveiled the Rapid Scale Modular Data Center Reference Design 115, a prefabricated blueprint for liquid cooled AI factories built around the NVIDIA Vera Rubin platform.
October 2026 Flex expanded its prefabricated modular data center portfolio at the OCP Global Summit, adding an AC power rack, cooling distribution units and high-density IT racks.
June 2026 Delta Electronics debuted a prefabricated AI modular data center at COMPUTEX 2026 in modular and containerized formats, with deployment time reduced by up to 60%.
March 2026 Vertiv announced four new or expanded manufacturing facilities in the Americas, with South Carolina capacity for infrastructure solutions expected to rise about seven times.
January 2026 Eaton and Flexnode announced a collaboration on prefabricated data halls of 3.5 to 35 MW with 800 VDC power, and Eaton led Flexnode’s Series A round.

Expert Insights

Siraj Aziz

Siraj Aziz

Analyst Leading Prefabricated Modular and Micro Data Center Research | Omdia

"We expect PMDC and micro-DC innovation to continue, with a focus on high power density to support highly configured servers optimized for AI workloads."

Analyst Interpretation

The insight identifies high-density computing as a key technology requirement shaping the containerized data center market. AI and GPU-intensive workloads are increasing the need for advanced power distribution and thermal management. Manufacturers that integrate liquid cooling, efficient power systems, and scalable module architectures are positioned to address these evolving infrastructure requirements.

Investment Opportunities

Where Are Capital Inflows Concentrating in the Containerized Data Center Market?

Capital is flowing to AI ready capacity and the factories that build it. Global data center investment reached about half a trillion dollars in 2024, and the five largest technology spenders lifted capital expenditure above USD 400 billion in 2025. Within this pool, multi-container and custom configurations offers the best growth at 15.0% CAGR, and manufacturers expanding assembly capacity, such as Vertiv in South Carolina, attract the most funding.

How Is Infrastructure Investment Shaping Market Capacity?

Vendors are adding plants and standard designs so that units can ship in months, not years. Schneider Electric says its manufacturing capacity has grown fourfold since 2025, and Flex cites more than three million square feet of data center manufacturing space in the United States. Investors should expect capacity to outpace grid readiness through 2027, so projects with secured power hold the strongest return profile.

What ESG Considerations Are Influencing Market Investment?

Emissions from data center electricity use are projected to rise from about 180 Mt today to about 300 Mt by 2035, which pulls ESG scrutiny onto every new site. Containers help by limiting site disturbance, enabling heat reuse and supporting precise metering, and vendors claim PUE as low as 1.15 for liquid cooled units. Investors increasingly require energy and water data before financing, so verified efficiency has become a commercial asset.

Key Benefits for Stakeholders

How Does This Report Benefit Industry Leaders and Data Center Operators?

Operators gain segment level sizing for container size, module type and end user, along with regional forecasts through 2035. This helps them time orders against grid readiness, compare 20-foot and 40-foot formats, and plan cooling and power content per site. The competitive analysis and the verified vendor set support shortlisting and negotiation of delivery terms.

How Does This Report Benefit Investors and Financial Analysts?

Investors receive a reconciled market model in which every segment and region sums to the global total, together with CAGR figures calculated on a consistent 2026–2035 basis. The risk matrix quantifies drivers and restraints, and the development log shows where capital is moving. These inputs support screening of manufacturers, component suppliers and project developers.

How Does This Report Benefit Technology Vendors and Product Teams?

Vendors can see which module types and end users grow fastest, such as the Cooling module at 15.8% CAGR and Industrial and energy buyers at 15.0%. The archetype and innovation analysis shows where rivals differentiate, which guides roadmap choices on liquid cooling, 800 VDC power and digital twins. Country level insights help prioritize partners and certifications.

Key Market Segments Evaluated

By Container size

  • 20-foot
  • 40-foot
  • Multi-container and custom configurations

By Module type

  • Integrated all-in-one
  • IT module
  • Power module
  • Cooling module

By End user

  • Cloud and colocation providers
  • Enterprises
  • Telecom and edge operators
  • Government and defense
  • Industrial and energy

By Region

  • North America 
    • U.S.
    • Canada
    • Mexico
  • Europe 
    • UK
    • Germany
    • France
    • Italy
    • Spain
    • Sweden
    • Denmark
    • Finland
    • Netherlands
    • Rest of Europe
  • Asia-Pacific 
    • China
    • India
    • Japan
    • South Korea
    • Taiwan
    • Indonesia
    • Vietnam
    • Australia
    • Philippines
    • Malaysia
    • Rest of APAC
  • Middle East & Africa 
    • Saudi Arabia
    • UAE
    • Egypt
    • Israel
    • Turkey
    • Nigeria
    • South Africa
    • Rest of MEA
  • Latin America 
    • Brazil
    • Argentina
    • Chile
    • Colombia
    • Rest of LATAM

Conclusion & Recommendations

The market is set to grow from USD 7.78 Billion in 2026 to USD 24.30 Billion in 2035, a 13.5% CAGR, as AI compute and edge demand outrun the speed of conventional construction. Growth will be steady rather than explosive, because grid access limits how quickly buyers can energize new units. We expect the format to become a standard building block alongside permanent halls.

What Strategic Positioning Recommendations Does NMSC Offer?

Vendors should build product families that combine container, power and cooling under one control layer, and prioritize liquid cooling and 800 VDC options. Local assembly or integrator partnerships in the Gulf, India and Latin America will shorten delivery and ease certification. Buyers should secure power commitments before ordering, and negotiate performance guarantees tied to PUE and delivery dates.

What Is the Investment Attractiveness of the Containerized Data Center Market?

The market is attractive, with USD 16.52 Billion of incremental revenue between 2026 and 2035 and double-digit growth in every segment and region. The Cooling module, multi-container and custom configurations, and Industrial and energy buyers offer the highest growth. Fragmented competition leaves room for specialists, although projects without secured power carry timing risk.

What Are the Market Shifts and Key Risks in the Containerized Data Center Market?

Key shifts include higher rack power, liquid cooling inside the unit, and multi container campuses at megawatt scale. Risks include grid delays, transformer lead times, certification differences and the possibility that permanent halls regain share if construction speeds improve. Currency swings and import duties also weigh on Latin America and parts of Africa.

What Are the Primary Growth Pathways Through 2035?

Three pathways stand out. AI and cloud campuses will drive volume in North America and Asia-Pacific through linked 40-foot units. Retrofit cooling and power containers will upgrade existing halls, and edge programs by telecom, industrial and public sector buyers will add steady orders. Middle East & Africa and India offer the fastest regional gains, at 15.2% and 17.3% CAGR.

FAQs

Sources & References

1.

International Energy Agency, Energy and AI: Executive summary

iea.org
2.

International Energy Agency, Data centre electricity use surged in 2025 (16 April 2026)

iea.org
3.

U.S. Department of Energy, Report on data center electricity demand (20 December 2024)

energy.gov
4.

Lawrence Berkeley National Laboratory, Berkeley Lab report on data center electricity demand

newscenter.lbl.gov
5.

European Commission, Energy performance of data centres

energy.ec.europa.eu
6.

European Commission, EU wide scheme for rating sustainability of data centres (15 March 2024)

energy.ec.europa.eu
7.

Delta Electronics, AI Containerized Data Center Solutions

deltaww.com
8.

Delta Electronics, prefabricated AI modular data center at COMPUTEX 2026 (2 June 2026)

prnewswire.com
9.

Schneider Electric, RapidScale Modular Data Center Reference Design 115 (21 October 2026)

globenewswire.com
10.

Schneider Electric, next generation prefabricated power modules (16 September 2026)

se.com
11.

Schneider Electric, Smart Shelter Container prefabricated data center modules

se.com
12.

Eaton, Eaton expands modular data center offering (28 January 2026)

eaton.com
13.

Eaton, containerized modular data center

eaton.com
14.

Inspur, Prefabricated AI Data Center, Tokyo, Japan

en.inspur.com
15.

ZTE, AIDC Prefabricated Container Solution (3 July 2025)

zte.com.cn
16.

ZTE, Container Data Center Solution

zte.com.cn
17.

Huawei, FusionDC1000B Prefabricated Modular Data Center

digitalpower.huawei.com
18.

Huawei, The 11 Month Journey: Building an AI Data Center

digitalpower.huawei.com
19.

Huawei, IDS1000 Container Data Center Solution

enterprise.huawei.com
20.

Rittal, Modular data centres in containers

rittal.com
21.

Friedhelm Loh Group, Legal notice

friedhelm-loh-group.com/en/impressum.asp
22.

STULZ, Container Data Center

stulz.com
23.

Sugon, Container Data Center Solutions

sugon.com/en/solution/details
24.

Kehua, 2.4MW Liquid-cooling Data Center Sets Sail for South America

kehua.com
25.

Kstar, Container Data Center

kstar.com
26.

Kstar, About us

kstar.com/about_us.html
27.

Vertiv, OneCore announcement (5 August 2025)

vertiv.com
28.

Vertiv, Expansion of manufacturing capacity (24 March 2026)

investors.vertiv.com
29.

Flex, Prefabricated modular data center solutions

flex.com
30.

Flex, Expands Prefabricated Modular Data Center Portfolio (October 2026)

investors.flex.com

About the Author

Mayurima Roy

Mayurima Roy

Mayurima Roy is Research Analyst at Next Move Strategy Consulting, where she has spent 4 years working across the firm's full industry coverage rather than a single fixed vertical. Her work centers on structured research, ongoing trend tracking, competitive assessment, and insight-led content development, translating complex market data into clear, decision-ready narratives that support informed client decision-making across diverse global industries, market sectors, and world regions every day.

About the Reviewer

Supradip Baul

Supradip Baul

Supradip Baul is an accomplished business consultant and strategist with over a decade of rich experience in market intelligence, strategy, technology, and business transformation. His work has included rigorous qualitative and quantitative analysis across multiple industries, helping clients shape investment decisions and long-term roadmaps. Earlier in his career, he was associated with Gartner, where he contributed to industry-leading reports and market share analyses. He has worked with leading global companies and holds an MBA with a dual specialization in Marketing and Finance.

Download Free Sample

Amos Chang

AMOS CHANG

Strategy Consultant

Kardex Group

I have bought the intralogistics market reports from NMSC two times so far. Joseph and his team are always very helpful and flexible in responding to any customization requirements on the report. Their expertise in market reports really helps us steer the day-to-day business. I will definitely recommend and come back myself whenever there is a need.

Nishant Awate

NISHANT AWATE

Business Development Global Sales

Zehnder Group Deutschland GmbH

Our experience working with Next Move Strategy Consulting was positive. The team was responsive, professional, and open to incorporating our specific requirements throughout the project. The India AHU market study was comprehensive and well structured, covering market value and volume forecasts, product and application segments, and key industry trends. The inclusion of both AHU and residential MVHR market insights made the study particularly relevant for our strategic market assessment. Overall, the report provides a solid foundation for evaluating market potential, identifying priority segments, and supporting business-development decisions in India.

Kevin Coker

KEVIN COKER

Founder, CEO and Board Diector

Proxima Clinical Research

I have been using Next MSC reports for product positioning in a new geography for a long time. They have by far the best reports I have found and the price is reasonable too!

Mohit Agarwal

MOHIT AGARWAL

Chief Manager

DryChem India Pvt. Ltd.

Next Move Strategy Consulting is an amazing team of consultants. We required a market study report for our investors on top priority and the team went above and beyond our expectations to deliver the same with ample supporting data within a short time span enabling us to secure the investments and keep our project timeline maintained. Their professionalism, attention to detail, and timely delivery of actionable recommendations have left a lasting impression on our organization.

Gaurav Jaiswal

GAURAV JAISWAL

Founder & CEO

Yano Charge Private Limited

The EV Charging market research report provided by the NextMSC was exceptionally detailed and insightful. It offered a comprehensive analysis that proved to be a game-changer for our strategic planning. Truly a testament to the NextMSC’s expertise and thoroughness in EV market landscape & analysis.

Custom Market Research Services

We will customize the research for you if the listed report does not fully match your requirements.

Get 30% Free Customization

Select License

This website uses cookies to ensure you get the best experience on our website. Learn more

✖