Environmental Test Chambers Market Global Industry Analysis and Forecast (2026–2035)

Environmental Test Chambers Market size was USD 1,278.52 Million in 2026, projected to reach USD 1,970.19 Million by 2035, growing at a CAGR of 4.9% from 2026 to 2035. Key drivers include AI semiconductor reliability testing, battery qualification, and growing demand for connected software and testing services, with Asia-Pacific leading the market.

Download Free Sample PDF
Base Year (2025)
$1,223.46 Billion
Forecast (2035)
$1,970.19 Billion
CAGR (2026-2035)
4.9%
Top Region
Asia-Pacific

What Is the Environmental Test Chambers Market Size?
The global Environmental Test Chambers Market reached USD 1,223.46 Million in 2025 and is estimated at USD 1,278.52 Million in 2026. It is forecast to reach USD 1,970.19 Million by 2035 at a 4.9% CAGR from 2026–2035. Asia-Pacific leads with about 40% share, while temperature and humidity chambers hold about 52% of revenue.

We observed that demand now follows reliability risk rather than unit volume alone. ESPEC reported record orders of approximately USD 460.6 million for the year ended March 2026, led by AI semiconductor programs and satellite communications work. That mix shows how test capacity is shifting toward high-value qualification needs.

Our assessment indicates that the leading segments in this market are tied to electronics, battery and aerospace qualification work.

Environmental Test Chambers Market Global Industry Analysis and Forecast (2026–2035) Revenue Forecast

Values in USD Billion

2025 $1.22 Billion
2025
2026 $1.28 Billion
2026
2027 $1.34 Billion
2027
2028 $1.41 Billion
2028
2029 $1.48 Billion
2029
2030 $1.55 Billion
2030
2031 $1.62 Billion
2031
2032 $1.70 Billion
2032
2033 $1.79 Billion
2033
2034 $1.87 Billion
2034
2035 $1.97 Billion
2035

Key Takeaways

By Offering: Test chambers and systems held the largest share, expanding from USD 978.77 Million in 2025 to USD 1,477.64 Million by 2035 (4.16% CAGR from 2026–2035); Software and controls is the fastest growing at a 9.16% CAGR from 2026–2035.

By Chamber Type: Temperature and humidity chambers held the largest share, expanding from USD 636.20 Million in 2025 to USD 955.54 Million by 2035; Battery test chambers is the fastest growing at 7.67% CAGR from 2026–2035.

By Chamber Format: Reach-in held the largest share, expanding from USD 648.43 Million in 2025 to USD 1,004.80 Million by 2035; Walk-in and drive-in is the fastest growing at 6.11% CAGR from 2026–2035.

By Cooling Method: Mechanical refrigeration held the largest share, expanding from USD 1,088.88 Million in 2025 to USD 1,694.37 Million by 2035; Thermoelectric is the fastest growing at 8.45% CAGR from 2026–2035.

By End User Industry: Electronics and semiconductors held the largest share, expanding from USD 379.27 Million in 2025 to USD 669.86 Million by 2035; Energy storage and renewables is the fastest growing at 7.26% CAGR from 2026–2035.

By Customer Type: Manufacturers held the largest share, expanding from USD 758.55 Million in 2025 to USD 1,182.11 Million by 2035; Independent testing laboratories is the fastest growing at 5.84% CAGR from 2026–2035.

By Sales Channel: Direct held the largest share, expanding from USD 831.95 Million in 2025 to USD 1,260.92 Million by 2035; Distributors and resellers is the fastest growing at 6.16% CAGR from 2026–2035.

By Customization: Standard held the largest share, expanding from USD 709.61 Million in 2025 to USD 1,103.31 Million by 2035; Customized and engineered to order is the fastest growing at 5.41% CAGR from 2026–2035.

Dominant Region: Asia-Pacific dominated with about 40% share in 2025, worth USD 489.39 Million.

Fastest-Growing Region: Middle East & Africa is expected to register the highest CAGR of 6.32% during 2026–2035.

Dominant Country: China led with an estimated USD 269.16 Million in 2025.

Fastest-Growing Country: India is projected to expand from USD 19.58 Million in 2025 at a CAGR of 9.17%.

The Environmental Test Chambers Market presents an absolute opportunity of approximately USD 691.67 Million between 2026 and 2035. That figure is the 2035 forecast of USD 1,970.19 Million less the 2026 base of USD 1,278.52 Million. Software, services and battery chambers are the most capital efficient places to deploy investment.

According to NMSC analysis, recurring service and software revenue will lift faster than chamber hardware, because installed chambers keep generating calibration, maintenance and connectivity spending long after the initial sale.

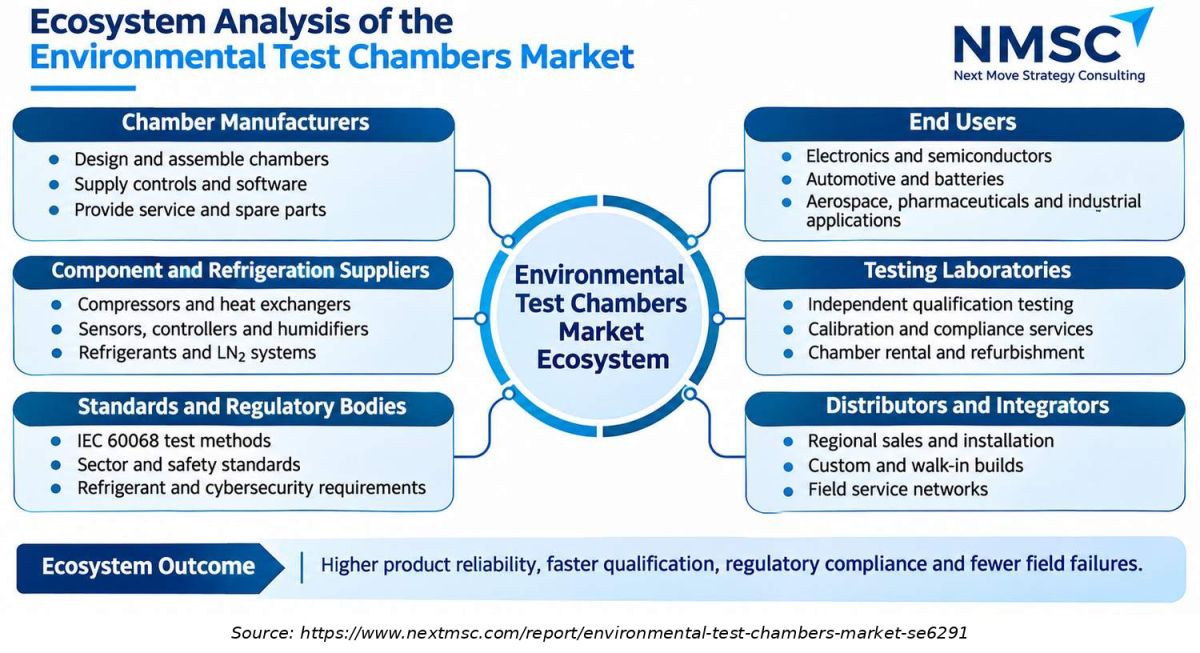
Ecosystem Analysis of the Environmental Test Chambers Market
The ecosystem maps six core stakeholder groups, centered around chamber manufacturers and key component suppliers. Strategic value concentrates in recurring touchpoints, where software, calibration, and field service determine customer retention across testing cycles.

What does the Environmental Test Chambers Market Encompass?

The Environmental Test Chambers Market covers environmental simulation chambers and systems, their controls and software, and related installation, calibration, maintenance, spare parts, rental and refurbishment services. It spans temperature and humidity, thermal shock, altitude, corrosion, HALT and HASS, and battery test chambers, measured at manufacturer revenue and excluding stand alone testing laboratory services, vibration shakers and general laboratory incubators.

The IEC 60068 series, maintained by technical committee 104, defines the test methods that chambers must reproduce, and new editions such as IEC 60068-2-1:2025 keep the baseline moving. We found that connected chambers are drawing added attention to cyber rules, as manufacturers such as Memmert now publish dedicated Cyber Resilience Act reporting channels.

Market Drivers & Dynamics

Interactive Dataset
AI semiconductor and data centre reliability testing driver +1.1% Asia-Pacific, North America 2026–2035
Electrification and battery qualification programs driver +0.9% Asia-Pacific, Europe, North America 2026–2032
Aerospace, space and defense qualification driver +0.6% North America, Europe 2026–2033
Software, connectivity and service attach driver +0.5% Global 2026–2035
Pharmaceutical stability and regulated testing driver +0.4% Global 2026–2035
Cyclical capital spending by EV and battery makers restraint −0.7% Asia-Pacific, Global 2026–2029
Price competition from regional Chinese suppliers restraint −0.6% Asia-Pacific 2026–2033
Outsourcing to independent testing laboratories restraint −0.3% North America, Europe 2026–2032
Refrigerant redesign and compliance cost restraint −0.2% Europe, North America 2026–2030
Source: Next Move Strategy Consulting

Growth Drivers

What Is the Primary Growth Driver in the Environmental Test Chambers Industry?

AI and advanced electronics reliability work is the primary driver. ESPEC cited AI semiconductor demand in Japan and Southeast Asia as the main reason for record orders in the year to March 2026. We found that chip makers now qualify hardware at shorter intervals and higher power density, which raises both chamber counts and chamber size across the Environmental Test Chambers Market.

How Is Electrification Driving the Environmental Test Chambers Market Growth?
Electrification keeps pulling battery and power electronics testing forward. The IEA says global electric car sales rose 20% in 2025 and were 8% lower in the first quarter of 2026 after policy changes in China and the United States. Our findings suggest that the dip delays orders without removing them, since every new pack design still needs thermal cycling, humidity and safety validation.

Growth Inhibitors

What Is Restraining the Environmental Test Chambers Market?

Capital spending cycles and price pressure restrain growth. ESPEC reported that domestic orders fell as EV and battery investment paused, and that competition intensified in China under deflationary conditions. Our analysis shows that buyers delay large purchases when battery programs slow, and that lower priced regional suppliers cap price increases on standard reach in chambers.

What Are the Growth Opportunities?

Can Cleanroom Ready Chambers Capture Fab and Packaging Demand?

Wafer fabs and advanced packaging lines need chambers that meet ISO cleanroom classes and connect to manufacturing systems. Weiss Technik describes a cryo chamber for ISO 4 environments with automatic loading and SECS/GEM links to a manufacturing execution system. Suppliers that certify such designs benefit electronics and semiconductor users, whose revenue reaches USD 669.86 Million by 2035, provided fabs accept new vendors.

Can Integrated Battery Platforms Expand the Addressable Base?

Combined chamber and cycler offerings let one supplier sell the full test cell. ESPEC and Andritz Bitrode built the ADBC with fire suppression and temperature monitoring for cell, module and pack work. The beneficiary is the battery test chamber segment, which reaches USD 256.12 Million by 2035, and realization depends on safety certification and sustained battery capital spending.

Can Software and Service Contracts Raise Recurring Revenue?

Every installed chamber needs calibration, qualification and maintenance. Software and controls plus services reach USD 492.55 Million by 2035. Suppliers that bundle monitoring, calibration schedules and spare parts into multi year agreements lock in customers, provided they maintain field engineers near large installed bases in North America, Europe and Asia-Pacific.

Segmentation Analysis

2025 (USD Billion)
2035 (USD Billion)
Test chambers and systems 2025: $978.77 Billion | 2035: $1,477.64 Billion
Test chamber
Software and controls 2025: $48.94 Billion | 2035: $118.21 Billion
Software and
Services 2025: $195.75 Billion | 2035: $374.34 Billion
Services
Test chambers and systems $978.77 Billion $1,477.64 Billion 4.24%
Software and controls $48.94 Billion $118.21 Billion 9.16%
Services $195.75 Billion $374.34 Billion 6.72%

Which Offering Leads and Which Is Growing Fastest?

Test chambers and systems lead with USD 978.77 Million in 2025, while software and controls grow fastest at 9.2% CAGR from 2026–2035. We observed that connected controllers, remote monitoring and qualification documentation are moving from options to standard scope. Services also outgrow hardware, as maintenance and spare parts follow a rising installed base of machine condition monitoring enabled units.

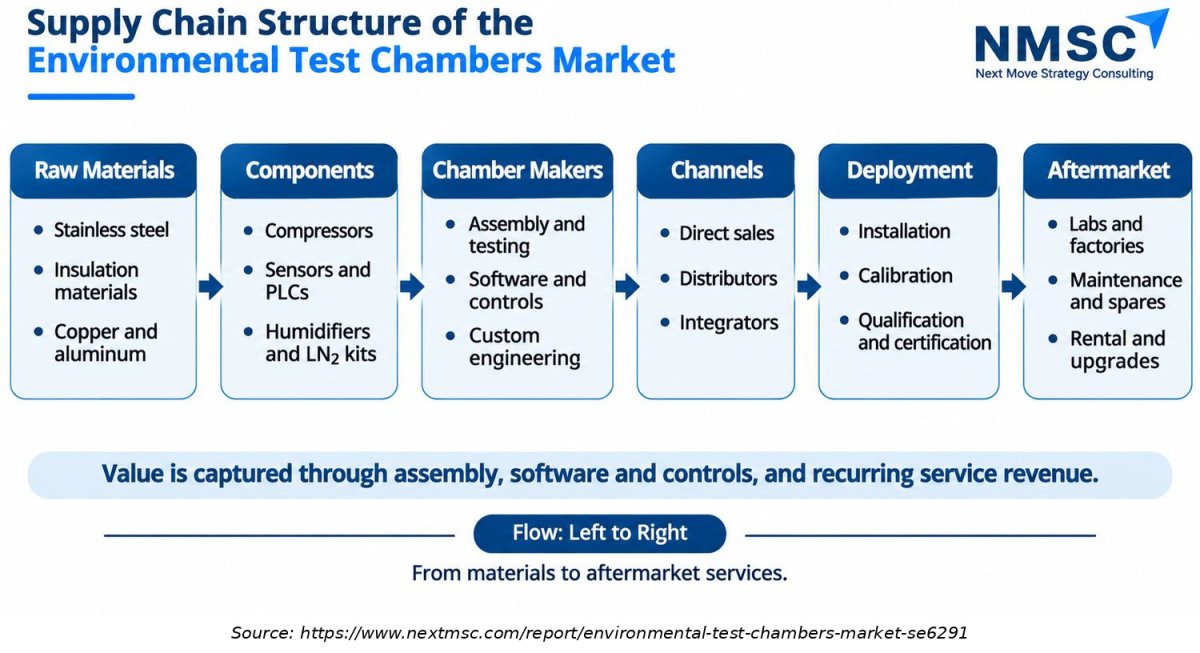
Supply Chain Structure of the Environmental Test Chambers Market
Supply Chain Structure of the Environmental Test Chambers Market
The above infographic traces value from stainless steel, insulation and metals through compressors, sensors and controllers to chamber assembly, channels, deployment and aftermarket. Margin concentrates where engineering and software sit, and in recurring services after installation. Participants that secure component supply, control their software and field service networks, and qualify local partners for installation are best placed to hold pricing when hardware competition intensifies.

Growth Opportunities

Our findings suggest that three concrete opportunities can generate above market revenue for suppliers that invest early.

Can Cleanroom Ready Chambers Capture Fab and Packaging Demand?

Wafer fabs and advanced packaging lines need chambers that meet ISO cleanroom classes and connect to manufacturing systems. Weiss Technik describes a cryo chamber for ISO 4 environments with automatic loading and SECS/GEM links to a manufacturing execution system. Suppliers that certify such designs benefit electronics and semiconductor users, whose revenue reaches USD 669.86 Million by 2035, provided fabs accept new vendors.

Can Integrated Battery Platforms Expand the Addressable Base?

Combined chamber and cycler offerings let one supplier sell the full test cell. ESPEC and Andritz Bitrode built the ADBC with fire suppression and temperature monitoring for cell, module and pack work. The beneficiary is the battery test chamber segment, which reaches USD 256.12 Million by 2035, and realization depends on safety certification and sustained battery capital spending.

Can Software and Service Contracts Raise Recurring Revenue?

Every installed chamber needs calibration, qualification and maintenance. Software and controls plus services reach USD 492.55 Million by 2035. Suppliers that bundle monitoring, calibration schedules and spare parts into multi year agreements lock in customers, provided they maintain field engineers near large installed bases in North America, Europe and Asia-Pacific.

Regional Outlook

2025 (USD Billion)
2035 (USD Billion)
North Americ
Asia-Pacific
Europe
Middle East
Latin Americ
Region 2025 (USD Billion) 2035 (USD Billion) CAGR (%)
North America $10.0 USD Billion $40.0 USD Billion 9.0%
Asia-Pacific $17.1 USD Billion $51.1 USD Billion 27.0%
Europe $24.2 USD Billion $62.2 USD Billion 25.0%
Middle East & Africa $31.3 USD Billion $73.3 USD Billion 23.0%
Latin America $38.4 USD Billion $84.4 USD Billion 12.0%

Regional data is locked

Unlock complete regional numbers for this market.

Unlock Full Data

Competitive Landscape

Our assessment indicates that the industry is moderately fragmented, with a few global specialists and many regional makers competing on price, specification and service coverage.

Dimension Description
Market Structure Moderately fragmented; global specialists lead premium and custom segments while regional suppliers, especially in China, compete on price in standard chambers
Innovation Focus Cleanroom ready and fast ramp chambers for semiconductors, integrated battery test platforms, natural refrigerants, and connected software
M&A Activity Bolt on acquisitions by industrial groups, including SDI Group's purchase of Severn Thermal Solutions in 2025, and consolidation of North American brands under larger owners

How Do Companies Compete in the Environmental Test Chambers Industry?

Suppliers compete on temperature range, ramp rate, uniformity, size, service coverage and software. Buyers in regulated sectors weigh documentation and standards compliance heavily. We observed that large players such as Weiss Technik build local factories, as in Kentwood, to shorten lead times, while distributors extend reach into smaller markets and keep supplier pricing competitive across regions.

Which Competitive Archetypes Dominate the Industry?

Three archetypes dominate. Global specialists such as ESPEC, Weiss Technik, BINDER and Angelantoni Test Technologies cover broad ranges. North American makers such as Thermotron and Thermal Product Solutions emphasize customization and local support. Laboratory equipment families such as Memmert focus on constant climate and stability chambers, and these groups differ most on size range and service reach.

What Innovation and Differentiation Strategies Are Companies Pursuing?

Firms are investing in faster thermal ramps, deeper chambers, battery safety features and cleanroom compliance. ESPEC introduced a 20 K per minute rapid thermal cycle chamber and CO2 refrigerant series, while Memmert pushes connected software. Our findings suggest that suppliers pricing software and service separately from hardware gain better visibility of recurring revenue and stronger customer retention over chamber lifetimes.

What M&A and Partnership Activity Is Shaping the Industry?

Consolidation continues through bolt on deals. SDI Group acquired Severn Thermal Solutions in June 2025 for £4.75 million, adding environmental chambers to its laboratory equipment segment. Thermal Product Solutions bought Redline Chambers, and Venturedyne, Thermotron's holding company, acquired a sheet metal supplier. We found that partnerships such as the ESPEC and Andritz Bitrode battery platform also widen offerings without full mergers.

Key Market Players

Based on research conducted by NMSC, we found that seven companies pass the eligibility tests for this market, and others could not be verified from official sources.

ESPEC Corp. Weiss Technik GmbH Thermotron Industries, Inc. BINDER GmbH Angelantoni Test Technologies S.r.l. Thermal Product Solutions, LLC Memmert GmbH + Co. KG

Latest Developments

Our analysis shows that 2025 and 2026 activity centers on capacity additions, semiconductor and battery focused products, and small acquisitions.

Date Event
March 2026 ESPEC introduced the EHS‑222M‑L deep capacity HAST chamber for large multilayer boards used in AI semiconductor and data centre hardware.
February 2026 Weiss Technik showcased a new cryo chamber for wafer warpage work, designed for ISO 4 cleanroom use and temperatures down to –75 °C.

Investment Opportunities

Where Are Capital Inflows Concentrating in the Environmental Test Chambers Industry?

Verified activity centers on North American capacity and bolt on acquisitions. Weiss Technik North America is investing $25.6 million in a Michigan facility, and SDI Group paid £4.75 million for Severn Thermal Solutions. NMSC interprets these moves as a bet on aerospace, defense and electronics testing, and on service rich niche suppliers that can be integrated into larger laboratory equipment groups.

How Is Infrastructure Investment Shaping Market Capacity?

Capacity is being added close to demand. The Kentwood plant is planned at 125,000 square feet, and Weiss Technik sells walk in and drive in chambers that need large local assembly space. We found that fab ready and battery safe designs need specialized test floors, so manufacturers that build application laboratories and service hubs shorten qualification cycles for customers.

What ESG Considerations Are Influencing Market Investment?

Environmental considerations focus on refrigerants and energy use. ESPEC offers CO2 R-744 reach in chambers, and buyers increasingly ask for lifecycle energy data alongside performance. Social and governance considerations include worker safety around battery tests and cyber resilience of connected units, which Memmert addresses through a dedicated reporting channel. Suppliers that document these features win procurement points with regulated and public buyers.

Key Benefits for Stakeholders

How Does This Report Benefit Industry Leaders and Test Laboratory Managers?

Laboratory heads and engineering managers gain segment forecasts across eight axes and five regions for 2025–2035. They can compare chamber types, formats and cooling methods against their own test plans. The data shows reach in chambers at USD 648.43 Million in 2025, which supports decisions on standard versus custom purchases and on renting versus buying.

How Does This Report Benefit Investors and Financial Analysts?

Investors receive a reconciled size of USD 1,223.46 Million in 2025 growing to USD 1,970.19 Million by 2035, plus the offering split that separates hardware from software and services. Software and controls at 9.2% CAGR and battery chambers at 7.7% show where recurring and fast growing revenue sits for screening acquisition targets.

How Does This Report Benefit Chamber Manufacturers and Product Teams?

Product teams see which formats and cooling methods grow fastest, such as walk-in and drive-in units at 6.1% and thermoelectric cooling at 8.4%. The competitive assessment shows how rivals combine cleanroom designs, battery platforms and software, which helps roadmap priorities and decisions on partnerships with cycler or software vendors.

Key Market Segments Evaluated

By Offering

  • Test chambers and systems
  • Software and controls
  • Services 
    • Installation and commissioning
    • Calibration and qualification
    • Maintenance and spare parts
    • Rental and refurbishment

By Chamber Type

  • Temperature and humidity chambers
  • Thermal shock and rapid thermal cycle chambers
  • Altitude and combined environment chambers
  • Corrosion and weathering chambers
  • HALT and HASS chambers
  • Battery test chambers

By Chamber Format

  • Benchtop
  • Reach-in
  • Walk-in and drive-in

By Cooling Method

  • Mechanical refrigeration
  • Liquid nitrogen and cryogenic
  • Thermoelectric

By End User Industry

  • Electronics and semiconductors
  • Automotive and mobility
  • Aerospace and defense
  • Pharmaceuticals and life sciences
  • Energy storage and renewables
  • Industrial and materials

By Customer Type

  • Manufacturers
  • Independent testing laboratories
  • Research institutes and universities

By Sales Channel

  • Direct
  • Distributors and resellers

By Customization

  • Standard
  • Customized and engineered to order

By Region

  • North America 
    • U.S.
    • Canada
    • Mexico
  • Europe 
    • UK
    • Germany
    • France
    • Italy
    • Spain
    • Sweden
    • Denmark
    • Finland
    • Netherlands
    • Rest of Europe
  • Asia-Pacific 
    • China
    • India
    • Japan
    • South Korea
    • Taiwan
    • Indonesia
    • Vietnam
    • Australia
    • Philippines
    • Malaysia
    • Rest of APAC
  • Middle East & Africa 
    • Saudi Arabia
    • UAE
    • Egypt
    • Israel
    • Turkey
    • Nigeria
    • South Africa
    • Rest of MEA
  • Latin America 
    • Brazil
    • Argentina
    • Chile
    • Colombia
    • Rest of LATAM

Conclusion & Recommendations

The outlook is steady and positive, with revenue moving from USD 1,278.52 Million in 2026 to USD 1,970.19 Million by 2035. We classify the industry as mature with growth pockets, so expansion comes from electronics, batteries, software and services rather than from broad unit growth. Reliability requirements rise with each product generation, which keeps replacement and upgrade demand healthy.

What Strategic Positioning Recommendations Does NMSC Offer?

Suppliers should prioritize three moves. First, build cleanroom ready and fast ramp chambers for semiconductor users. Second, partner with battery cycler vendors for integrated platforms. Third, package software, calibration and maintenance into multi year contracts. Regional players should defend service quality, since price competition in standard chambers will stay intense, especially in China and other Asian markets.

How Attractive Is the Environmental Test Chambers Market for Investment?

Attractiveness is moderate to good. The absolute opportunity is USD 691.67 Million between 2026 and 2035, and the highest growth sits in software, battery chambers and the Middle East & Africa. Asia-Pacific holds the largest revenue base. Cyclical battery spending and price pressure argue for selective exposure to suppliers with service revenue and differentiated products.

What Are the Key Market Shifts and Risks in the Environmental Test Chambers Market?

Key shifts include integration of chambers with cyclers, connected software and natural refrigerants. Main risks are pauses in EV and battery capital spending, price competition from regional manufacturers, outsourcing of testing to independent laboratories and the cost of refrigerant and cyber compliance. Suppliers with diversified end users and strong service networks handle these risks best.

What Are the Primary Growth Pathways Through 2035?

Growth pathways are cleanroom ready chambers for fabs, integrated battery platforms and recurring software and services. Asia-Pacific adds the most absolute revenue, rising from USD 489.39 Million in 2025 to USD 857.03 Million by 2035. Smaller regions such as the Middle East & Africa grow faster from a low base and reward distributor partnerships.

Delivered Customizations

We have successfully delivered the following deep-dive customizations:

Client Request Customization Delivered Value Adds
Historical Equipment Sales & Market Revenue Analysis
  • Historical market revenue and unit shipment analysis for environmental test chambers, split by offering category, 2020 to 2025.
  • Establishes the baseline growth trajectory and identifies which offering categories have driven past market expansion.
Company-Level Offering Share Analysis
  • Company-level revenue share by offering category (chambers, controls and software, accessories and services) for leading manufacturers.
  • Shows competitive positioning by offering and highlights where share gains or losses are concentrated.
Country-Level Trade Flow Assessment
  • Country-wise import and export analysis of environmental test chambers and related components using HS-coded trade data.
  • Identifies major sourcing and export hubs, supporting supply chain, localization, and market entry decisions.
Offering-Level Revenue Mix & Growth Outlook
  • Forecast of revenue by offering (chambers, software and controls, services) across the 2026 to 2035 horizon.
  • Pinpoints the fastest-growing offerings to guide product portfolio investment and R&D prioritization.
Installed Base Service Revenue Potential
  • Estimate of aftermarket calibration, maintenance, and spares revenue derived from the installed base of chambers.
  • Quantifies recurring service opportunities, supporting service expansion and lifecycle revenue strategy.
Offering-Level Margin & Segment Benchmarking
  • Benchmarking of segment-level revenue and margin disclosures for listed chamber manufacturers and testing service providers.
  • Reveals where hardware, software, and service economics differ, informing pricing and offering mix decisions.

FAQs

Sources & References

1.

International Energy Agency, Global EV Outlook 2026

iea.org
2.

International Electrotechnical Commission, IEC 60068-2 series

webstore.iec.ch
3.

ESPEC Corp. (corporate site)

espec.co.jp/english
4.

ESPEC North America, Battery Show South 2026 news

espec.com
5.

ESPEC North America, news index

espec.com
6.

ESPEC and Andritz Bitrode press release, October 6, 2025

markets.financialcontent.com
7.

Michigan Governor's Office, August 21, 2025 release

michigan.gov
8.

SDI Group plc, LSE announcement, June 6, 2025

sharesmagazine.co.uk
9.

Silicon Saxony e.V., Weiss Technik cryo chamber event

silicon-saxony.de
10.

Unitemp, ESPEC EHS-222M-L HAST launch, March 24, 2026

mail.iconnect007.com
11.

ESPEC rapid thermal cycle and CO2 refrigerant news

advancedengineeringuk.com
12.

BINDER GmbH, company news

binder-world.com
13.

Thermotron Industries, About us

thermotron.com/about-us
14.

Thermotron Industries, company expansion news

thermotron.com
15.

Angelantoni Test Technologies, IAF member profile

iafastro.org
16.

Thermal Product Solutions, LLC

thermalproductsolutions.com/custom-solutions
17.

Memmert GmbH + Co. KG, company news and product pages

memmert.com
18.

SCHUNK Group, Weiss Technik news

schunk-group.com

About the Author

Liza Phukan

Liza Phukan

Liza Phukan is Research Associate at Next Move Strategy Consulting, where she has covered emerging industries and market research across sectors for 3.5 years. Her work includes analyzing industry developments, validating market data, and developing structured business content from research findings. She uses secondary research and data-validation practices to turn complex market information into clear decision-useful market analysis for business audiences and support report development and B2B.

About the Reviewer

Supradip Baul

Supradip Baul

Supradip Baul is an accomplished business consultant and strategist with over a decade of rich experience in market intelligence, strategy, technology, and business transformation. His work has included rigorous qualitative and quantitative analysis across multiple industries, helping clients shape investment decisions and long-term roadmaps. Earlier in his career, he was associated with Gartner, where he contributed to industry-leading reports and market share analyses. He has worked with leading global companies and holds an MBA with a dual specialization in Marketing and Finance.

Download Free Sample

Amos Chang

AMOS CHANG

Strategy Consultant

Kardex Group

I have bought the intralogistics market reports from NMSC two times so far. Joseph and his team are always very helpful and flexible in responding to any customization requirements on the report. Their expertise in market reports really helps us steer the day-to-day business. I will definitely recommend and come back myself whenever there is a need.

Nishant Awate

NISHANT AWATE

Business Development Global Sales

Zehnder Group Deutschland GmbH

Our experience working with Next Move Strategy Consulting was positive. The team was responsive, professional, and open to incorporating our specific requirements throughout the project. The India AHU market study was comprehensive and well structured, covering market value and volume forecasts, product and application segments, and key industry trends. The inclusion of both AHU and residential MVHR market insights made the study particularly relevant for our strategic market assessment. Overall, the report provides a solid foundation for evaluating market potential, identifying priority segments, and supporting business-development decisions in India.

Robert Sean Trevino

ROBERT SEAN TREVINO

Sr. Director, Head of Strategic Insights & Analytics

Foundation Medicine

I realized that it was a reliable source of information. These days, there are many people who are looking for authentic data, and this is one of the only sources that can offer them with what they need;

Mohit Agarwal

MOHIT AGARWAL

Chief Manager

DryChem India Pvt. Ltd.

Next Move Strategy Consulting is an amazing team of consultants. We required a market study report for our investors on top priority and the team went above and beyond our expectations to deliver the same with ample supporting data within a short time span enabling us to secure the investments and keep our project timeline maintained. Their professionalism, attention to detail, and timely delivery of actionable recommendations have left a lasting impression on our organization.

Melanie Samko

MELANIE SAMKO

Director of Marketing

TOSOH BIOSCIENCE, INC.

The information provided by NMSC is incredibly valuable, thank you so much for such a excellent work. I really appreciate it. I will make sure to reference all of it, in my summary document.

Custom Market Research Services

We will customize the research for you if the listed report does not fully match your requirements.

Get 30% Free Customization

Select License

This website uses cookies to ensure you get the best experience on our website. Learn more

✖