India Electric Vehicle (EV) Charging Market by Charging Type (Off-Board Top-Down Pantograph, On-Board Bottom-Up Pantograph, and Charging Via Connector), Charging Voltage Level (Level 1 (<3.7 KW), Level 2 (3.7–22 KW), and Level 3 (Above 22 KW)), Charging Point Type (AC (Normal Charging), DC (Super Charging), and Inductive Charging/Wireless), Charger Type (Slow Charger and Fast Charger), by Charging Infrastructure Type (Combined Charging System (CCS), CHAdeMO, Type1/Normal Charger, Tesla Super Charger, Type 2, and GB/T (Level 3)), by Installation Type (Portable Charger and Fixed Charger), by IoT Connectivity (Non-Connected Charging Stations and Smart Connected Charging Stations (Networked)) and by Application (Commercial and Residential) –Opportunity Analysis and Industry Forecast 2024–2030

India Electric Vehicle (EV) Charging Market

Industry:  Automotive & Transportation | Publish Date: Apr 2024 | No of Pages:  60 | No. Tables:  82 | No. Figures:  43

Market Definition

India Electric Vehicle (EV) Charging Market was valued at USD 588.6 million in 2023, and is predicted to reach USD 5695.6 million by 2030, with a CAGR of 39.1% from 2024 to 2030.

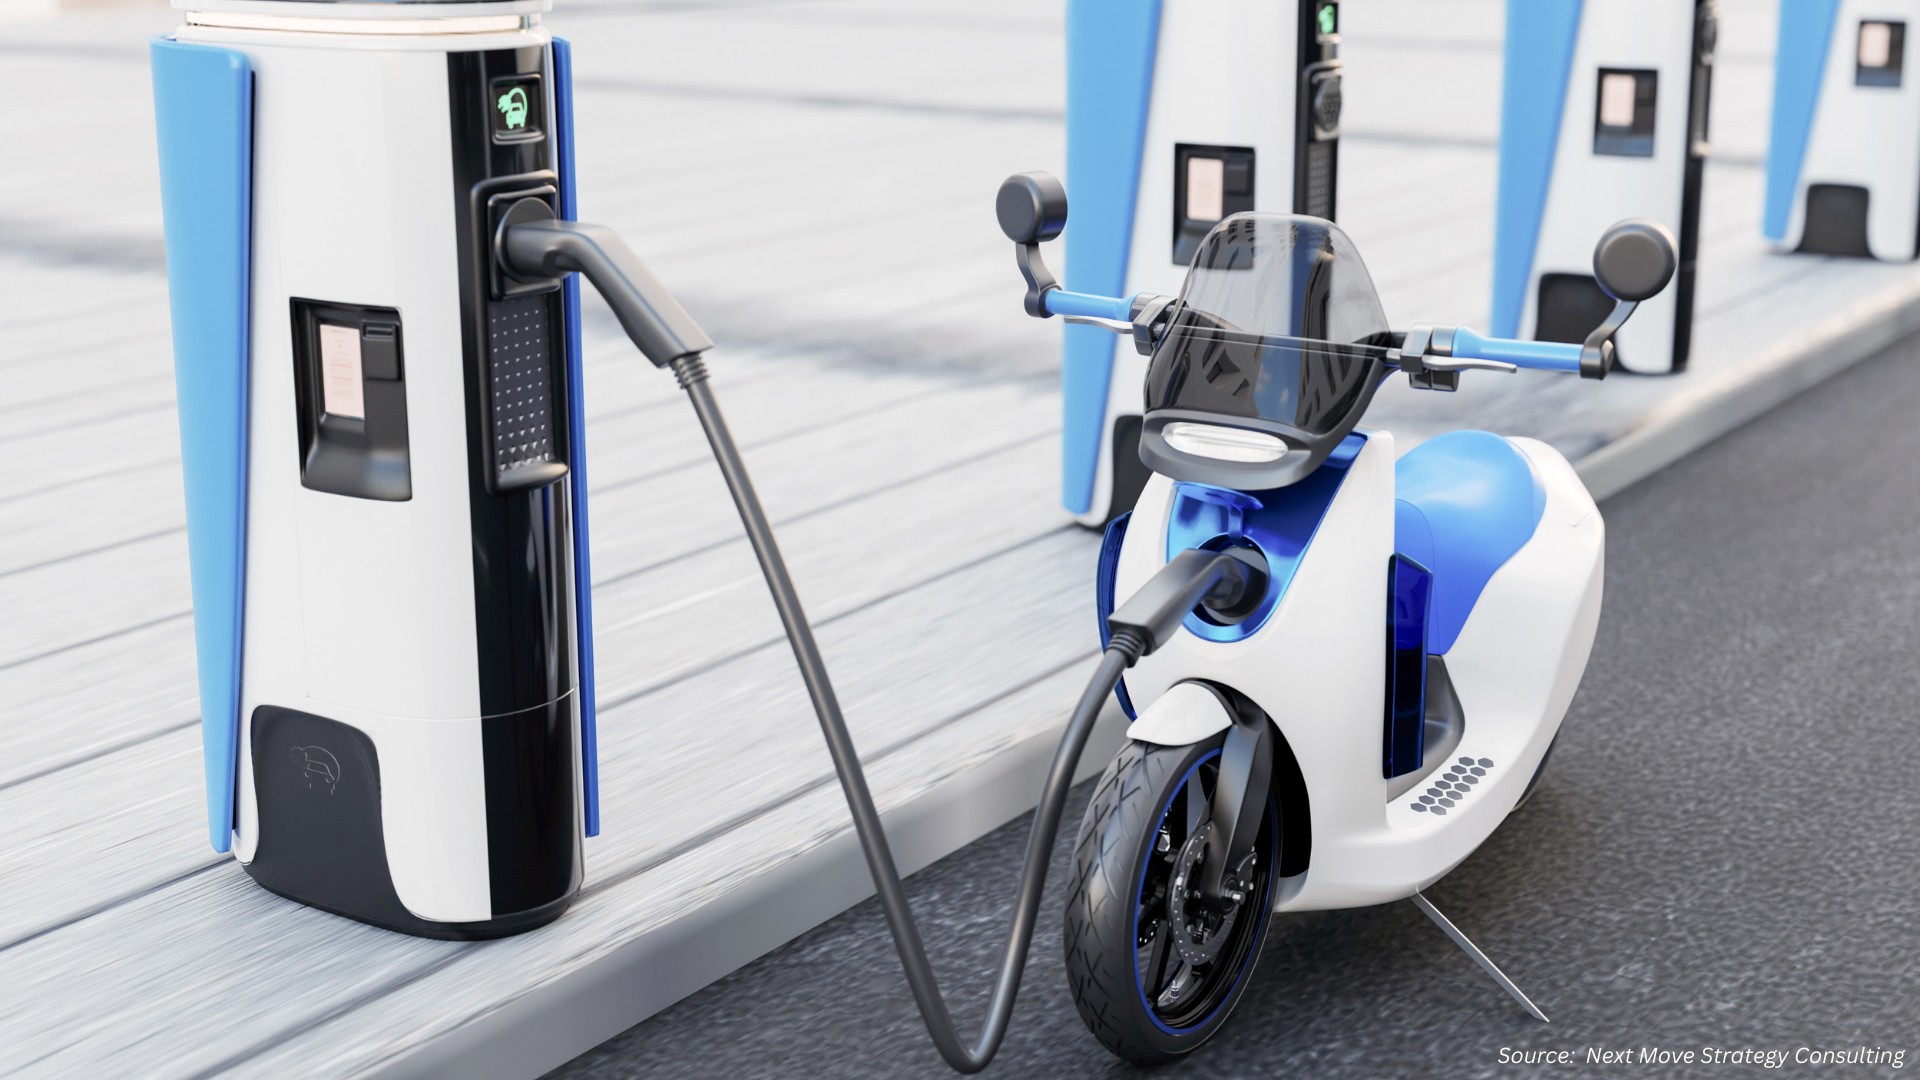
The Indian EV charging market includes a dynamic landscape of businesses and activities dedicated to providing essential charging infrastructure for EVs. This infrastructure comprises diverse charging stations, ranging from battery charging stations and rapid charging stations to innovative battery exchange stations.

As the electric mobility revolution gains momentum, the industry is undergoing remarkable growth, with a pivotal focus on expanding the charging network to seamlessly accommodate the surging adoption of electric vehicles. As per the Ministry of Road Transport & Highways, the Indian EV industry witnessed remarkable growth, surging by 209.2% in 2022 compared to 2021.

A total of 1,024,808 EVs were registered in 2022, significantly surpassing the previous year's figure of only 331,466 registrations in 2021. A noteworthy development within the EV Charging market is the emergence of universal charging standards. Recognized as a strategic imperative, these standards aim to streamline the charging experience for EV users, eliminating complexity and fostering the efficient expansion of the charging network.

As the industry evolves, there is a discernible emphasis on establishing a resilient network of charging stations, addressing the needs of both individual consumers and fleet operators. This focus reflects the industry's commitment to overcoming challenges and seizing opportunities in the ongoing development of this critical infrastructure.

Growing Sale of EVs Increases the Demand for Ev Charging Solutions

The remarkable surge in electric vehicle (EV) sales emerges as a key driving force propelling the expansion of the EV charging market. The growing adoption of EVs is not just a shift in transportation preferences but a catalyst fueling the demand for EV charging solutions.

As the number of electric vehicles traversing our roads experiences a rapid ascent, the necessity for a robust network of charging stations becomes increasingly evident. This surge in demand stems from the pressing need to support both individual consumers and the expanding fleets of electric vehicles, creating a symbiotic relationship between the growth of EV sales and the demand for charging infrastructure.

According to insights from the International Energy Agency (IEA), there was a notable boom in electromobility in 2022 in India, Thailand and Indonesia. Collectively, sales of electric cars in these countries more than tripled relative to 2021, reaching nearly 80 000. Sales in 2022 were 7 times higher than in 2019, before the Covid-19 pandemic. 

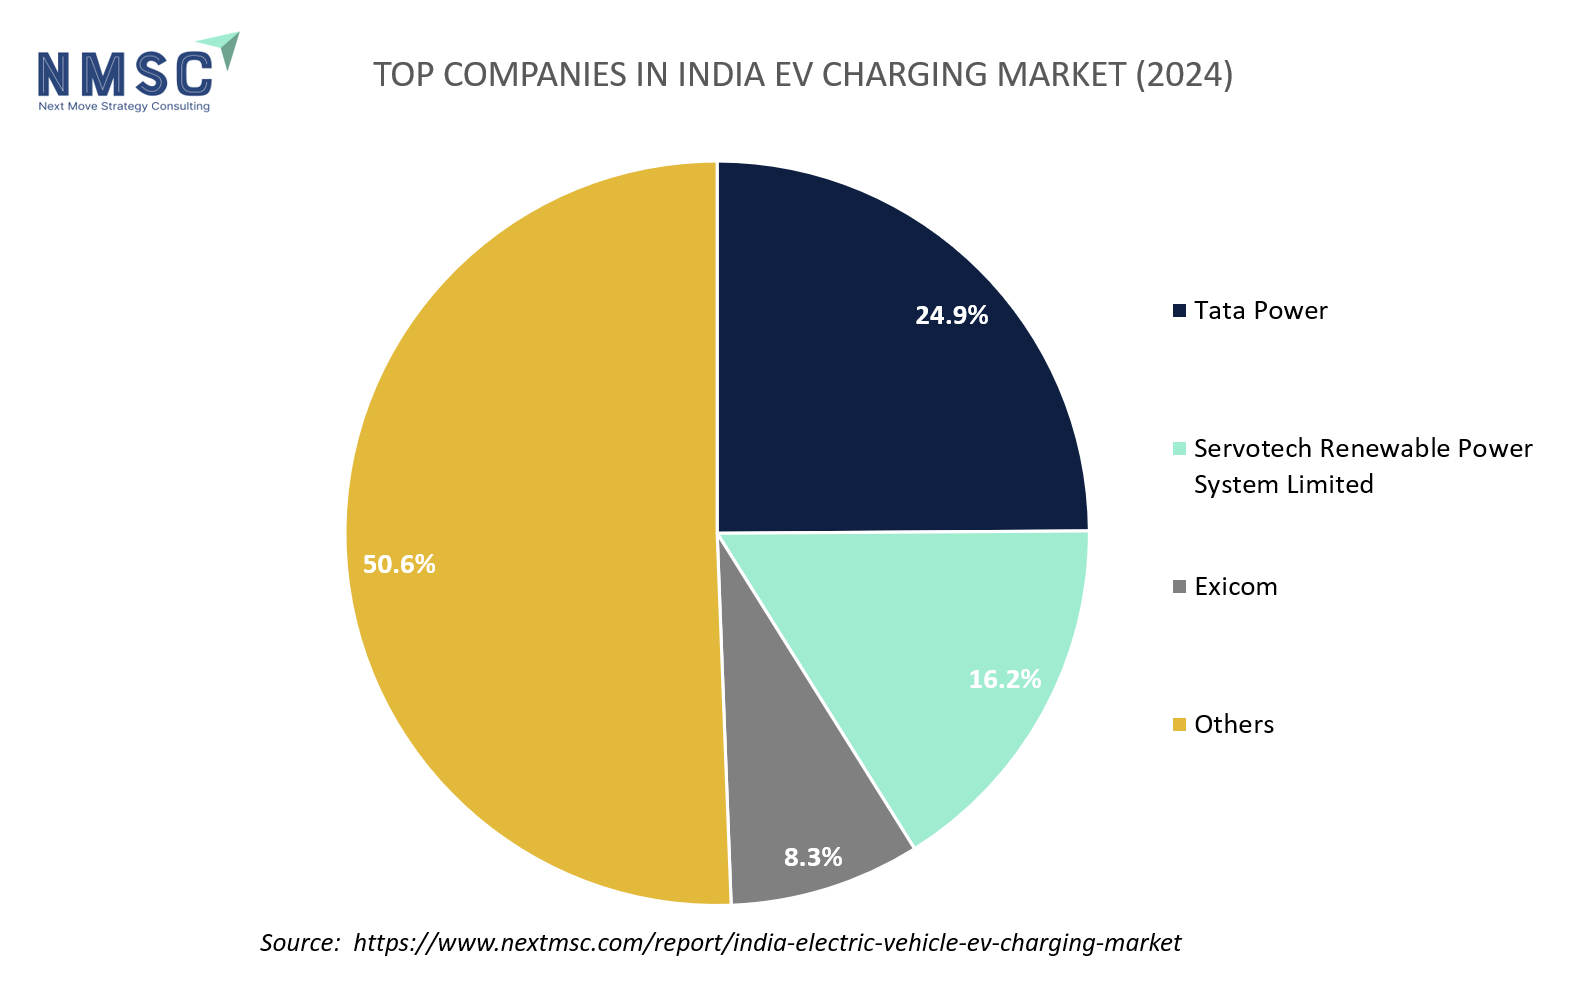
Moreover, In India, BEV sales surged to nearly 50,000 in 2022, with Tata dominating the market, driven by government incentives totaling USD 2 billion under the PLI scheme, attracting investments worth USD 8.3 billion. The landscape of the EV Charging market is further strengthened by the emergence of Electric Vehicle Supply Equipment (EVSE) startups, signaling a transformative phase in the realm of electric mobility. This shift not only marks the industry's growth but also heralds a new era where electric vehicles become increasingly integral to the daily lives.


Government Initiatives and Financial Investments Supports Installation of EV Charging Station

Government initiatives, accompanied by substantial financial investments, play a crucial role in driving the establishment of EV charging stations. This collaborative approach is geared towards fortifying the infrastructure essential for the widespread adoption and convenience of EVs, thereby fostering the growth of sustainable transportation ecosystems.

Numerous policies, subsidies, and grants are pivotal in incentivizing businesses and communities to invest in and deploy charging infrastructure, serving as catalysts for the transition towards cleaner and more sustainable mobility options.

In India, the government provides various financial incentives. The primary mechanism for accessing these incentives is through national programs such as FAME (Faster Adoption and Manufacturing of Electric Vehicles). FAME-II, the current flagship scheme in India promoting electric mobility, offers incentives based on the battery size for different vehicle types.

The integration of renewable energy sources into the charging infrastructure is another noteworthy step taken by countries in the region. This forward-looking approach aligns with the broader objective of creating a sustainable and environmentally conscious framework for EV adoption.

High Initial Setup Costs for Fast Charging Infrastructure and Lack Of Standardization

The challenge of high initial setup costs for fast charging infrastructure stands as a significant restraint hindering the growth of the EV charging industry in India. The substantial expense associated with installing fast charging infrastructure has emerged as a notable barrier, impeding the efficient and widespread deployment of EV charging stations throughout the region.

The elevated cost of installation is rooted in the necessity for substantial investments in both the physical installation process and the supporting grid infrastructure. Notably, the commercialization of chargers boasting a rated power of 1 MW necessitates a considerable financial commitment. Stations with such high-power requirements incur substantial costs, encompassing both installation expenses and the enhancement of the underlying grid infrastructure.


Integration of Internet of Things (IOT) In EV Charging Creates Ample Opportunity

The incorporation of Internet of Things (IoT) technology into EV charging opens up abundant opportunities for the industry. This integration fosters a seamless connection between electric vehicles and charging stations, revolutionizing the charging experience by introducing efficiency and automation in vehicle identification. The capability for remote control and management, provision of personalized services to EV drivers, and real-time responsiveness to user needs are among the array of possibilities unleashed by this integration.

For instance, in June 2023, Bharti Airtel collaborated with Matter Motor Works to equip Matter Aera electric motorcycles with Airtel's IoT solution using advanced eSIMs. This partnership aims to boost connectivity and improve user experiences, aligning with Airtel's broader IoT strategy across diverse industries.

Furthermore, IoT technology plays a key role in enabling preventative maintenance, optimizing the battery charging process, and effectively managing the charging rate to ensure swift charging without surpassing the battery's limits.


Competitive Landscape

The India Electric Vehicle (EV) Charging industry includes several market players such as     Ather Energy Pvt Ltd, BluSmart Tech Pvt. Ltd., Charge Zone, jio-bp pulse, Kazam EV Tech Private Limited, Sharify Services Private Limited (Statiq), Tata Power, Ujoy Technology Private Limited (Bolt Earth), Bharat Petroleum Corporation Limited, and Hindustan Petroleum Corporation Limited.

Charge point operators

Charge point operators (CPOs) are companies that own, operate, and maintain electric vehicle (EV) charging stations. CPOs play a crucial role in providing the infrastructure needed for EV owners to recharge their vehicles. These companies deploy and manage charging stations at various locations such as public parking areas, shopping centers, highways, and workplaces.

CPOs handle tasks such as installing and maintaining charging equipment, processing payments from EV users, and ensuring the reliability and accessibility of charging services. By establishing and managing charging networks, CPOs facilitate the adoption of electric vehicles by providing convenient and reliable charging solutions for EV owners.

List of Charge Point Operators in India

We possess information on 54 charge point operators currently operating in India. For full access to this data, obtain the comprehensive report. Request for sample: https://www.nextmsc.com/india-electric-vehicle-ev-charging-market/request-sample

Key Benefits

  • The report provides quantitative analysis and estimations of the India EV charging market from 2024 to 2030, which assists in identifying the prevailing market opportunities.

  • The study comprises a deep dive analysis of the India EV charging market including the current and future trends to depict prevalent investment pockets in the market.

  • Information related to key drivers, restraints, and opportunities and their impact on the India EV charging market is provided in the report. 

  • Competitive analysis of the players, along with their market share is provided in the report.

  • SWOT analysis and Porters Five Forces model is elaborated in the study.

  • Value chain analysis in the market study provides a clear picture of roles of stakeholder.

India Electric Vehicle (Ev) Charging Market Key Segments

By Charging Type

  • Off-Board Top-Down Pantograph

  • On-Board Bottom-Up Pantograph

  • Charging Via Connector

By Charging Voltage Level

  • Level 1 (<3.7 KW)

  • Level 2 (3.7–22 KW)

  • Level 3 (Above 22 KW)

By Charging Point Type

  • AC (Normal Charging)

  • DC (Super Charging)

  • Inductive Charging/Wireless

By Charger Type

  • Slow Charger

  • Fast Charger

By Vehicle Charging

  • AC (Normal Charging)

  • DC (Super Charging)

  • Inductive Charging

By Charging Infrastructure Size

  • Combined Charging System (CCS)

  • CHAdeMO

  • Type1/Normal Charger

  • Tesla Super Charger

  • Type 2

  • GB/T (Level 3)

By Installation Type

  • Portable Charging

  • Fixed Charging

By IoT Connectivity

  • Non-Connected Charging Stations 

  • Smart Connected Charging Stations (Networked)

By Application

  • Commercial

  • Residential

REPORT SCOPE AND SEGMENTATION:

Parameters

Details

Market Size in 2023

USD 588.6 Million

Revenue Forecast in 2030

USD 5695.6 Million

Growth Rate

CAGR of 39.1% from 2024 to 2030

Analysis Period

2023–2030

Base Year Considered

2023

Forecast Period

2024–2030

Market Size Estimation

Million (USD)

Growth Factors

The increasing government initiatives.

The presence of local EV manufacturer companies.

Companies Profiled

10

Market Share

Available for 10 companies

Customization Scope

Free customization (equivalent up to 80 working hours of analysts) after purchase. Addition or alteration to country, regional, and segment scope.

Pricing and Purchase Options

Avail customized purchase options to meet your exact research needs.

Test

1.     INTRODUCTION

1.1.    REPORT DESCRIPTION

1.2.    Who should read this report 

1.3.    KEY MARKET SEGMENTS

1.4.    Research Methodology

1.4.1         MARKET SIZE ESTIMATION METHODOLOGY

1.4.1.1.      TOP-DOWN AND BOTTOM-UP APPROACH

1.4.1.2.      DEMAND AND SUPPLY SIDE ANALYSIS

1.4.1.3.      MACRO-INDICATOR APPROACH

1.4.2         Data collection approach

1.4.2.1.      PRIMARY DATA COLLECTION

1.4.2.2.      SECONDARY DATA COLLECTION

1.4.2.2.1.      SECONDARY DATA SOURCES

1.4.3         FORECASTING

2.     Market Definition & Scope

2.1.    Definition

2.2.    Scope

3.     INDIAN EV CHARGING Market – Executive Summary

3.1.    Market Snapshot, 2023 - 2030, Million USD

4.     MARKET OVERVIEW

4.1.    MARKET DYNAMICS

4.1.1         DRIVERS

4.1.1.1.      GROWING SALE OF EVS INCREASES THE DEMAND FOR EV CHARGING SOLUTIONS

4.1.1.2.      GOVERNMENT INITIATIVES AND FINANCIAL INVESTMENTS SUPPORTS INSTALLATION OF EV CHARGING STATION

4.1.2         RESTRAINTS

4.1.2.1.      HIGH INITIAL SETUP COSTS FOR FAST CHARGING INFRASTRUCTURE AND LACK OF STANDARDIZATION

4.1.3         OPPORTUNITIES

4.1.3.1.      INTEGRATION OF INTERNET OF THINGS (IOT) IN EV CHARGING CREATES AMPLE OPPORTUNITY

5.     LIST OF CHARGE POINT OPERATORS IN INDIA

6.     India EV Charging MARKET BY, Type of Charger

6.1.    Overview

6.2.    India AC Chargers MARKET BY, Type of Charger

6.3.    India DC Chargers MARKET BY, Type of Charger

7.     India EV Charging MARKET BY, Charging Speed

7.1.    Overview

7.2.    India Level 1 MARKET BY, Charging Speed

7.3.    India Level 2 MARKET BY, Charging Speed

7.4.    India Level 3 MARKET BY, Charging Speed

8.     India EV Charging MARKET BY, Vehicle Type

8.1.    Overview

8.2.    India Passenger Vehicles MARKET BY, Vehicle Type

8.3.    India Electric Buses MARKET BY, Vehicle Type

8.4.    India Electric Goods Carriers MARKET BY, Vehicle Type

9.     India EV Charging MARKET BY, Application

9.1.    Overview

9.2.    India Commercial Application MARKET BY, Application

9.2.1         India Commercial Public EV Charging Stations MARKET BY, Application

9.2.1.1.      India On-Road Charging MARKET BY, Application

9.2.1.2.      India Parking Facilities MARKET BY, Application

9.2.1.3.      India Destination Charging MARKET BY, Application

9.2.2         India Commercial Private EV Charging Stations MARKET BY, Application

9.2.2.1.      India Fleet Charging MARKET BY, Application

9.2.2.2.      India Captive Charging MARKET BY, Application

10   COMPANY PROFILES

           10.1   THE MOSAIC COMPANY

                         10.1.1   COMPANY OVERVIEW

                         10.1.2   COMPANY SNAPSHOT

                         10.1.3   OPERATING BUSINESS SEGMENTS

                         10.1.4   PRODUCT PORTFOLIO

                         10.1.5   BUSINESS PERFORMANCE

                         10.1.6   BUSINESS SEGMENTS

                         10.1.7   GEOGRAPHIC SEGMENTS

                         10.1.8   KEY STRATEGIC MOVES AND DEVELOPMENT

                         10.1.9   PRIMARY MARKET COMPETITORS

           10.2   OCP GROUP

                         10.2.1   COMPANY OVERVIEW

                         10.2.2   COMPANY SNAPSHOT

                         10.2.3   OPERATING BUSINESS SEGMENTS

                         10.2.4   PRODUCT PORTFOLIO

                         10.2.5   BUSINESS PERFORMANCE

                         10.2.6   BUSINESS SEGMENTS

                         10.2.7   GEOGRAPHIC SEGMENTS

                         10.2.8   KEY STRATEGIC MOVES AND DEVELOPMENT

                         10.2.9   PRIMARY MARKET COMPETITORS

           10.3   EUROCHEM GROUP

                         10.3.1   COMPANY OVERVIEW

                         10.3.2   COMPANY SNAPSHOT

                         10.3.3   OPERATING BUSINESS SEGMENTS

                         10.3.4   PRODUCT PORTFOLIO

                         10.3.5   BUSINESS PERFORMANCE

                         10.3.6   BUSINESS SEGMENTS

                         10.3.7   GEOGRAPHIC SEGMENTS

                         10.3.8   KEY STRATEGIC MOVES AND DEVELOPMENT

                         10.3.9   PRIMARY MARKET COMPETITORS

           10.4   JORDAN PHOSPHATE MINES CO.

                         10.4.1   COMPANY OVERVIEW

                         10.4.2   COMPANY SNAPSHOT

                         10.4.3   OPERATING BUSINESS SEGMENTS

                         10.4.4   PRODUCT PORTFOLIO

                         10.4.5   BUSINESS PERFORMANCE

                         10.4.6   BUSINESS SEGMENTS

                         10.4.7   GEOGRAPHIC SEGMENTS

                         10.4.8   KEY STRATEGIC MOVES AND DEVELOPMENT

                         10.4.9   PRIMARY MARKET COMPETITORS

           10.5   YARA INTERNATIONAL ASA

                         10.5.1   COMPANY OVERVIEW

                         10.5.2   COMPANY SNAPSHOT

                         10.5.3   OPERATING BUSINESS SEGMENTS

                         10.5.4   PRODUCT PORTFOLIO

                         10.5.5   BUSINESS PERFORMANCE

                         10.5.6   BUSINESS SEGMENTS

                         10.5.7   GEOGRAPHIC SEGMENTS

                         10.5.8   KEY STRATEGIC MOVES AND DEVELOPMENT

                         10.5.9   PRIMARY MARKET COMPETITORS

           10.6   ICL GROUP

                         10.6.1   COMPANY OVERVIEW

                         10.6.2   COMPANY SNAPSHOT

                         10.6.3   OPERATING BUSINESS SEGMENTS

                         10.6.4   PRODUCT PORTFOLIO

                         10.6.5   BUSINESS PERFORMANCE

                         10.6.6   BUSINESS SEGMENTS

                         10.6.7   GEOGRAPHIC SEGMENTS

                         10.6.8   KEY STRATEGIC MOVES AND DEVELOPMENT

                         10.6.9   PRIMARY MARKET COMPETITORS

           10.7   SAUDI ARABIAN MINING COMPANY

                         10.7.1   COMPANY OVERVIEW

                         10.7.2   COMPANY SNAPSHOT

                         10.7.3   OPERATING BUSINESS SEGMENTS

                         10.7.4   PRODUCT PORTFOLIO

                         10.7.5   BUSINESS PERFORMANCE

                         10.7.6   BUSINESS SEGMENTS

                         10.7.7   GEOGRAPHIC SEGMENTS

                         10.7.8   KEY STRATEGIC MOVES AND DEVELOPMENT

                         10.7.9   PRIMARY MARKET COMPETITORS

           10.8   INNOPHOS HOLDINGS INC.

                         10.8.1   COMPANY OVERVIEW

                         10.8.2   COMPANY SNAPSHOT

                         10.8.3   OPERATING BUSINESS SEGMENTS

                         10.8.4   PRODUCT PORTFOLIO

                         10.8.5   BUSINESS PERFORMANCE

                         10.8.6   BUSINESS SEGMENTS

                         10.8.7   GEOGRAPHIC SEGMENTS

                         10.8.8   KEY STRATEGIC MOVES AND DEVELOPMENT

                         10.8.9   PRIMARY MARKET COMPETITORS

           10.9   GUIZHOU KAILIN HOLDINGS (GROUP) CO LTD.

                         10.9.1   COMPANY OVERVIEW

                         10.9.2   COMPANY SNAPSHOT

                         10.9.3   OPERATING BUSINESS SEGMENTS

                         10.9.4   PRODUCT PORTFOLIO

                         10.9.5   BUSINESS PERFORMANCE

                         10.9.6   BUSINESS SEGMENTS

                         10.9.7   GEOGRAPHIC SEGMENTS

                         10.9.8   KEY STRATEGIC MOVES AND DEVELOPMENT

                         10.9.9   PRIMARY MARKET COMPETITORS

           10.10   YUNTIANHUA GROUP

                         10.10.1   COMPANY OVERVIEW

                         10.10.2   COMPANY SNAPSHOT

                         10.10.3   OPERATING BUSINESS SEGMENTS

                         10.10.4   PRODUCT PORTFOLIO

                         10.10.5   BUSINESS PERFORMANCE

                         10.10.6   BUSINESS SEGMENTS

                         10.10.7   GEOGRAPHIC SEGMENTS

                         10.10.8   KEY STRATEGIC MOVES AND DEVELOPMENT

                         10.10.9   PRIMARY MARKET COMPETITORS

LIST OF TABLES

TABLE 1. LIST OF CHARGE POINT OPERATORS IN INDIA

TABLE 2. INDIA EV CHARGING MARKET BY, TYPE OF CHARGER, 2023-2030, MILLION USD

TABLE 3. INDIA AC CHARGERS MARKET BY, TYPE OF CHARGER, 2023-2030, MILLION USD

TABLE 4. INDIA DC CHARGERS MARKET BY, TYPE OF CHARGER, 2023-2030, MILLION USD

TABLE 5. INDIA EV CHARGING MARKET BY, CHARGING SPEED, 2023-2030, MILLION USD

TABLE 6. INDIA LEVEL 1 MARKET BY, CHARGING SPEED, 2023-2030, MILLION USD

TABLE 7. INDIA LEVEL 2 MARKET BY, CHARGING SPEED, 2023-2030, MILLION USD

TABLE 8. INDIA LEVEL 3 MARKET BY, CHARGING SPEED, 2023-2030, MILLION USD

TABLE 9. INDIA EV CHARGING MARKET BY, VEHICLE TYPE, 2023-2030, MILLION USD

TABLE 10. INDIA PASSENGER VEHICLES MARKET BY, VEHICLE TYPE, 2023-2030, MILLION USD

TABLE 11. INDIA ELECTRIC BUSES MARKET BY, VEHICLE TYPE, 2023-2030, MILLION USD

TABLE 12. INDIA ELECTRIC GOODS CARRIERS MARKET BY, VEHICLE TYPE, 2023-2030, MILLION USD

TABLE 13. INDIA EV CHARGING MARKET BY, APPLICATION, 2023-2030, MILLION USD

TABLE 14. INDIA COMMERCIAL APPLICATION MARKET BY, APPLICATION, 2023-2030, MILLION USD

TABLE 15. INDIA COMMERCIAL PUBLIC EV CHARGING STATIONS MARKET BY, APPLICATION, 2023-2030, MILLION USD

TABLE 16. INDIA ON-ROAD CHARGING MARKET BY, APPLICATION, 2023-2030, MILLION USD

TABLE 17. INDIA PARKING FACILITIES MARKET BY, APPLICATION, 2023-2030, MILLION USD

TABLE 18. INDIA DESTINATION CHARGING MARKET BY, APPLICATION, 2023-2030, MILLION USD

TABLE 19. INDIA COMMERCIAL PRIVATE EV CHARGING STATIONS MARKET BY, APPLICATION, 2023-2030, MILLION USD

TABLE 20. INDIA FLEET CHARGING MARKET BY, APPLICATION, 2023-2030, MILLION USD

TABLE 21. INDIA CAPTIVE CHARGING MARKET BY, APPLICATION, 2023-2030, MILLION USD

TABLE 22. INDIA RESIDENTIAL APPLICATION MARKET BY, APPLICATION, 2023-2030, MILLION USD

                   TABLE 23. THE MOSAIC COMPANY: COMPANY SNAPSHOT

                   TABLE 24. THE MOSAIC COMPANY: OPERATING BUSINESS SEGMENTS

                   TABLE 25. THE MOSAIC COMPANY: PRODUCT PORTFOLIO

                   TABLE 26. THE MOSAIC COMPANY: SALES BY BUSINESS SEGMENTS (2021-2023)

                    TABLE 27. THE MOSAIC COMPANY: SALES BY GEOGRAPHIC SEGMENTS (2021-2023)

                    TABLE 28. THE MOSAIC COMPANY: KEY STRATERGY

                    TABLE 29. OCP GROUP: COMPANY SNAPSHOT

                    TABLE 30. OCP GROUP: OPERATING BUSINESS SEGMENTS

                    TABLE 31. OCP GROUP: PRODUCT PORTFOLIO

                    TABLE 32. OCP GROUP: SALES BY BUSINESS SEGMENTS (2021-2023)

                    TABLE 33. OCP GROUP: SALES BY GEOGRAPHIC SEGMENTS (2021-2023)

                    TABLE 34. OCP GROUP: KEY STRATERGY

                    TABLE 35. EUROCHEM GROUP: COMPANY SNAPSHOT

                    TABLE 36. EUROCHEM GROUP: OPERATING BUSINESS SEGMENTS

                    TABLE 37. EUROCHEM GROUP: PRODUCT PORTFOLIO

                   TABLE 38. EUROCHEM GROUP: SALES BY BUSINESS SEGMENTS (2021-2023)

                   TABLE 39. EUROCHEM GROUP: SALES BY GEOGRAPHIC SEGMENTS (2021-2023)

                   TABLE 40. EUROCHEM GROUP: KEY STRATERGY

                   TABLE 41. JORDAN PHOSPHATE MINES CO.: COMPANY SNAPSHOT

                   TABLE 42. JORDAN PHOSPHATE MINES CO.: OPERATING BUSINESS SEGMENTS

                   TABLE 43. JORDAN PHOSPHATE MINES CO.: PRODUCT PORTFOLIO

                   TABLE 44. JORDAN PHOSPHATE MINES CO.: SALES BY BUSINESS SEGMENTS (2021-2023)

                   TABLE 45. JORDAN PHOSPHATE MINES CO.: SALES BY GEOGRAPHIC SEGMENTS (2021-2023)

                   TABLE 46. JORDAN PHOSPHATE MINES CO.: KEY STRATERGY

                   TABLE 47. YARA INTERNATIONAL ASA: COMPANY SNAPSHOT

                   TABLE 48. YARA INTERNATIONAL ASA: OPERATING BUSINESS SEGMENTS

                   TABLE 49. YARA INTERNATIONAL ASA: PRODUCT PORTFOLIO

                   TABLE 50. YARA INTERNATIONAL ASA: SALES BY BUSINESS SEGMENTS (2021-2023)

                   TABLE 51. YARA INTERNATIONAL ASA: SALES BY GEOGRAPHIC SEGMENTS (2021-2023)

                   TABLE 52. YARA INTERNATIONAL ASA: KEY STRATERGY

                   TABLE 53. ICL GROUP: COMPANY SNAPSHOT

                   TABLE 54. ICL GROUP: OPERATING BUSINESS SEGMENTS

                   TABLE 55. ICL GROUP: PRODUCT PORTFOLIO

                   TABLE 56. ICL GROUP: SALES BY BUSINESS SEGMENTS (2021-2023)

                   TABLE 57. ICL GROUP: SALES BY GEOGRAPHIC SEGMENTS (2021-2023)

                   TABLE 58. ICL GROUP: KEY STRATERGY

                   TABLE 59. SAUDI ARABIAN MINING COMPANY: COMPANY SNAPSHOT

                   TABLE 60. SAUDI ARABIAN MINING COMPANY: OPERATING BUSINESS SEGMENTS

                   TABLE 61. SAUDI ARABIAN MINING COMPANY: PRODUCT PORTFOLIO

                   TABLE 62. SAUDI ARABIAN MINING COMPANY: SALES BY BUSINESS SEGMENTS (2021-2023)

                   TABLE 63. SAUDI ARABIAN MINING COMPANY: SALES BY GEOGRAPHIC SEGMENTS (2021-2023)

                   TABLE 64. SAUDI ARABIAN MINING COMPANY: KEY STRATERGY

                   TABLE 65. INNOPHOS HOLDINGS INC.: COMPANY SNAPSHOT

                   TABLE 66. INNOPHOS HOLDINGS INC.: OPERATING BUSINESS SEGMENTS

                   TABLE 67. INNOPHOS HOLDINGS INC.: PRODUCT PORTFOLIO

                   TABLE 68. INNOPHOS HOLDINGS INC.: SALES BY BUSINESS SEGMENTS (2021-2023)

                   TABLE 69. INNOPHOS HOLDINGS INC.: SALES BY GEOGRAPHIC SEGMENTS (2021-2023)

                   TABLE 70. INNOPHOS HOLDINGS INC.: KEY STRATERGY

                   TABLE 71. GUIZHOU KAILIN HOLDINGS (GROUP) CO LTD.: COMPANY SNAPSHOT

                   TABLE 72. GUIZHOU KAILIN HOLDINGS (GROUP) CO LTD.: OPERATING BUSINESS SEGMENTS

                   TABLE 73. GUIZHOU KAILIN HOLDINGS (GROUP) CO LTD.: PRODUCT PORTFOLIO

                   TABLE 74. GUIZHOU KAILIN HOLDINGS (GROUP) CO LTD.: SALES BY BUSINESS SEGMENTS (2021-2023)

                   TABLE 75. GUIZHOU KAILIN HOLDINGS (GROUP) CO LTD.: SALES BY GEOGRAPHIC SEGMENTS (2021-2023)

                   TABLE 76. GUIZHOU KAILIN HOLDINGS (GROUP) CO LTD.: KEY STRATERGY

                   TABLE 77. YUNTIANHUA GROUP: COMPANY SNAPSHOT

                   TABLE 78. YUNTIANHUA GROUP: OPERATING BUSINESS SEGMENTS

                   TABLE 79. YUNTIANHUA GROUP: PRODUCT PORTFOLIO

                   TABLE 80. YUNTIANHUA GROUP: SALES BY BUSINESS SEGMENTS (2021-2023)

                   TABLE 81. YUNTIANHUA GROUP: SALES BY GEOGRAPHIC SEGMENTS (2021-2023)

                   TABLE 82. YUNTIANHUA GROUP: KEY STRATERGY

LIST OF FIGURES

FIGURE 1. SECONDARY DATA SOURCES

FIGURE 2. OVERVIEW OF THE SCOPE

FIGURE 3. INDIA EV CHARGING MARKET BY, TYPE OF CHARGER, 2023-2030, MILLION USD

FIGURE 4. INDIA AC CHARGERS MARKET BY, TYPE OF CHARGER, 2023-2030, MILLION USD

FIGURE 5. INDIA DC CHARGERS MARKET BY, TYPE OF CHARGER, 2023-2030, MILLION USD

FIGURE 6. INDIA EV CHARGING MARKET BY, CHARGING SPEED, 2023-2030, MILLION USD

FIGURE 7. INDIA LEVEL 1 MARKET BY, CHARGING SPEED, 2023-2030, MILLION USD

FIGURE 8. INDIA LEVEL 2 MARKET BY, CHARGING SPEED, 2023-2030, MILLION USD

FIGURE 9. INDIA LEVEL 3 MARKET BY, CHARGING SPEED, 2023-2030, MILLION USD

FIGURE 10. INDIA EV CHARGING MARKET BY, VEHICLE TYPE, 2023-2030, MILLION USD

FIGURE 11. INDIA PASSENGER VEHICLES MARKET BY, VEHICLE TYPE, 2023-2030, MILLION USD

FIGURE 12. INDIA ELECTRIC BUSES MARKET BY, VEHICLE TYPE, 2023-2030, MILLION USD

FIGURE 13. INDIA ELECTRIC GOODS CARRIERS MARKET BY, VEHICLE TYPE, 2023-2030, MILLION USD

FIGURE 14. INDIA EV CHARGING MARKET BY, APPLICATION, 2023-2030, MILLION USD

FIGURE 15. INDIA COMMERCIAL APPLICATION MARKET BY, APPLICATION, 2023-2030, MILLION USD

FIGURE 16. INDIA COMMERCIAL PUBLIC EV CHARGING STATIONS MARKET BY, APPLICATION, 2023-2030, MILLION USD

FIGURE 17. INDIA ON-ROAD CHARGING MARKET BY, APPLICATION, 2023-2030, MILLION USD

FIGURE 18. INDIA PARKING FACILITIES MARKET BY, APPLICATION, 2023-2030, MILLION USD

FIGURE 19. INDIA DESTINATION CHARGING MARKET BY, APPLICATION, 2023-2030, MILLION USD

FIGURE 20. INDIA COMMERCIAL PRIVATE EV CHARGING STATIONS MARKET BY, APPLICATION, 2023-2030, MILLION USD

FIGURE 21. INDIA FLEET CHARGING MARKET BY, APPLICATION, 2023-2030, MILLION USD

FIGURE 22. INDIA CAPTIVE CHARGING MARKET BY, APPLICATION, 2023-2030, MILLION USD

 FIGURE 23. INDIA RESIDENTIAL APPLICATION MARKET BY, APPLICATION, 2023-2030, MILLION USD

FIGURE 24. THE MOSAIC COMPANY: NET SALES, (2021-2023)

FIGURE 25. THE MOSAIC COMPANY: PRIMARY MARKET COMPETITORS

FIGURE 26. OCP GROUP: NET SALES, (2021-2023)

FIGURE 27. OCP GROUP: PRIMARY MARKET COMPETITORS

FIGURE 28. EUROCHEM GROUP: NET SALES, (2021-2023)

FIGURE 29. EUROCHEM GROUP: PRIMARY MARKET COMPETITORS

FIGURE 30. JORDAN PHOSPHATE MINES CO.: NET SALES, (2021-2023)

FIGURE 31. JORDAN PHOSPHATE MINES CO.: PRIMARY MARKET COMPETITORS

FIGURE 32. YARA INTERNATIONAL ASA: NET SALES, (2021-2023)

FIGURE 33. YARA INTERNATIONAL ASA: PRIMARY MARKET COMPETITORS

FIGURE 34. ICL GROUP: NET SALES, (2021-2023)

FIGURE 35. ICL GROUP: PRIMARY MARKET COMPETITORS

FIGURE 36. SAUDI ARABIAN MINING COMPANY: NET SALES, (2021-2023)

FIGURE 37. SAUDI ARABIAN MINING COMPANY: PRIMARY MARKET COMPETITORS

FIGURE 38. INNOPHOS HOLDINGS INC.: NET SALES, (2021-2023)

FIGURE 39. INNOPHOS HOLDINGS INC.: PRIMARY MARKET COMPETITORS

FIGURE 40. GUIZHOU KAILIN HOLDINGS (GROUP) CO LTD.: NET SALES, (2021-2023)

FIGURE 41. GUIZHOU KAILIN HOLDINGS (GROUP) CO LTD.: PRIMARY MARKET COMPETITORS

FIGURE 42. YUNTIANHUA GROUP: NET SALES, (2021-2023)

FIGURE 43. YUNTIANHUA GROUP: PRIMARY MARKET COMPETITORS

KEY PLAYERS

  • The Mosaic Company

  • OCP Group

  • EuroChem Group 

  • Jordan Phosphate Mines Co.

  • Yara International ASA

  • ICL Group

  • Saudi Arabian Mining Company

  • Innophos Holdings Inc.

  • Guizhou Kailin Holdings (Group) Co Ltd.

  • Yuntianhua Group


Frequently Asked Questions
What will be the worth of India Electric Vehicle (EV) Charging market by the end of 2030?

According to the report published by the Next Move Consulting, the India Electric Vehicle (EV) Charging market business is expected to hit at $5695.6 million (USD) by 2030.

Who are the prominent players in the Electric Vehicle (EV) Charging market in India?

The India Electric Vehicle (EV) Charging industry includes several market players such as Ather Energy Pvt Ltd, BluSmart Tech Pvt. Ltd., Charge Zone, jio-bp pulse, Kazam EV Tech Private Limited, Sharify Services Private Limited (Statiq), Tata Power, Ujoy Technology Private Limited (Bolt Earth), Bharat Petroleum Corporation Limited, and Hindustan Petroleum Corporation Limited.

What are the study's market divisions and areas of focus within the India Electric Vehicle (EV) Charging industry?

The India Electric Vehicle (EV) Charging market share is segmented on the basis of charging type, charging voltage level, charger type, IOT connectivity, vehicle charging, application, commercial, installation type, and charging standard.

What factors are propelling the expansion of the Electric Vehicle (EV) Charging market in India?

The India Electric Vehicle (EV) Charging market is experiencing growth driven by the government's expanding initiatives and the presence of local EV manufacturer companies.

What is restraining the growth of the Electric Vehicle (EV) Charging market in India?

The primary barrier to the expansion of the Electric Vehicle (EV) Charging market in India is the significant upfront expenses linked to fast charger installations.