Industrial Robotics Market by Type (Articulated, SCARA, Cylindrical, Cartesian/Linear, Parallel and Others), by Application (Material Handling, Assembling, Processing, Welding & Soldering, Pick & Place and Others), by Industry (Automotive, Electrical & Electronic, Healthcare & Pharmaceutical, Food & Beverage, Metal & Machinery, Hospitality and Others) –Global Opportunity Analysis and Industry Forecast 2024-2030

Industrial Robotics Market

Industry:  ICT & Media | Publish Date: Mar 2024 | No of Pages:  459 | No. Tables:  382 | No. Figures:  358

Market Definition

The Industrial Robotics Market size was valued at USD 40.61 billion in 2023 and is predicted to reach USD 90.35 billion by 2030 with a CAGR of 12.10% from 2024-2030. Industrial Robotics are defined as mechanical machines that is designed to perform various industrial related tasks that includes material handling, processing, assembling, pick and place items, and other industrial use. The advantage of industrial Robotics lie in its flexibility and automation as it can be reprogrammed for performing varying robotic application. Industrial Robotics contains an articulated frame of sensors, controllers and actuators that help in doubling up enhancement of industrial efficiency. The application of industrial Robotics have fastened the production process, enhanced safety and reduced industrial cost. The efficiency and flexible automatic feature of the industrial Robotics makes it an indispensable component of the modern industrial age. 

Market Dynamics and Trends

The rising adoption of industry 4.0, followed by integration of digital technology and automation in manufacturing processes is driving the demand of industrial robot market. According to UNCTAD Report, 2022, for high tech manufacturing and research and development are critical element of industry 4.0 where the U.S. and China collectively account for 75% of the global spending on the Internet of Things (IoT). Industrial robot help in interconnectedness of machines, real time data analytics and autonomation as they are vital elements of industry 4.0 accelerating its demand in the market.

Additionally, the significant growth of the automotive industry is accelerating the demand for industrial robot. According to the European Automobile Manufacturer Association, 2023, every year around 13.1 million automobiles is manufactured that contributes to around 7% to the total GDP of EU. Automotive manufacturing involves high-volume production lines with repetitive tasks such as welding, painting, assembly, and material handling. It accelerates the demand for industrial robots by offering high-speed and precise operation, that helps automotive industry to meet the production targets efficiently. 

For instance, in June, 2023, Guy’s and St Thomas’ become the first Trust in the UK to adopt the newest surgical robot that includes the Hugo robotic-assisted surgery (RAS) system. Robotic assisted surgery involve minimal invasive leading to patients’ spending less time in hospital and faster recovery boosting up the demand of industrial robot market.

Moreover, the rising demand of autonomation in food & beverage industry is further accelerating the market demand of industrial robot. The manufacturers are increasingly turning to automation solutions through use of industrial robot to streamline production processes, improve efficiency, and ensure product quality and safety leading to its increasing demand in food & beverage industry. In April, 2023, Doosan Robotics launched NSF certified line of cobots that are specifically created for food & beverage industry. The light weight and slim design of the E- series robot can be easily installed in workspaces of Food & Beverage Industry.

However, the high expense associated with installation of industrial Robotics along with requirement of expertise training and efficiency in operating the Robotics acts as major constraints in growth generation of the market. 
On the other hand, the integration of AI and machine learning algorithm in industrial robot is expected to generate significant growth opportunities for the market in the forthcoming years. AI and machine learning algorithm would make Robotics learn from their experiences and automatically adapt to change environment by taking autonomous decisions. 


Market Segmentation

The industrial Robotics market is segmented on the basis of type, application, industry, end use and region. On  the basis of type the market is divided into articulated, SCARA, cylindrical, cartesian/linear, parallel and other. On the basis of application, the market is bifurcated into material handling, assembling, processing, welding and soldering, pick and place and others. On the basis of industry, the market is divided into automotive, electrical and electronic, healthcare and pharmaceutical, food and beverage, hospitality, metal & machinery and others. Regional breakdown and analysis of each of the aforesaid segments include regions comprising North America, Europe, Asia-Pacific, and RoW.


Geographical Analysis

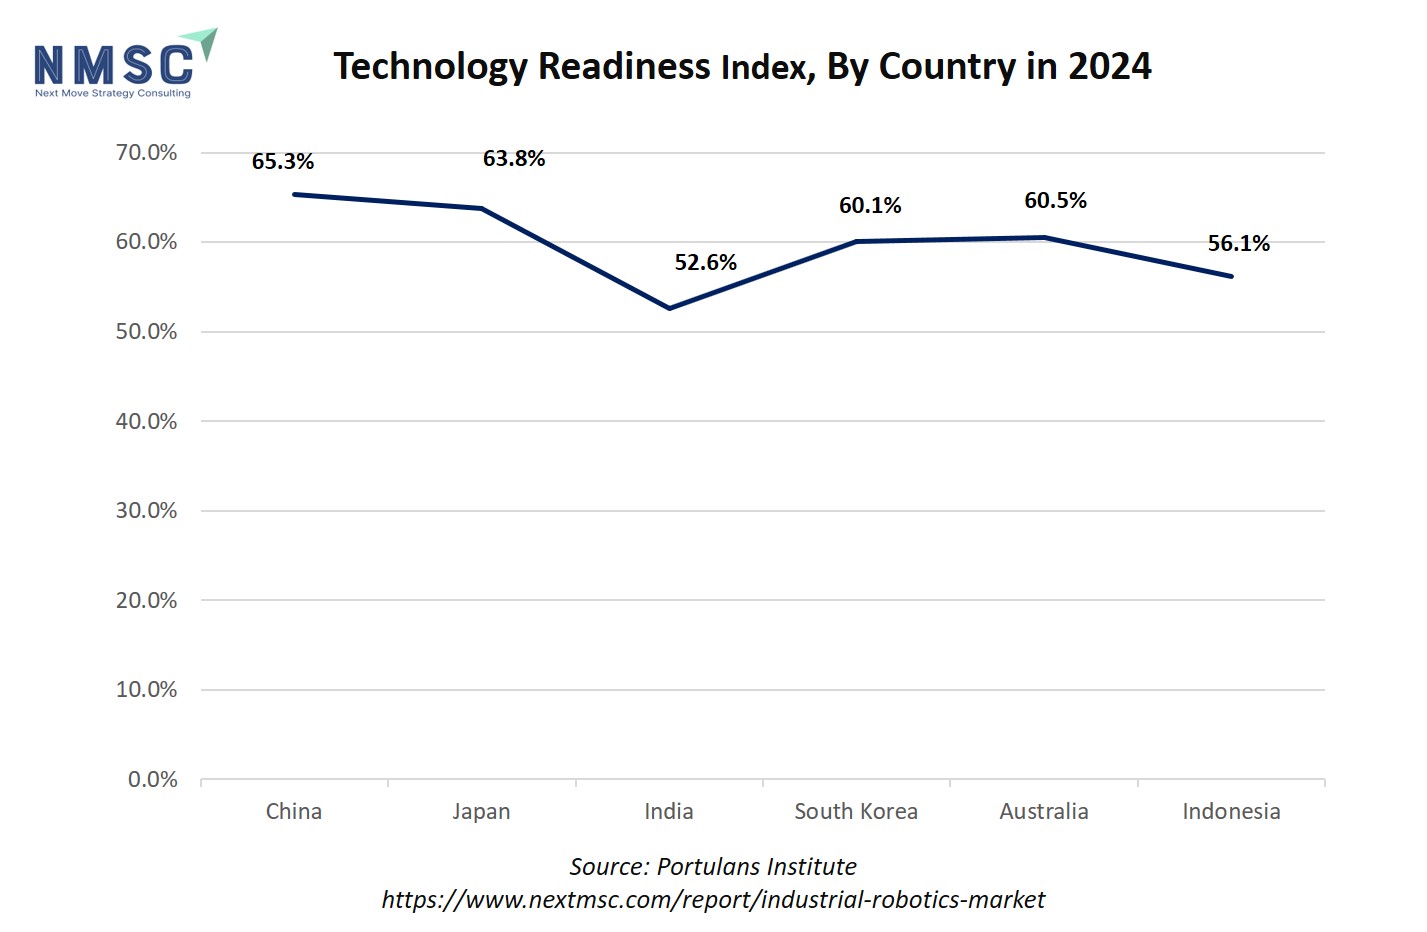
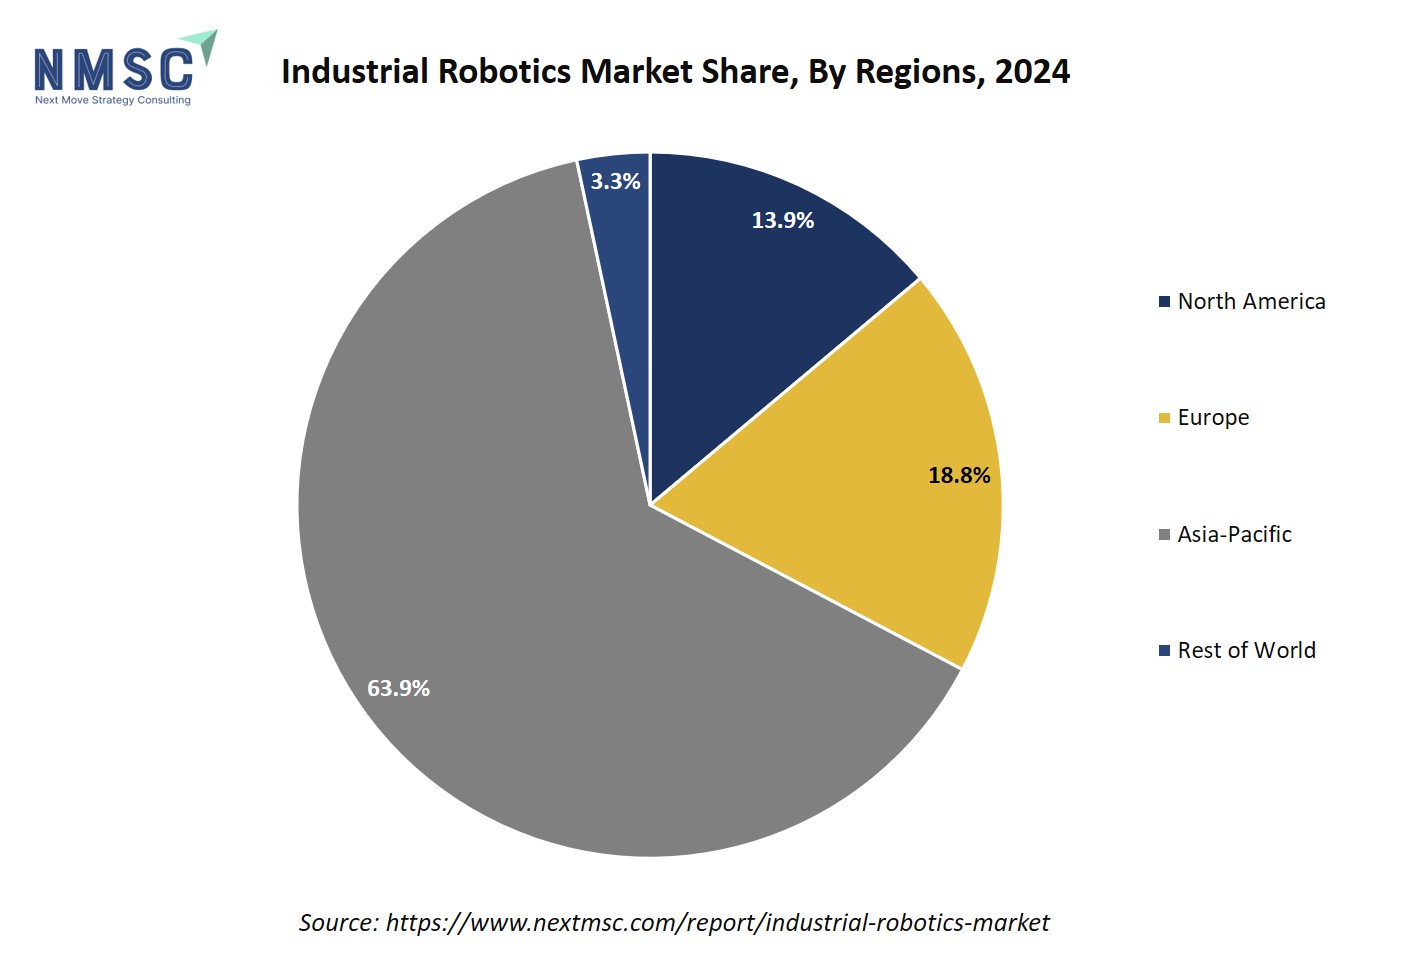
Asia Pacific holds the dominant share in the industrial Robotics market and is projected to maintain its dominance throughout the forecast period. The leading countries of the region such as Japan, China, South Korea and India are at forefront of adoption of industrial robot in various sectors of the economy that includes healthcare, food & beverage, transportation and others. According to the Information Technology and Innovation Foundation Report of March, 2024 depicts that China is the leading market of industrial Robotics by volume. China had installed 18% more industrial Robotics per manufacturing workers. Around 52% industrial Robotics of the world are installed in China reflecting about the increasing adoption of industrial Robotics in manufacturing sector. Features of industrial robot that includes automation, quick performance and minimizing error capacity is increasing its adaptability in the market.

Moreover, the rising government initiatives such as tax benefits and incentives for adoption of robotics in industries in the region is accelerating the demand of industrial Robotics market. The tax benefit provided by the government doubled up the installation of industrial Robotics in various industrial sectors in Asia Pacific region. According to the International Federation of Robotics report as of January 2023, the Japanese government invested USD 930.5 million under the "New Robot Strategy" to position the country as the world's leading hub for robot innovation. This kind of governmental benefits make it more affordable for businesses to invest in robotic systems, boosting its demand in the region.

On the other hand, the European region is expected to show a steady rise in the industrial Robotics market driven by the hospitality industry's focus on personalizing the guest experience. With hospitality being a significant sector of the European economy, establishments such as hotels and restaurants are increasingly leveraging industrial Robotics to enhance customer service and satisfaction. These Robotics are deployed for various tasks, including guest interactions, room service delivery, and housekeeping, providing a unique and tailored experience to guests. For instance, in 2023 Spark EPOS launched its first hotel robot in UK that is first of its kind. The Butler BotW3 is designed to assist with various tasks such as room service delivery, concierge services, and housekeeping, thereby revolutionizing the way hotels operate and enhancing customer satisfaction.

Moreover, the growing adoption of stringent regulations aimed at improving workplace safety and reducing labour costs are incentivizing companies operating in the countries of European region to invest in robotic solutions accelerating its market demand.  In June 2021, the European Commission adopted the EU strategic framework on health and safety at work 2021-2027 to adopt key actions needed to improve workers' health and safety. Industrial Robotics can perform tasks in hazardous environments or handle dangerous materials, reducing the risk of injuries to human workers that leads to its increasing demand among the industries to ensure workplace safety of the workers in the region.


Competitive Landscape

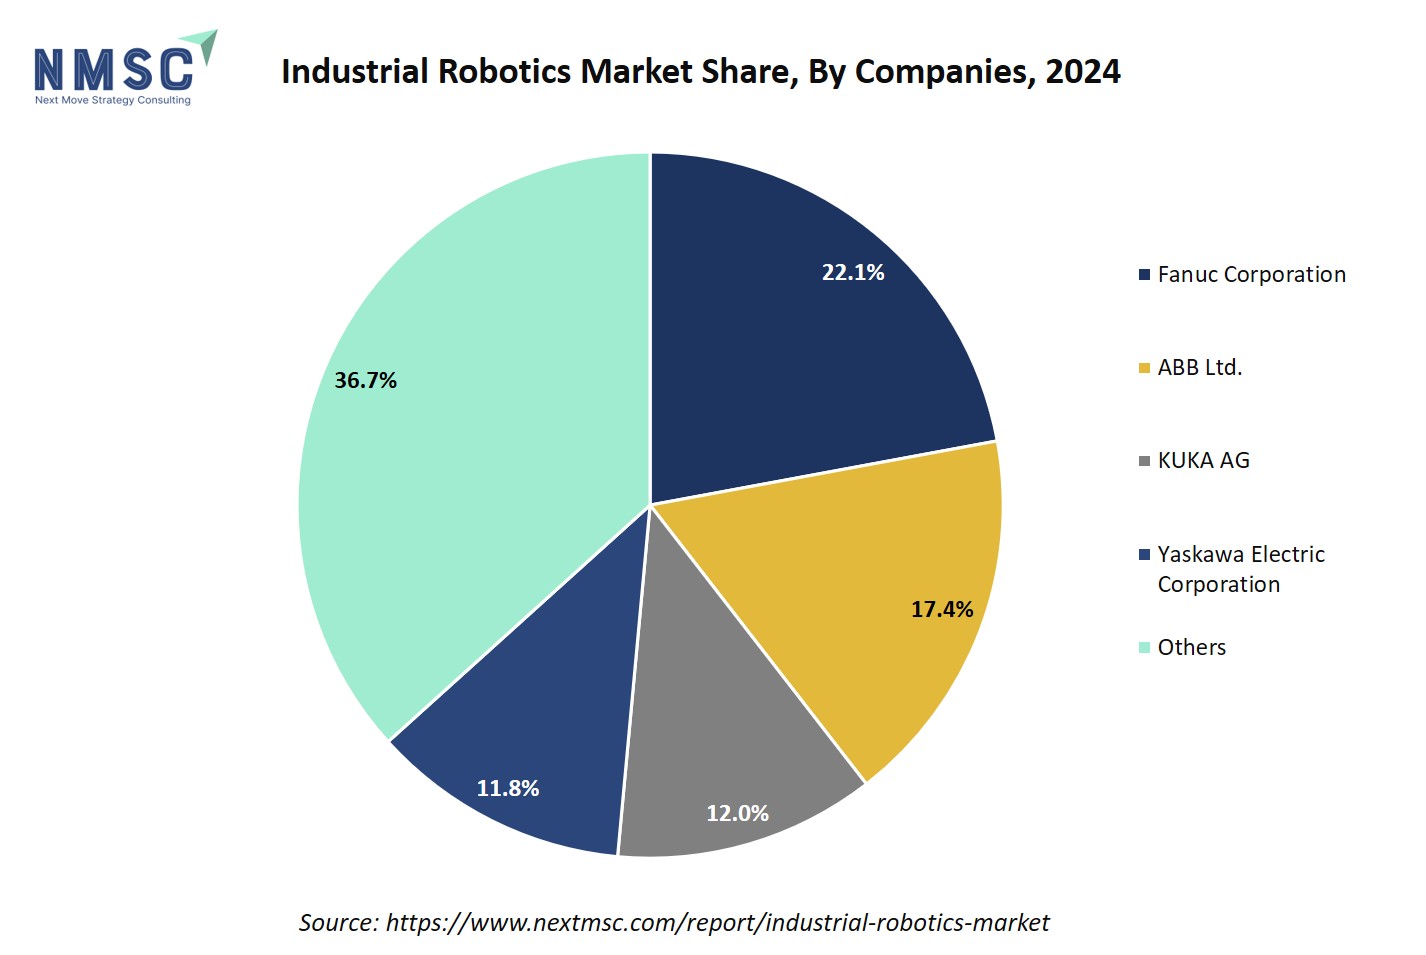
The industrial Robotics industry comprising of various market players such as ABB Ltd., Yaskawa Electric Corporation, Mitsubishi Electric Corporation, Nachi-Fujikoshi Corp., Comau Automation Company, KUKA Robotics Company, Fanuc Corporation, Denso Corporation, Kawasaki Heavy Industries, Ltd. and Omron Corporation. These market players are adopting various strategies including product launches and business expansions to stay competitive and maintain their market positions.

For instance, in September, 2023, ABB launched OptiFact software platform and IRB1090 industrial education robot making it a global launch in CIFF, 2023. The Opti Fact software platform launched by ABB Ltd. aid business organization to collect and analyse data directly factory floor to enhance decision making and performance. The new IRB 1090 educational robot equipped the next generation by making them aware about new skills to thrive in the field of automation.

Moreover, in September, 2023, Fanuc Corporation announced the expansion of its business in Oakland that is scheduled to be open in spring of 2024. The opening of the new west campus would increase its operation space to 2 million sq. ft. would enhance its operation and would increase the collaboration of Fanuc Corporation with other industrial sector such as food & beverage, aerospace, electrical, medical and others.

KEY BENEFITS

  • The report provides quantitative analysis and estimations of the industrial Robotics market from 2024 to 2030, which assists in identifying the prevailing market opportunities.

  • The study comprises a deep dive analysis of the industrial Robotics market including the current and future trends to depict prevalent investment pockets in the market.

  • Information related to key drivers, restraints, and opportunities and their impact on the industrial Robotics market is provided in the report. 

  • Competitive analysis of the players, along with their market share is provided in the report.

  • SWOT analysis and Porters Five Forces model is elaborated in the study.

  • Value chain analysis in the market study provides a clear picture of roles of stakeholders.

KEY MARKET SEGMENTS

By Type 

  • Articulated

  • SCARA

  • Cylindrical

  • Cartesian/Linear

  • Parallel and other

By Application 

  • Material Handling

  • Assembling

  • Processing

  • Welding and Soldering

  • Pick and Place and others

By Industry 

  • Automotive

  • Electrical & Electronic

  • Healthcare & Pharmaceutical

  • Food & Beverage

  • Metal and Machinery

  • Hospitality and others

By Region

  • North America

    • The U.S.

    • Canada

    • Mexico

  • Europe

    • The UK

    • Germany

    • France        

    • Italy        

    • Spain        

    • Denmark        

    • Netherlands        

    • Finland        

    • Sweden        

    • Norway        

    • Russia        

    • Rest of Europe    

  • Asia Pacific

    • China

    • Japan

    • India

    • South Korea

    • Australia

    • Indonesia

    • Singapore

    • Taiwan

    • Thailand

    • Rest of Asia Pacific

  • RoW

    • Latin America

    • Middle East

    • Africa

REPORT SCOPE AND SEGMENTATION:

Parameters

Details

Market Size in 2023

USD 40.61 Billion

Revenue Forecast in 2030

USD 90.35 Billion

Growth Rate

CAGR of 12.10% from 2024 to 2030

Analysis Period

2023–2030

Base Year Considered

2023

Forecast Period

2024–2030

Market Size Estimation

Billion (USD)

Growth Factors

  • Rising adoption of industry 4.0 fuels the market.

  • Growing trend of automation in performing surgery within the healthcare boosts the market growth.

  • The rising demand of autonomation in food & beverage industry drivers the market.

Countries Covered

28

Companies Profiled

10

Market Share

Available for 10 companies

Customization Scope

Free customization (equivalent up to 80 working hours of analysts) after purchase. Addition or alteration to country, regional, and segment scope.

Pricing and Purchase Options

Avail customized purchase options to meet your exact research needs.

column chart pie chart

Test

1.... INTRODUCTION

1.1.           REPORT DESCRIPTION

1.2.           Who should read this report?

1.3.           KEY MARKET SEGMENTS

1.4.           Key Market Players

1.5.           Research Methodology

1.5.1             Secondary Research

1.5.2             Data Analysis Framework

1.5.3             Market size estimation

1.5.4             Forecasting

1.5.5             Primary Research and Data Validation

2.... Industrial Robotics Market – Executive Summary

2.1.           Market Snapshot, 2021 - 2030, Million USD

3.... MARKET OVERVIEW

3.1.           MARKET DEFINITION AND SCOPE

3.2.           MARKET DYNAMICS

3.2.1             Drivers

3.2.1.1        Rise in demand for industrial robots from manufacturing and electronics sectors

3.2.1.2        Lucrative benefits of industrial robots

3.2.1.3        Upsurge in investments across the industrial automation

3.2.2             Restraints

3.2.2.1        High initial investment and maintenance cost along with the compatibility issues

3.2.3             opportunities

3.2.3.1        Emergence of Industry 4.0

3.2.3.2        investment in research and innovation activities in robotics

4.... Covid-19 Impact Analysis

4.1.           Impact on market size

4.2.           KEY PLAYER STRATEGIES TO TACKLE COVID-19’S INFLUENCE ON MARKET

5.... Market Share ANALYSIS

5.1.           Market share analysis of top 10 Industrial Robotics Market Providers, 2021

6.... Global Industrial Robotics Market, By Type

6.1.           Overview

6.2.           SCARA Modular Robots

6.2.1             SCARA Modular Robots Market, By Region

6.2.1.1        North America SCARA Modular Robots Market, By Country

6.2.1.2        Europe SCARA Modular Robots Market, By Country

6.2.1.3        Asia-Pacific SCARA Modular Robots Market, By Country

6.2.1.4        Rest of the World SCARA Modular Robots Market, By Country

6.3.           Articulated Modular Robots

6.3.1             Articulated Modular Robots Market, By Region

6.3.1.1        North America Articulated Modular Robots Market, By Country

6.3.1.2        Europe Articulated Modular Robots Market, By Country

6.3.1.3        Asia-Pacific Articulated Modular Robots Market, By Country

6.3.1.4        Rest of the World Articulated Modular Robots Market, By Country

6.4.           Collaborative Modular Robots

6.4.1             Collaborative Modular Robots Market, By Region

6.4.1.1        North America Collaborative Modular Robots Market, By Country

6.4.1.2        Europe Collaborative Modular Robots Market, By Country

6.4.1.3        Asia-Pacific Collaborative Modular Robots Market, By Country

6.4.1.4        Rest of the World Collaborative Modular Robots Market, By Country

6.5.           Cartesian Modular Robots

6.5.1             Cartesian Modular Robots Market, By Region

6.5.1.1        North America Cartesian Modular Robots Market, By Country

6.5.1.2        Europe Cartesian Modular Robots Market, By Country

6.5.1.3        Asia-Pacific Cartesian Modular Robots Market, By Country

6.5.1.4        Rest of the World Cartesian Modular Robots Market, By Country

6.6.           Parallel Modular Robots

6.6.1             Parallel Modular Robots Market, By Region

6.6.1.1        North America Parallel Modular Robots Market, By Country

6.6.1.2        Europe Parallel Modular Robots Market, By Country

6.6.1.3        Asia-Pacific Parallel Modular Robots Market, By Country

6.6.1.4        Rest of the World Parallel Modular Robots Market, By Country

6.7.           Others (Spherical and Cylindrical)

6.7.1             Others (Spherical and Cylindrical) Market, By Region

6.7.1.1        North America Others (Spherical and Cylindrical) Market, By Country

6.7.1.2        Europe Others (Spherical and Cylindrical) Market, By Country

6.7.1.3        Asia-Pacific Others (Spherical and Cylindrical) Market, By Country

6.7.1.4        Rest of the World Others (Spherical and Cylindrical) Market, By Country

7.... Global Industrial Robotics Market, By Mobility

7.1.           Overview

7.2.           Fixed Robots

7.2.1             Fixed Robots Market, By Region

7.2.1.1        North America Fixed Robots Market, By Country

7.2.1.2        Europe Fixed Robots Market, By Country

7.2.1.3        Asia-Pacific Fixed Robots Market, By Country

7.2.1.4        Rest of the World Fixed Robots Market, By Country

7.3.           Mobile Robots

7.3.1             Mobile Robots Market, By Region

7.3.1.1        North America Mobile Robots Market, By Country

7.3.1.2        Europe Mobile Robots Market, By Country

7.3.1.3        Asia-Pacific Mobile Robots Market, By Country

7.3.1.4        Rest of the World Mobile Robots Market, By Country

8.... Global Industrial Robotics Market, By End User

8.1.           Overview

8.2.           Logistics

8.2.1             Logistics Market, By Region

8.2.1.1        North America Logistics Market, By Country

8.2.1.2        Europe Logistics Market, By Country

8.2.1.3        Asia-Pacific Logistics Market, By Country

8.2.1.4        Rest of the World Logistics Market, By Country

8.3.           Aerospace & Defense

8.3.1             Aerospace & Defense Market, By Region

8.3.1.1        North America Aerospace & Defense Market, By Country

8.3.1.2        Europe Aerospace & Defense Market, By Country

8.3.1.3        Asia-Pacific Aerospace & Defense Market, By Country

8.3.1.4        Rest of the World Aerospace & Defense Market, By Country

8.4.           Healthcare

8.4.1             Healthcare Market, By Region

8.4.1.1        North America Healthcare Market, By Country

8.4.1.2        Europe Healthcare Market, By Country

8.4.1.3        Asia-Pacific Healthcare Market, By Country

8.4.1.4        Rest of the World Healthcare Market, By Country

8.5.           Food & Beverages

8.5.1             Food & Beverages Market, By Region

8.5.1.1        North America Food & Beverages Market, By Country

8.5.1.2        Europe Food & Beverages Market, By Country

8.5.1.3        Asia-Pacific Food & Beverages Market, By Country

8.5.1.4        Rest of the World Food & Beverages Market, By Country

8.6.           Automotive & Transportation

8.6.1             Automotive & Transportation Market, By Region

8.6.1.1        North America Automotive & Transportation Market, By Country

8.6.1.2        Europe Automotive & Transportation Market, By Country

8.6.1.3        Asia-Pacific Automotive & Transportation Market, By Country

8.6.1.4        Rest of the World Automotive & Transportation Market, By Country

8.7.           Manufacturing

8.7.1             Manufacturing Market, By Region

8.7.1.1        North America Manufacturing Market, By Country

8.7.1.2        Europe Manufacturing Market, By Country

8.7.1.3        Asia-Pacific Manufacturing Market, By Country

8.7.1.4        Rest of the World Manufacturing Market, By Country

8.8.           Media & Entertainment

8.8.1             Media & Entertainment Market, By Region

8.8.1.1        North America Media & Entertainment Market, By Country

8.8.1.2        Europe Media & Entertainment Market, By Country

8.8.1.3        Asia-Pacific Media & Entertainment Market, By Country

8.8.1.4        Rest of the World Media & Entertainment Market, By Country

8.9.           Others

8.9.1             Others Market, By Region

8.9.1.1        North America Others Market, By Country

8.9.1.2        Europe Others Market, By Country

8.9.1.3        Asia-Pacific Others Market, By Country

8.9.1.4        Rest of the World Others Market, By Country

9.... Global Industrial Robotics Market, By Region

9.1.           Overview

9.2.           North America

9.2.1             North America Industrial Robotics Market, By Type

9.2.2             North America Industrial Robotics Market, By Mobility

9.2.3             North America Industrial Robotics Market, By End User

9.2.4             North America Industrial Robotics Market, By Country

9.2.4.1        U.S.

9.2.4.1.1        U.S. Industrial Robotics Market, By Type

9.2.4.1.2        U.S. Industrial Robotics Market, By Mobility

9.2.4.1.3        U.S. Industrial Robotics Market, By End User

9.2.4.2        Canada

9.2.4.2.1        Canada Industrial Robotics Market, By Type

9.2.4.2.2        Canada Industrial Robotics Market, By Mobility

9.2.4.2.3        Canada Industrial Robotics Market, By End User

9.2.4.3        Mexico

9.2.4.3.1        Mexico Industrial Robotics Market, By Type

9.2.4.3.2        Mexico Industrial Robotics Market, By Mobility

9.2.4.3.3        Mexico Industrial Robotics Market, By End User

9.3.           Europe

9.3.1             Europe Industrial Robotics Market, By Type

9.3.2             Europe Industrial Robotics Market, By Mobility

9.3.3             Europe Industrial Robotics Market, By End User

9.3.4             Europe Industrial Robotics Market, By Country

9.3.4.1        UK

9.3.4.1.1        UK Industrial Robotics Market, By Type

9.3.4.1.2        UK Industrial Robotics Market, By Mobility

9.3.4.1.3        UK Industrial Robotics Market, By End User

9.3.4.2        Germany

9.3.4.2.1        Germany Industrial Robotics Market, By Type

9.3.4.2.2        Germany Industrial Robotics Market, By Mobility

9.3.4.2.3        Germany Industrial Robotics Market, By End User

9.3.4.3        France

9.3.4.3.1        France Industrial Robotics Market, By Type

9.3.4.3.2        France Industrial Robotics Market, By Mobility

9.3.4.3.3        France Industrial Robotics Market, By End User

9.3.4.4        Spain

9.3.4.4.1        Spain Industrial Robotics Market, By Type

9.3.4.4.2        Spain Industrial Robotics Market, By Mobility

9.3.4.4.3        Spain Industrial Robotics Market, By End User

9.3.4.5        Italy

9.3.4.5.1        Italy Industrial Robotics Market, By Type

9.3.4.5.2        Italy Industrial Robotics Market, By Mobility

9.3.4.5.3        Italy Industrial Robotics Market, By End User

9.3.4.6        Netherlands

9.3.4.6.1        Netherlands Industrial Robotics Market, By Type

9.3.4.6.2        Netherlands Industrial Robotics Market, By Mobility

9.3.4.6.3        Netherlands Industrial Robotics Market, By End User

9.3.4.7        Rest of Europe

9.3.4.7.1        Rest of Europe Industrial Robotics Market, By Type

9.3.4.7.2        Rest of Europe Industrial Robotics Market, By Mobility

9.3.4.7.3        Rest of Europe Industrial Robotics Market, By End User

9.4.           Asia-Pacific

9.4.1             Asia-Pacific Industrial Robotics Market, By Type

9.4.2             Asia-Pacific Industrial Robotics Market, By Mobility

9.4.3             Asia-Pacific Industrial Robotics Market, By End User

9.4.4             Asia-Pacific Industrial Robotics Market, By Country

9.4.4.1        China

9.4.4.1.1        China Industrial Robotics Market, By Type

9.4.4.1.2        China Industrial Robotics Market, By Mobility

9.4.4.1.3        China Industrial Robotics Market, By End User

9.4.4.2        Japan

9.4.4.2.1        Japan Industrial Robotics Market, By Type

9.4.4.2.2        Japan Industrial Robotics Market, By Mobility

9.4.4.2.3        Japan Industrial Robotics Market, By End User

9.4.4.3        India

9.4.4.3.1        India Industrial Robotics Market, By Type

9.4.4.3.2        India Industrial Robotics Market, By Mobility

9.4.4.3.3        India Industrial Robotics Market, By End User

9.4.4.4        Australia

9.4.4.4.1        Australia Industrial Robotics Market, By Type

9.4.4.4.2        Australia Industrial Robotics Market, By Mobility

9.4.4.4.3        Australia Industrial Robotics Market, By End User

9.4.4.5        South Korea

9.4.4.5.1        South Korea Industrial Robotics Market, By Type

9.4.4.5.2        South Korea Industrial Robotics Market, By Mobility

9.4.4.5.3        South Korea Industrial Robotics Market, By End User

9.4.4.6        Taiwan

9.4.4.6.1        Taiwan Industrial Robotics Market, By Type

9.4.4.6.2        Taiwan Industrial Robotics Market, By Mobility

9.4.4.6.3        Taiwan Industrial Robotics Market, By End User

9.4.4.7        Vietnam

9.4.4.7.1        Vietnam Industrial Robotics Market, By Type

9.4.4.7.2        Vietnam Industrial Robotics Market, By Mobility

9.4.4.7.3        Vietnam Industrial Robotics Market, By End User

9.4.4.8        Rest of Asia-Pacific

9.4.4.8.1        Rest of Asia-Pacific Industrial Robotics Market, By Type

9.4.4.8.2        Rest of Asia-Pacific Industrial Robotics Market, By Mobility

9.4.4.8.3        Rest of Asia-Pacific Industrial Robotics Market, By End User

9.5.           Rest of the World

9.5.1             Rest of the World Industrial Robotics Market, By Type

9.5.2             Rest of the World Industrial Robotics Market, By Mobility

9.5.3             Rest of the World Industrial Robotics Market, By End User

9.5.4             Rest of the World Industrial Robotics Market, By Country

9.5.4.1        Latin America

9.5.4.1.1        Latin America Industrial Robotics Market, By Type

9.5.4.1.2        Latin America Industrial Robotics Market, By Mobility

9.5.4.1.3        Latin America Industrial Robotics Market, By End User

9.5.4.2        Middle East

9.5.4.2.1        Middle East Industrial Robotics Market, By Type

9.5.4.2.2        Middle East Industrial Robotics Market, By Mobility

9.5.4.2.3        Middle East Industrial Robotics Market, By End User

9.5.4.3        Africa

9.5.4.3.1        Africa Industrial Robotics Market, By Type

9.5.4.3.2        Africa Industrial Robotics Market, By Mobility

9.5.4.3.3        Africa Industrial Robotics Market, By End User

10.. COMPANY PROFILES

10.1.         ABB

10.1.1           Company overview

10.1.2           Company snapshot

10.1.3           Operating business segments

10.1.4           Product Portfolio

10.1.5           Business performance

10.1.6           Sales by Business segment

10.1.7           Sales by Geographic segment

10.1.8           Key strategic moves & developments

10.1.9           Primary Market Competitors

10.2.         KUKA AG

10.2.1           Company overview

10.2.2           Company snapshot

10.2.3           Operating business segments

10.2.4           Product Portfolio

10.2.5           Business performance

10.2.6           Sales by Business segment

10.2.7           Sales by Geographic segment

10.2.8           Key strategic moves & developments

10.2.9           Primary Market Competitors

10.4.         Fanuc

10.4.1           Company overview

10.4.2           Company snapshot

10.4.3           Operating business segments

10.4.4           Product Portfolio

10.4.5           Business performance

10.4.6           Sales by Business segment

10.4.7           Sales by Geographic segment

10.4.8           Key strategic moves & developments

10.4.9           Primary Market Competitors

10.5.         Yaskawa Electric Corporation

10.5.1           Company overview

10.5.2           Company snapshot

10.5.3           Operating business segments

10.5.4           Product Portfolio

10.5.5           Business performance

10.5.6           Sales by Business segment

10.5.7           Sales by Geographic segment

10.5.8           Key strategic moves & developments

10.5.9           Primary Market Competitors

10.6.         DENSO Robotics

10.6.1           Company overview

10.6.2           Company snapshot

10.6.3           Product Portfolio

10.6.4           Business performance

10.6.5           Sales by Business segment

10.6.6           Sales by Geographic segment

10.6.7           Key strategic moves & developments

10.6.8           Primary Market Competitors

10.7.         Universal Robots

10.7.1           Company overview

10.7.2           Company snapshot

10.7.3           Product Portfolio

10.7.4           Key strategic moves & developments

10.7.5           Primary Market Competitors

10.8.         NACHI-FUJIKOSHI CORP.

10.8.1           Company overview

10.8.2           Company snapshot

10.8.3           Operating business segments

10.8.4           Product Portfolio

10.8.5           Business performance

10.8.6           Sales by Business segment

10.8.7           Sales by Geographic segment

10.8.8           Key strategic moves & developments

10.8.9           Primary Market Competitors

10.9.         OMRON CORPORATION

10.9.1           Company overview

10.9.2           Company snapshot

10.9.3           Operating business segments

10.9.4           Product Portfolio

10.9.5           Business performance

10.9.6           Sales by Business segment

10.9.7           Sales by Geographic segment

10.9.8           Key strategic moves & developments

10.9.9           Primary Market Competitors

10.10.       Rethink Robotics GmbH

10.10.1         Company overview

10.10.2         Company snapshot

10.10.3         Product Portfolio

10.10.4         Key strategic moves & developments

10.10.5         Primary Market Competitors

10.11.       Kawasaki Heavy Industries Ltd.

10.11.1         Company overview

10.11.2         Company snapshot

10.11.3         Operating business segments

10.11.4         Product Portfolio

10.11.5         Business performance

10.11.6         Sales by Business segment

10.11.7         Sales by Geographic segment

10.11.8         Key strategic moves & developments

10.11.9         Primary Market Competitors

10.12.       KRONES AG

10.12.1         Company overview

10.12.2         Company snapshot

10.12.3         Product Portfolio

10.12.4         Business performance

10.12.5         Sales by Business segment

10.12.6         KRONES AG: SALES BY BUSINESS SEGMENT

10.12.7         Sales by Geographic segment

10.12.8         Key strategic moves & developments

10.12.9         Primary Market Competitors

10.13.       MITSUBISHI ELECTRIC CORP.

10.13.1         Company overview

10.13.2         Company snapshot

10.13.3         Operating business segments

10.13.4         Product Portfolio

10.13.5         Business performance

10.13.6         Sales by Business segment

10.13.7         MITSUBISHI ELECTRIC CORP.: SALES BY BUSINESS SEGMENT

10.13.8         Sales by Geographic segment

10.13.9         MITSUBISHI ELECTRIC CORP.: SALES BY GEOGRAPHIC SEGMENT

10.13.10      Key strategic moves & developments

10.13.11      Primary Market Competitors

10.14.       BRENTON LLC

10.14.1         Company overview

10.14.2         Company snapshot

10.14.3         Product Portfolio

10.14.4         Key strategic moves & developments

10.14.5         Primary Market Competitors

10.15.       Doosan Robotics Inc.

10.15.1         Company overview

10.15.2         Company snapshot

10.15.3         Product Portfolio

10.15.4         Key strategic moves & developments

10.15.5         Primary Market Competitors

10.16.       Panasonic Corporation

10.16.1         Company overview

10.16.2         Company snapshot

10.16.3         Operating business segments

10.16.4         Product Portfolio

10.16.5         Business performance

10.16.6         Sales by Business segment

10.16.7         Sales by Geographic segment

10.16.8         Key strategic moves & developments

10.16.9         Primary Market Competitors

10.17.       Comau S.p.A.

10.17.1         Company overview

10.17.2         Company snapshot

10.17.3         Product Portfolio

10.17.4         Key strategic moves & developments

10.17.5         Primary Market Competitors

10.18.       TECHMAN ROBOT INC.

10.18.1         Company overview

10.18.2         Company snapshot

10.18.3         Product Portfolio

10.18.4         Key strategic moves & developments

10.18.5         Primary Market Competitors

10.19.       Schneider Electric S.E.

10.19.1         Company overview

10.19.2         Company snapshot

10.19.3         Product Portfolio

10.19.4         Business performance

10.19.5         Sales by Business segment

10.19.6         SCHNEIDER ELECTRIC S.E.: SALES BY BUSINESS SEGMENT

10.19.7         Sales by Geographic segment

10.19.8         SCHNEIDER ELECTRIC S.E.: SALES BY GEOGRAPHIC SEGMENT

10.19.9         Key strategic moves & developments

10.19.10      Primary Market Competitors

10.20.       Precise Automation

10.20.1         Company overview

10.20.2         Company snapshot

10.20.3         Product Portfolio

10.20.4         Key strategic moves & developments

10.20.5         Primary Market Competitors

LIST OF TABLES

TABLE 1.       Global Industrial Robotics Market Value, By Type, 2021-2030, Million USD

TABLE 2.       Global Industrial Robotics Market Volume, By Type, 2021-2030, Thousand Units

TABLE 3.       SCARA Modular Robots Market Value, By Region, 2021-2030, Million USD

TABLE 4.       SCARA Modular Robots Market Volume, By Region, 2021-2030, Thousand Units

TABLE 5.       North America SCARA Modular Robots Market Value, By Country, 2021-2030, Million USD

TABLE 6.       North America SCARA Modular Robots Market Volume, By Country, 2021-2030, Thousand Units

TABLE 7.       Europe SCARA Modular Robots Market Value, By Country, 2021-2030, Million USD

TABLE 8.       Europe SCARA Modular Robots Market Volume, By Country, 2021-2030, Thousand Units

TABLE 9.       Asia-Pacific SCARA Modular Robots Market Value, By Country, 2021-2030, Million USD

TABLE 10.    Asia-Pacific SCARA Modular Robots Market Volume, By Country, 2021-2030, Thousand Units

TABLE 11.    Rest of the World SCARA Modular Robots Market Value, By Country, 2021-2030, Million USD

TABLE 12.    Rest of the World SCARA Modular Robots Market Volume, By Country, 2021-2030, Thousand Units

TABLE 13.    Articulated Modular Robots Market Value, By Region, 2021-2030, Million USD

TABLE 14.    Articulated Modular Robots Market Volume, By Region, 2021-2030, Thousand Units

TABLE 15.    North America Articulated Modular Robots Market Value, By Country, 2021-2030, Million USD

TABLE 16.    North America Articulated Modular Robots Market Volume, By Country, 2021-2030, Thousand Units

TABLE 17.    Europe Articulated Modular Robots Market Value, By Country, 2021-2030, Million USD

TABLE 18.    Europe Articulated Modular Robots Market Volume, By Country, 2021-2030, Thousand Units

TABLE 19.    Asia-Pacific Articulated Modular Robots Market Value, By Country, 2021-2030, Million USD

TABLE 20.    Asia-Pacific Articulated Modular Robots Market Volume, By Country, 2021-2030, Thousand Units

TABLE 21.    Rest of the World Articulated Modular Robots Market Value, By Country, 2021-2030, Million USD

TABLE 22.    Rest of the World Articulated Modular Robots Market Volume, By Country, 2021-2030, Thousand Units

TABLE 23.    Collaborative Modular Robots Market Value, By Region, 2021-2030, Million USD

TABLE 24.    Collaborative Modular Robots Market Volume, By Region, 2021-2030, Thousand Units

TABLE 25.    North America Collaborative Modular Robots Market Value, By Country, 2021-2030, Million USD

TABLE 26.    North America Collaborative Modular Robots Market Volume, By Country, 2021-2030, Thousand Units

TABLE 27.    Europe Collaborative Modular Robots Market Value, By Country, 2021-2030, Million USD

TABLE 28.    Europe Collaborative Modular Robots Market Volume, By Country, 2021-2030, Thousand Units

TABLE 29.    Asia-Pacific Collaborative Modular Robots Market Value, By Country, 2021-2030, Million USD

TABLE 30.    Asia-Pacific Collaborative Modular Robots Market Volume, By Country, 2021-2030, Thousand Units

TABLE 31.    Rest of the World Collaborative Modular Robots Market Value, By Country, 2021-2030, Million USD

TABLE 32.    Rest of the World Collaborative Modular Robots Market Volume, By Country, 2021-2030, Thousand Units

TABLE 33.    Cartesian Modular Robots Market Value, By Region, 2021-2030, Million USD

TABLE 34.    Cartesian Modular Robots Market Volume, By Region, 2021-2030, Thousand Units

TABLE 35.    North America Cartesian Modular Robots Market Value, By Country, 2021-2030, Million USD

TABLE 36.    North America Cartesian Modular Robots Market Volume, By Country, 2021-2030, Thousand Units

TABLE 37.    Europe Cartesian Modular Robots Market Value, By Country, 2021-2030, Million USD

TABLE 38.    Europe Cartesian Modular Robots Market Volume, By Country, 2021-2030, Thousand Units

TABLE 39.    Asia-Pacific Cartesian Modular Robots Market Value, By Country, 2021-2030, Million USD

TABLE 40.    Asia-Pacific Cartesian Modular Robots Market Volume, By Country, 2021-2030, Thousand Units

TABLE 41.    Rest of the World Cartesian Modular Robots Market Value, By Country, 2021-2030, Million USD

TABLE 42.    Rest of the World Cartesian Modular Robots Market Volume, By Country, 2021-2030, Thousand Units

TABLE 43.    Parallel Modular Robots Market Value, By Region, 2021-2030, Million USD

TABLE 44.    Parallel Modular Robots Market Volume, By Region, 2021-2030, Thousand Units

TABLE 45.    North America Parallel Modular Robots Market Value, By Country, 2021-2030, Million USD

TABLE 46.    North America Parallel Modular Robots Market Volume, By Country, 2021-2030, Thousand Units

TABLE 47.    Europe Parallel Modular Robots Market Value, By Country, 2021-2030, Million USD

TABLE 48.    Europe Parallel Modular Robots Market Volume, By Country, 2021-2030, Thousand Units

TABLE 49.    Asia-Pacific Parallel Modular Robots Market Value, By Country, 2021-2030, Million USD

TABLE 50.    Asia-Pacific Parallel Modular Robots Market Volume, By Country, 2021-2030, Thousand Units

TABLE 51.    Rest of the World Parallel Modular Robots Market Value, By Country, 2021-2030, Million USD

TABLE 52.    Rest of the World Parallel Modular Robots Market Volume, By Country, 2021-2030, Thousand Units

TABLE 53.    Others (Spherical and Cylindrical) Market Value, By Region, 2021-2030, Million USD

TABLE 54.    Others (Spherical and Cylindrical) Market Volume, By Region, 2021-2030, Thousand Units

TABLE 55.    North America Others (Spherical and Cylindrical) Market Value, By Country, 2021-2030, Million USD

TABLE 56.    North America Others (Spherical and Cylindrical) Market Volume, By Country, 2021-2030, Thousand Units

TABLE 57.    Europe Others (Spherical and Cylindrical) Market Value, By Country, 2021-2030, Million USD

TABLE 58.    Europe Others (Spherical and Cylindrical) Market Volume, By Country, 2021-2030, Thousand Units

TABLE 59.    Asia-Pacific Others (Spherical and Cylindrical) Market Value, By Country, 2021-2030, Million USD

TABLE 60.    Asia-Pacific Others (Spherical and Cylindrical) Market Volume, By Country, 2021-2030, Thousand Units

TABLE 61.    Rest of the World Others (Spherical and Cylindrical) Market Value, By Country, 2021-2030, Million USD

TABLE 62.    Rest of the World Others (Spherical and Cylindrical) Market Volume, By Country, 2021-2030, Thousand Units

TABLE 63.    Global Industrial Robotics Market Value, By Mobility, 2021-2030, Million USD

TABLE 64.    Global Industrial Robotics Market Volume, By Mobility, 2021-2030, Thousand Units

TABLE 65.    Fixed Robots Market Value, By Region, 2021-2030, Million USD

TABLE 66.    Fixed Robots Market Volume, By Region, 2021-2030, Thousand Units

TABLE 67.    North America Fixed Robots Market Value, By Country, 2021-2030, Million USD

TABLE 68.    North America Fixed Robots Market Volume, By Country, 2021-2030, Thousand Units

TABLE 69.    Europe Fixed Robots Market Value, By Country, 2021-2030, Million USD

TABLE 70.    Europe Fixed Robots Market Volume, By Country, 2021-2030, Thousand Units

TABLE 71.    Asia-Pacific Fixed Robots Market Value, By Country, 2021-2030, Million USD

TABLE 72.    Asia-Pacific Fixed Robots Market Volume, By Country, 2021-2030, Thousand Units

TABLE 73.    Rest of the World Fixed Robots Market Value, By Country, 2021-2030, Million USD

TABLE 74.    Rest of the World Fixed Robots Market Volume, By Country, 2021-2030, Thousand Units

TABLE 75.    Mobile Robots Market Value, By Region, 2021-2030, Million USD

TABLE 76.    Mobile Robots Market Volume, By Region, 2021-2030, Thousand Units

TABLE 77.    North America Mobile Robots Market Value, By Country, 2021-2030, Million USD

TABLE 78.    North America Mobile Robots Market Volume, By Country, 2021-2030, Thousand Units

TABLE 79.    Europe Mobile Robots Market Value, By Country, 2021-2030, Million USD

TABLE 80.    Europe Mobile Robots Market Volume, By Country, 2021-2030, Thousand Units

TABLE 81.    Asia-Pacific Mobile Robots Market Value, By Country, 2021-2030, Million USD

TABLE 82.    Asia-Pacific Mobile Robots Market Volume, By Country, 2021-2030, Thousand Units

TABLE 83.    Rest of the World Mobile Robots Market Value, By Country, 2021-2030, Million USD

TABLE 84.    Rest of the World Mobile Robots Market Volume, By Country, 2021-2030, Thousand Units

TABLE 85.    Global Industrial Robotics Market Value, By End User, 2021-2030, Million USD

TABLE 86.    Global Industrial Robotics Market Volume, By End User, 2021-2030, Thousand Units

TABLE 87.    Logistics Market Value, By Region, 2021-2030, Million USD

TABLE 88.    Logistics Market Volume, By Region, 2021-2030, Thousand Units

TABLE 89.    North America Logistics Market Value, By Country, 2021-2030, Million USD

TABLE 90.    North America Logistics Market Volume, By Country, 2021-2030, Thousand Units

TABLE 91.    Europe Logistics Market Value, By Country, 2021-2030, Million USD

TABLE 92.    Europe Logistics Market Volume, By Country, 2021-2030, Thousand Units

TABLE 93.    Asia-Pacific Logistics Market Value, By Country, 2021-2030, Million USD

TABLE 94.    Asia-Pacific Logistics Market Volume, By Country, 2021-2030, Thousand Units

TABLE 95.    Rest of the World Logistics Market Value, By Country, 2021-2030, Million USD

TABLE 96.    Rest of the World Logistics Market Volume, By Country, 2021-2030, Thousand Units

TABLE 97.    Aerospace & Defense Market Value, By Region, 2021-2030, Million USD

TABLE 98.    Aerospace & Defense Market Volume, By Region, 2021-2030, Thousand Units

TABLE 99.    North America Aerospace & Defense Market Value, By Country, 2021-2030, Million USD

TABLE 100.  North America Aerospace & Defense Market Volume, By Country, 2021-2030, Thousand Units

TABLE 101.  Europe Aerospace & Defense Market Value, By Country, 2021-2030, Million USD

TABLE 102.  Europe Aerospace & Defense Market Volume, By Country, 2021-2030, Thousand Units

TABLE 103.  Asia-Pacific Aerospace & Defense Market Value, By Country, 2021-2030, Million USD

TABLE 104.  Asia-Pacific Aerospace & Defense Market Volume, By Country, 2021-2030, Thousand Units

TABLE 105.  Rest of the World Aerospace & Defense Market Value, By Country, 2021-2030, Million USD

TABLE 106.  Rest of the World Aerospace & Defense Market Volume, By Country, 2021-2030, Thousand Units

TABLE 107.  Healthcare Market Value, By Region, 2021-2030, Million USD

TABLE 108.  Healthcare Market Volume, By Region, 2021-2030, Thousand Units

TABLE 109.  North America Healthcare Market Value, By Country, 2021-2030, Million USD

TABLE 110.  North America Healthcare Market Volume, By Country, 2021-2030, Thousand Units

TABLE 111.  Europe Healthcare Market Value, By Country, 2021-2030, Million USD

TABLE 112.  Europe Healthcare Market Volume, By Country, 2021-2030, Thousand Units

TABLE 113.  Asia-Pacific Healthcare Market Value, By Country, 2021-2030, Million USD

TABLE 114.  Asia-Pacific Healthcare Market Volume, By Country, 2021-2030, Thousand Units

TABLE 115.  Rest of the World Healthcare Market Value, By Country, 2021-2030, Million USD

TABLE 116.  Rest of the World Healthcare Market Volume, By Country, 2021-2030, Thousand Units

TABLE 117.  Food & Beverages Market Value, By Region, 2021-2030, Million USD

TABLE 118.  Food & Beverages Market Volume, By Region, 2021-2030, Thousand Units

TABLE 119.  North America Food & Beverages Market Value, By Country, 2021-2030, Million USD

TABLE 120.  North America Food & Beverages Market Volume, By Country, 2021-2030, Thousand Units

TABLE 121.  Europe Food & Beverages Market Value, By Country, 2021-2030, Million USD

TABLE 122.  Europe Food & Beverages Market Volume, By Country, 2021-2030, Thousand Units

TABLE 123.  Asia-Pacific Food & Beverages Market Value, By Country, 2021-2030, Million USD

TABLE 124.  Asia-Pacific Food & Beverages Market Volume, By Country, 2021-2030, Thousand Units

TABLE 125.  Rest of the World Food & Beverages Market Value, By Country, 2021-2030, Million USD

TABLE 126.  Rest of the World Food & Beverages Market Volume, By Country, 2021-2030, Thousand Units

TABLE 127.  Automotive & Transportation Market Value, By Region, 2021-2030, Million USD

TABLE 128.  Automotive & Transportation Market Volume, By Region, 2021-2030, Thousand Units

TABLE 129.  North America Automotive & Transportation Market Value, By Country, 2021-2030, Million USD

TABLE 130.  North America Automotive & Transportation Market Volume, By Country, 2021-2030, Thousand Units

TABLE 131.  Europe Automotive & Transportation Market Value, By Country, 2021-2030, Million USD

TABLE 132.  Europe Automotive & Transportation Market Volume, By Country, 2021-2030, Thousand Units

TABLE 133.  Asia-Pacific Automotive & Transportation Market Value, By Country, 2021-2030, Million USD

TABLE 134.  Asia-Pacific Automotive & Transportation Market Volume, By Country, 2021-2030, Thousand Units

TABLE 135.  Rest of the World Automotive & Transportation Market Value, By Country, 2021-2030, Million USD

TABLE 136.  Rest of the World Automotive & Transportation Market Volume, By Country, 2021-2030, Thousand Units

TABLE 137.  Manufacturing Market Value, By Region, 2021-2030, Million USD

TABLE 138.  Manufacturing Market Volume, By Region, 2021-2030, Thousand Units

TABLE 139.  North America Manufacturing Market Value, By Country, 2021-2030, Million USD

TABLE 140.  North America Manufacturing Market Volume, By Country, 2021-2030, Thousand Units

TABLE 141.  Europe Manufacturing Market Value, By Country, 2021-2030, Million USD

TABLE 142.  Europe Manufacturing Market Volume, By Country, 2021-2030, Thousand Units

TABLE 143.  Asia-Pacific Manufacturing Market Value, By Country, 2021-2030, Million USD

TABLE 144.  Asia-Pacific Manufacturing Market Volume, By Country, 2021-2030, Thousand Units

TABLE 145.  Rest of the World Manufacturing Market Value, By Country, 2021-2030, Million USD

TABLE 146.  Rest of the World Manufacturing Market Volume, By Country, 2021-2030, Thousand Units

TABLE 147.  Media & Entertainment Market Value, By Region, 2021-2030, Million USD

TABLE 148.  Media & Entertainment Market Volume, By Region, 2021-2030, Thousand Units

TABLE 149.  North America Media & Entertainment Market Value, By Country, 2021-2030, Million USD

TABLE 150.  North America Media & Entertainment Market Volume, By Country, 2021-2030, Thousand Units

TABLE 151.  Europe Media & Entertainment Market Value, By Country, 2021-2030, Million USD

TABLE 152.  Europe Media & Entertainment Market Volume, By Country, 2021-2030, Thousand Units

TABLE 153.  Asia-Pacific Media & Entertainment Market Value, By Country, 2021-2030, Million USD

TABLE 154.  Asia-Pacific Media & Entertainment Market Volume, By Country, 2021-2030, Thousand Units

TABLE 155.  Rest of the World Media & Entertainment Market Value, By Country, 2021-2030, Million USD

TABLE 156.  Rest of the World Media & Entertainment Market Volume, By Country, 2021-2030, Thousand Units

TABLE 157.  Others Market Value, By Region, 2021-2030, Million USD

TABLE 158.  Others Market Volume, By Region, 2021-2030, Thousand Units

TABLE 159.  North America Others Market Value, By Country, 2021-2030, Million USD

TABLE 160.  North America Others Market Volume, By Country, 2021-2030, Thousand Units

TABLE 161.  Europe Others Market Value, By Country, 2021-2030, Million USD

TABLE 162.  Europe Others Market Volume, By Country, 2021-2030, Thousand Units

TABLE 163.  Asia-Pacific Others Market Value, By Country, 2021-2030, Million USD

TABLE 164.  Asia-Pacific Others Market Volume, By Country, 2021-2030, Thousand Units

TABLE 165.  Rest of the World Others Market Value, By Country, 2021-2030, Million USD

TABLE 166.  Rest of the World Others Market Volume, By Country, 2021-2030, Thousand Units

TABLE 167.  Global Industrial Robotics Market Value, By Region, 2021-2030, Million USD

TABLE 168.  Global Industrial Robotics Market Volume, By Region, 2021-2030, Thousand Units

TABLE 169.  North America Industrial Robotics Market Value, By Type, 2021-2030, Million USD

TABLE 170.  North America Industrial Robotics Market Volume, By Type, 2021-2030, Thousand Units

TABLE 171.  North America Industrial Robotics Market Value, By Mobility, 2021-2030, Million USD

TABLE 172.  North America Industrial Robotics Market Volume, By Mobility, 2021-2030, Thousand Units

TABLE 173.  North America Industrial Robotics Market Value, By End User, 2021-2030, Million USD

TABLE 174.  North America Industrial Robotics Market Volume, By End User, 2021-2030, Thousand Units

TABLE 175.  North America Industrial Robotics Market Value, By Country, 2021-2030, Million USD

TABLE 176.  North America Industrial Robotics Market Volume, By Country, 2021-2030, Thousand Units

TABLE 177.  U.S. Industrial Robotics Market Value, By Type, 2021-2030, Million USD

TABLE 178.  U.S. Industrial Robotics Market Volume, By Type, 2021-2030, Thousand Units

TABLE 179.  U.S. Industrial Robotics Market Value, By Mobility, 2021-2030, Million USD

TABLE 180.  U.S. Industrial Robotics Market Volume, By Mobility, 2021-2030, Thousand Units

TABLE 181.  U.S. Industrial Robotics Market Value, By End User, 2021-2030, Million USD

TABLE 182.  U.S. Industrial Robotics Market Volume, By End User, 2021-2030, Thousand Units

TABLE 183.  Canada Industrial Robotics Market Value, By Type, 2021-2030, Million USD

TABLE 184.  Canada Industrial Robotics Market Volume, By Type, 2021-2030, Thousand Units

TABLE 185.  Canada Industrial Robotics Market Value, By Mobility, 2021-2030, Million USD

TABLE 186.  Canada Industrial Robotics Market Volume, By Mobility, 2021-2030, Thousand Units

TABLE 187.  Canada Industrial Robotics Market Value, By End User, 2021-2030, Million USD

TABLE 188.  Canada Industrial Robotics Market Volume, By End User, 2021-2030, Thousand Units

TABLE 189.  Mexico Industrial Robotics Market Value, By Type, 2021-2030, Million USD

TABLE 190.  Mexico Industrial Robotics Market Volume, By Type, 2021-2030, Thousand Units

TABLE 191.  Mexico Industrial Robotics Market Value, By Mobility, 2021-2030, Million USD

TABLE 192.  Mexico Industrial Robotics Market Volume, By Mobility, 2021-2030, Thousand Units

TABLE 193.  Mexico Industrial Robotics Market Value, By End User, 2021-2030, Million USD

TABLE 194.  Mexico Industrial Robotics Market Volume, By End User, 2021-2030, Thousand Units

TABLE 195.  Europe Industrial Robotics Market Value, By Type, 2021-2030, Million USD

TABLE 196.  Europe Industrial Robotics Market Volume, By Type, 2021-2030, Thousand Units

TABLE 197.  Europe Industrial Robotics Market Value, By Mobility, 2021-2030, Million USD

TABLE 198.  Europe Industrial Robotics Market Volume, By Mobility, 2021-2030, Thousand Units

TABLE 199.  Europe Industrial Robotics Market Value, By End User, 2021-2030, Million USD

TABLE 200.  Europe Industrial Robotics Market Volume, By End User, 2021-2030, Thousand Units

TABLE 201.  Europe Industrial Robotics Market Value, By Country, 2021-2030, Million USD

TABLE 202.  Europe Industrial Robotics Market Volume, By Country, 2021-2030, Thousand Units

TABLE 203.  UK Industrial Robotics Market Value, By Type, 2021-2030, Million USD

TABLE 204.  UK Industrial Robotics Market Volume, By Type, 2021-2030, Thousand Units

TABLE 205.  UK Industrial Robotics Market Value, By Mobility, 2021-2030, Million USD

TABLE 206.  UK Industrial Robotics Market Volume, By Mobility, 2021-2030, Thousand Units

TABLE 207.  UK Industrial Robotics Market Value, By End User, 2021-2030, Million USD

TABLE 208.  UK Industrial Robotics Market Volume, By End User, 2021-2030, Thousand Units

TABLE 209.  Germany Industrial Robotics Market Value, By Type, 2021-2030, Million USD

TABLE 210.  Germany Industrial Robotics Market Volume, By Type, 2021-2030, Thousand Units

TABLE 211.  Germany Industrial Robotics Market Value, By Mobility, 2021-2030, Million USD

TABLE 212.  Germany Industrial Robotics Market Volume, By Mobility, 2021-2030, Thousand Units

TABLE 213.  Germany Industrial Robotics Market Value, By End User, 2021-2030, Million USD

TABLE 214.  Germany Industrial Robotics Market Volume, By End User, 2021-2030, Thousand Units

TABLE 215.  France Industrial Robotics Market Value, By Type, 2021-2030, Million USD

TABLE 216.  France Industrial Robotics Market Volume, By Type, 2021-2030, Thousand Units

TABLE 217.  France Industrial Robotics Market Value, By Mobility, 2021-2030, Million USD

TABLE 218.  France Industrial Robotics Market Volume, By Mobility, 2021-2030, Thousand Units

TABLE 219.  France Industrial Robotics Market Value, By End User, 2021-2030, Million USD

TABLE 220.  France Industrial Robotics Market Volume, By End User, 2021-2030, Thousand Units

TABLE 221.  Spain Industrial Robotics Market Value, By Type, 2021-2030, Million USD

TABLE 222.  Spain Industrial Robotics Market Volume, By Type, 2021-2030, Thousand Units

TABLE 223.  Spain Industrial Robotics Market Value, By Mobility, 2021-2030, Million USD

TABLE 224.  Spain Industrial Robotics Market Volume, By Mobility, 2021-2030, Thousand Units

TABLE 225.  Spain Industrial Robotics Market Value, By End User, 2021-2030, Million USD

TABLE 226.  Spain Industrial Robotics Market Volume, By End User, 2021-2030, Thousand Units

TABLE 227.  Italy Industrial Robotics Market Value, By Type, 2021-2030, Million USD

TABLE 228.  Italy Industrial Robotics Market Volume, By Type, 2021-2030, Thousand Units

TABLE 229.  Italy Industrial Robotics Market Value, By Mobility, 2021-2030, Million USD

TABLE 230.  Italy Industrial Robotics Market Volume, By Mobility, 2021-2030, Thousand Units

TABLE 231.  Italy Industrial Robotics Market Value, By End User, 2021-2030, Million USD

TABLE 232.  Italy Industrial Robotics Market Volume, By End User, 2021-2030, Thousand Units

TABLE 233.  Netherlands Industrial Robotics Market Value, By Type, 2021-2030, Million USD

TABLE 234.  Netherlands Industrial Robotics Market Volume, By Type, 2021-2030, Thousand Units

TABLE 235.  Netherlands Industrial Robotics Market Value, By Mobility, 2021-2030, Million USD

TABLE 236.  Netherlands Industrial Robotics Market Volume, By Mobility, 2021-2030, Thousand Units

TABLE 237.  Netherlands Industrial Robotics Market Value, By End User, 2021-2030, Million USD

TABLE 238.  Netherlands Industrial Robotics Market Volume, By End User, 2021-2030, Thousand Units

TABLE 239.  Rest of Europe Industrial Robotics Market Value, By Type, 2021-2030, Million USD

TABLE 240.  Rest of Europe Industrial Robotics Market Volume, By Type, 2021-2030, Thousand Units

TABLE 241.  Rest of Europe Industrial Robotics Market Value, By Mobility, 2021-2030, Million USD

TABLE 242.  Rest of Europe Industrial Robotics Market Volume, By Mobility, 2021-2030, Thousand Units

TABLE 243.  Rest of Europe Industrial Robotics Market Value, By End User, 2021-2030, Million USD

TABLE 244.  Rest of Europe Industrial Robotics Market Volume, By End User, 2021-2030, Thousand Units

TABLE 245.  Asia-Pacific Industrial Robotics Market Value, By Type, 2021-2030, Million USD

TABLE 246.  Asia-Pacific Industrial Robotics Market Volume, By Type, 2021-2030, Thousand Units

TABLE 247.  Asia-Pacific Industrial Robotics Market Value, By Mobility, 2021-2030, Million USD

TABLE 248.  Asia-Pacific Industrial Robotics Market Volume, By Mobility, 2021-2030, Thousand Units

TABLE 249.  Asia-Pacific Industrial Robotics Market Value, By End User, 2021-2030, Million USD

TABLE 250.  Asia-Pacific Industrial Robotics Market Volume, By End User, 2021-2030, Thousand Units

TABLE 251.  Asia-Pacific Industrial Robotics Market Value, By Country, 2021-2030, Million USD

TABLE 252.  Asia-Pacific Industrial Robotics Market Volume, By Country, 2021-2030, Thousand Units

TABLE 253.  China Industrial Robotics Market Value, By Type, 2021-2030, Million USD

TABLE 254.  China Industrial Robotics Market Volume, By Type, 2021-2030, Thousand Units

TABLE 255.  China Industrial Robotics Market Value, By Mobility, 2021-2030, Million USD

TABLE 256.  China Industrial Robotics Market Volume, By Mobility, 2021-2030, Thousand Units

TABLE 257.  China Industrial Robotics Market Value, By End User, 2021-2030, Million USD

TABLE 258.  China Industrial Robotics Market Volume, By End User, 2021-2030, Thousand Units

TABLE 259.  Japan Industrial Robotics Market Value, By Type, 2021-2030, Million USD

TABLE 260.  Japan Industrial Robotics Market Volume, By Type, 2021-2030, Thousand Units

TABLE 261.  Japan Industrial Robotics Market Value, By Mobility, 2021-2030, Million USD

TABLE 262.  Japan Industrial Robotics Market Volume, By Mobility, 2021-2030, Thousand Units

TABLE 263.  Japan Industrial Robotics Market Value, By End User, 2021-2030, Million USD

TABLE 264.  Japan Industrial Robotics Market Volume, By End User, 2021-2030, Thousand Units

TABLE 265.  India Industrial Robotics Market Value, By Type, 2021-2030, Million USD

TABLE 266.  India Industrial Robotics Market Volume, By Type, 2021-2030, Thousand Units

TABLE 267.  India Industrial Robotics Market Value, By Mobility, 2021-2030, Million USD

TABLE 268.  India Industrial Robotics Market Volume, By Mobility, 2021-2030, Thousand Units

TABLE 269.  India Industrial Robotics Market Value, By End User, 2021-2030, Million USD

TABLE 270.  India Industrial Robotics Market Volume, By End User, 2021-2030, Thousand Units

TABLE 271.  Australia Industrial Robotics Market Value, By Type, 2021-2030, Million USD

TABLE 272.  Australia Industrial Robotics Market Volume, By Type, 2021-2030, Thousand Units

TABLE 273.  Australia Industrial Robotics Market Value, By Mobility, 2021-2030, Million USD

TABLE 274.  Australia Industrial Robotics Market Volume, By Mobility, 2021-2030, Thousand Units

TABLE 275.  Australia Industrial Robotics Market Value, By End User, 2021-2030, Million USD

TABLE 276.  Australia Industrial Robotics Market Volume, By End User, 2021-2030, Thousand Units

TABLE 277.  South Korea Industrial Robotics Market Value, By Type, 2021-2030, Million USD

TABLE 278.  South Korea Industrial Robotics Market Volume, By Type, 2021-2030, Thousand Units

TABLE 279.  South Korea Industrial Robotics Market Value, By Mobility, 2021-2030, Million USD

TABLE 280.  South Korea Industrial Robotics Market Volume, By Mobility, 2021-2030, Thousand Units

TABLE 281.  South Korea Industrial Robotics Market Value, By End User, 2021-2030, Million USD

TABLE 282.  South Korea Industrial Robotics Market Volume, By End User, 2021-2030, Thousand Units

TABLE 283.  Taiwan Industrial Robotics Market Value, By Type, 2021-2030, Million USD

TABLE 284.  Taiwan Industrial Robotics Market Volume, By Type, 2021-2030, Thousand Units

TABLE 285.  Taiwan Industrial Robotics Market Value, By Mobility, 2021-2030, Million USD

TABLE 286.  Taiwan Industrial Robotics Market Volume, By Mobility, 2021-2030, Thousand Units

TABLE 287.  Taiwan Industrial Robotics Market Value, By End User, 2021-2030, Million USD

TABLE 288.  Taiwan Industrial Robotics Market Volume, By End User, 2021-2030, Thousand Units

TABLE 289.  Vietnam Industrial Robotics Market Value, By Type, 2021-2030, Million USD

TABLE 290.  Vietnam Industrial Robotics Market Volume, By Type, 2021-2030, Thousand Units

TABLE 291.  Vietnam Industrial Robotics Market Value, By Mobility, 2021-2030, Million USD

TABLE 292.  Vietnam Industrial Robotics Market Volume, By Mobility, 2021-2030, Thousand Units

TABLE 293.  Vietnam Industrial Robotics Market Value, By End User, 2021-2030, Million USD

TABLE 294.  Vietnam Industrial Robotics Market Volume, By End User, 2021-2030, Thousand Units

TABLE 295.  Rest of Asia-Pacific Industrial Robotics Market Value, By Type, 2021-2030, Million USD

TABLE 296.  Rest of Asia-Pacific Industrial Robotics Market Volume, By Type, 2021-2030, Thousand Units

TABLE 297.  Rest of Asia-Pacific Industrial Robotics Market Value, By Mobility, 2021-2030, Million USD

TABLE 298.  Rest of Asia-Pacific Industrial Robotics Market Volume, By Mobility, 2021-2030, Thousand Units

TABLE 299.  Rest of Asia-Pacific Industrial Robotics Market Value, By End User, 2021-2030, Million USD

TABLE 300.  Rest of Asia-Pacific Industrial Robotics Market Volume, By End User, 2021-2030, Thousand Units

TABLE 301.  Rest of the World Industrial Robotics Market Value, By Type, 2021-2030, Million USD

TABLE 302.  Rest of the World Industrial Robotics Market Volume, By Type, 2021-2030, Thousand Units

TABLE 303.  Rest of the World Industrial Robotics Market Value, By Mobility, 2021-2030, Million USD

TABLE 304.  Rest of the World Industrial Robotics Market Volume, By Mobility, 2021-2030, Thousand Units

TABLE 305.  Rest of the World Industrial Robotics Market Value, By End User, 2021-2030, Million USD

TABLE 306.  Rest of the World Industrial Robotics Market Volume, By End User, 2021-2030, Thousand Units

TABLE 307.  Rest of the World Industrial Robotics Market Value, By Country, 2021-2030, Million USD

TABLE 308.  Rest of the World Industrial Robotics Market Volume, By Country, 2021-2030, Thousand Units

TABLE 309.  Latin America Industrial Robotics Market Value, By Type, 2021-2030, Million USD

TABLE 310.  Latin America Industrial Robotics Market Volume, By Type, 2021-2030, Thousand Units

TABLE 311.  Latin America Industrial Robotics Market Value, By Mobility, 2021-2030, Million USD

TABLE 312.  Latin America Industrial Robotics Market Volume, By Mobility, 2021-2030, Thousand Units

TABLE 313.  Latin America Industrial Robotics Market Value, By End User, 2021-2030, Million USD

TABLE 314.  Latin America Industrial Robotics Market Volume, By End User, 2021-2030, Thousand Units

TABLE 315.  Middle East Industrial Robotics Market Value, By Type, 2021-2030, Million USD

TABLE 316.  Middle East Industrial Robotics Market Volume, By Type, 2021-2030, Thousand Units

TABLE 317.  Middle East Industrial Robotics Market Value, By Mobility, 2021-2030, Million USD

TABLE 318.  Middle East Industrial Robotics Market Volume, By Mobility, 2021-2030, Thousand Units

TABLE 319.  Middle East Industrial Robotics Market Value, By End User, 2021-2030, Million USD

TABLE 320.  Middle East Industrial Robotics Market Volume, By End User, 2021-2030, Thousand Units

TABLE 321.  Africa Industrial Robotics Market Value, By Type, 2021-2030, Million USD

TABLE 322.  Africa Industrial Robotics Market Volume, By Type, 2021-2030, Thousand Units

TABLE 323.  Africa Industrial Robotics Market Value, By Mobility, 2021-2030, Million USD

TABLE 324.  Africa Industrial Robotics Market Volume, By Mobility, 2021-2030, Thousand Units

TABLE 325.  Africa Industrial Robotics Market Value, By End User, 2021-2030, Million USD

TABLE 326.  Africa Industrial Robotics Market Volume, By End User, 2021-2030, Thousand Units

TABLE 327.  ABB: COMPANY SNAPSHOT

TABLE 328.  ABB : operating segments

TABLE 329.  ABB: Product Portfolio

TABLE 330.  ABB: Sales by Business segment

TABLE 331.  ABB: Sales by Geographic segment

TABLE 332.  KUKA AG: COMPANY SNAPSHOT

TABLE 333.  KUKA AG : operating segments

TABLE 334.  Kuka Ag.: Product Portfolio

TABLE 335.  KUKA AG: Sales by Business segment

TABLE 336.  KUKA AG: Sales by Geographic segment

TABLE 337.  FANUC: COMPANY SNAPSHOT

TABLE 338.  FANUC: operating segments

TABLE 339.  Fanuc: Product Portfolio

TABLE 340.  FANUC: Sales by Business segment

TABLE 341.  FANUC: Sales by Geographic segment

TABLE 342.  YASKAWA ELECTRIC CORPORATION: COMPANY SNAPSHOT

TABLE 343.  YASKAWA ELECTRIC CORPORATION : operating segments

TABLE 344.  YASKAWA ELECTRIC CORPORATION.: Product Portfolio

TABLE 345.  YASKAWA ELECTRIC CORPORATION: Sales by Business segment

TABLE 346.  YASKAWA ELECTRIC CORPORATION: Sales by Geographic segment

TABLE 347.  DENSO Corporation: COMPANY SNAPSHOT

TABLE 348.  DENSO Corporation: Product Portfolio

TABLE 349.  Universal Robots: COMPANY SNAPSHOT

TABLE 350.  Universal Robots: Product Portfolio

TABLE 351.  NACHI-FUJIKOSHI CORP.: COMPANY SNAPSHOT

TABLE 352.  NACHI-FUJIKOSHI CORP. : operating segments

TABLE 353.  NACHI-FUJIKOSHI CORP.: Product Portfolio

TABLE 354.  OMRON CORPORATION: COMPANY SNAPSHOT

TABLE 355.  OMRON CORPORATION : operating segments

TABLE 356.  OMRON CORPORATION: Product Portfolio

TABLE 357.  Rethink Robotics GmbH: COMPANY SNAPSHOT

TABLE 358.  Rethink Robotics GmbH: Product Portfolio

TABLE 359.  KAWASAKI HEAVY INDUSTRIES LTD.: COMPANY SNAPSHOT

TABLE 360.  KAWASAKI HEAVY INDUSTRIES LTD. : operating segments

TABLE 361.  Kawasaki Heavy Industries Ltd.: Product Portfolio

TABLE 362.  KRONES AG: COMPANY SNAPSHOT

TABLE 363.  KRONES AG: Product Portfolio

TABLE 364.  KRONES AG: Sales by Geographic segment

TABLE 365.  MITSUBISHI ELECTRIC CORP.: COMPANY SNAPSHOT

TABLE 366.  MITSUBISHI ELECTRIC CORP. : operating segments

TABLE 367.  MITSUBISHI ELECTRIC CORP.: Product Portfolio

TABLE 368.  BRENTON LLC: COMPANY SNAPSHOT

TABLE 369.  BRENTON LLC.: Product Portfolio

TABLE 370.  Doosan Robotics Inc.: COMPANY SNAPSHOT

TABLE 371.  Doosan Robotics Inc.: Product Portfolio

TABLE 372.  panasonic corporation: COMPANY SNAPSHOT

TABLE 373.  panasonic corporation: operating segments

TABLE 374.  panasonic corporation: Product Portfolio

TABLE 375.  Comau S.p.A.: COMPANY SNAPSHOT

TABLE 376.  Comau S.p.A.: Product Portfolio

TABLE 377.  TECHMAN ROBOT INC.: COMPANY SNAPSHOT

TABLE 378.  TECHMAN ROBOT INC.: Product Portfolio

TABLE 379.  SCHNEIDER ELECTRIC S.E.: COMPANY SNAPSHOT

TABLE 380.  SCHNEIDER ELECTRIC S.E.: Product Portfolio

TABLE 381.  Precise Automation: COMPANY SNAPSHOT

TABLE 382.  Precise Automation: Product Portfolio


LIST OF FIGURES

FIGURE 1.     Market share analysis of top 10 INDUSTRIAL ROBOTICS PROVIDERS PROVIDERS, 2021

FIGURE 2.     Global Industrial Robotics Market Value, By Type, 2021-2030, Million USD

FIGURE 3.     Global Industrial Robotics Market Volume, By Type, 2021-2030, Thousand Units

FIGURE 4.     SCARA Modular Robots Market Value, By Region, 2021-2030, Million USD

FIGURE 5.     SCARA Modular Robots Market Volume, By Region, 2021-2030, Thousand Units

FIGURE 6.     North America SCARA Modular Robots Market Value, By Country, 2021-2030, Million USD

FIGURE 7.     North America SCARA Modular Robots Market Volume, By Country, 2021-2030, Thousand Units

FIGURE 8.     Europe SCARA Modular Robots Market Value, By Country, 2021-2030, Million USD

FIGURE 9.     Europe SCARA Modular Robots Market Volume, By Country, 2021-2030, Thousand Units

FIGURE 10.  Asia-Pacific SCARA Modular Robots Market Value, By Country, 2021-2030, Million USD

FIGURE 11.  Asia-Pacific SCARA Modular Robots Market Volume, By Country, 2021-2030, Thousand Units

FIGURE 12.  Rest of the World SCARA Modular Robots Market Value, By Country, 2021-2030, Million USD

FIGURE 13.  Rest of the World SCARA Modular Robots Market Volume, By Country, 2021-2030, Thousand Units

FIGURE 14.  Articulated Modular Robots Market Value, By Region, 2021-2030, Million USD

FIGURE 15.  Articulated Modular Robots Market Volume, By Region, 2021-2030, Thousand Units

FIGURE 16.  North America Articulated Modular Robots Market Value, By Country, 2021-2030, Million USD

FIGURE 17.  North America Articulated Modular Robots Market Volume, By Country, 2021-2030, Thousand Units

FIGURE 18.  Europe Articulated Modular Robots Market Value, By Country, 2021-2030, Million USD

FIGURE 19.  Europe Articulated Modular Robots Market Volume, By Country, 2021-2030, Thousand Units

FIGURE 20.  Asia-Pacific Articulated Modular Robots Market Value, By Country, 2021-2030, Million USD

FIGURE 21.  Asia-Pacific Articulated Modular Robots Market Volume, By Country, 2021-2030, Thousand Units

FIGURE 22.  Rest of the World Articulated Modular Robots Market Value, By Country, 2021-2030, Million USD

FIGURE 23.  Rest of the World Articulated Modular Robots Market Volume, By Country, 2021-2030, Thousand Units

FIGURE 24.  Collaborative Modular Robots Market Value, By Region, 2021-2030, Million USD

FIGURE 25.  Collaborative Modular Robots Market Volume, By Region, 2021-2030, Thousand Units

FIGURE 26.  North America Collaborative Modular Robots Market Value, By Country, 2021-2030, Million USD

FIGURE 27.  North America Collaborative Modular Robots Market Volume, By Country, 2021-2030, Thousand Units

FIGURE 28.  Europe Collaborative Modular Robots Market Value, By Country, 2021-2030, Million USD

FIGURE 29.  Europe Collaborative Modular Robots Market Volume, By Country, 2021-2030, Thousand Units

FIGURE 30.  Asia-Pacific Collaborative Modular Robots Market Value, By Country, 2021-2030, Million USD

FIGURE 31.  Asia-Pacific Collaborative Modular Robots Market Volume, By Country, 2021-2030, Thousand Units

FIGURE 32.  Rest of the World Collaborative Modular Robots Market Value, By Country, 2021-2030, Million USD

FIGURE 33.  Rest of the World Collaborative Modular Robots Market Volume, By Country, 2021-2030, Thousand Units

FIGURE 34.  Cartesian Modular Robots Market Value, By Region, 2021-2030, Million USD

FIGURE 35.  Cartesian Modular Robots Market Volume, By Region, 2021-2030, Thousand Units

FIGURE 36.  North America Cartesian Modular Robots Market Value, By Country, 2021-2030, Million USD

FIGURE 37.  North America Cartesian Modular Robots Market Volume, By Country, 2021-2030, Thousand Units

FIGURE 38.  Europe Cartesian Modular Robots Market Value, By Country, 2021-2030, Million USD

FIGURE 39.  Europe Cartesian Modular Robots Market Volume, By Country, 2021-2030, Thousand Units

FIGURE 40.  Asia-Pacific Cartesian Modular Robots Market Value, By Country, 2021-2030, Million USD

FIGURE 41.  Asia-Pacific Cartesian Modular Robots Market Volume, By Country, 2021-2030, Thousand Units

FIGURE 42.  Rest of the World Cartesian Modular Robots Market Value, By Country, 2021-2030, Million USD

FIGURE 43.  Rest of the World Cartesian Modular Robots Market Volume, By Country, 2021-2030, Thousand Units

FIGURE 44.  Parallel Modular Robots Market Value, By Region, 2021-2030, Million USD

FIGURE 45.  Parallel Modular Robots Market Volume, By Region, 2021-2030, Thousand Units

FIGURE 46.  North America Parallel Modular Robots Market Value, By Country, 2021-2030, Million USD

FIGURE 47.  North America Parallel Modular Robots Market Volume, By Country, 2021-2030, Thousand Units

FIGURE 48.  Europe Parallel Modular Robots Market Value, By Country, 2021-2030, Million USD

FIGURE 49.  Europe Parallel Modular Robots Market Volume, By Country, 2021-2030, Thousand Units

FIGURE 50.  Asia-Pacific Parallel Modular Robots Market Value, By Country, 2021-2030, Million USD

FIGURE 51.  Asia-Pacific Parallel Modular Robots Market Volume, By Country, 2021-2030, Thousand Units

FIGURE 52.  Rest of the World Parallel Modular Robots Market Value, By Country, 2021-2030, Million USD

FIGURE 53.  Rest of the World Parallel Modular Robots Market Volume, By Country, 2021-2030, Thousand Units

FIGURE 54.  Others (Spherical and Cylindrical) Market Value, By Region, 2021-2030, Million USD

FIGURE 55.  Others (Spherical and Cylindrical) Market Volume, By Region, 2021-2030, Thousand Units

FIGURE 56.  North America Others (Spherical and Cylindrical) Market Value, By Country, 2021-2030, Million USD

FIGURE 57.  North America Others (Spherical and Cylindrical) Market Volume, By Country, 2021-2030, Thousand Units

FIGURE 58.  Europe Others (Spherical and Cylindrical) Market Value, By Country, 2021-2030, Million USD

FIGURE 59.  Europe Others (Spherical and Cylindrical) Market Volume, By Country, 2021-2030, Thousand Units

FIGURE 60.  Asia-Pacific Others (Spherical and Cylindrical) Market Value, By Country, 2021-2030, Million USD

FIGURE 61.  Asia-Pacific Others (Spherical and Cylindrical) Market Volume, By Country, 2021-2030, Thousand Units

FIGURE 62.  Rest of the World Others (Spherical and Cylindrical) Market Value, By Country, 2021-2030, Million USD

FIGURE 63.  Rest of the World Others (Spherical and Cylindrical) Market Volume, By Country, 2021-2030, Thousand Units

FIGURE 64.  Global Industrial Robotics Market Value, By Mobility, 2021-2030, Million USD

FIGURE 65.  Global Industrial Robotics Market Volume, By Mobility, 2021-2030, Thousand Units

FIGURE 66.  Fixed Robots Market Value, By Region, 2021-2030, Million USD

FIGURE 67.  Fixed Robots Market Volume, By Region, 2021-2030, Thousand Units

FIGURE 68.  North America Fixed Robots Market Value, By Country, 2021-2030, Million USD

FIGURE 69.  North America Fixed Robots Market Volume, By Country, 2021-2030, Thousand Units

FIGURE 70.  Europe Fixed Robots Market Value, By Country, 2021-2030, Million USD

FIGURE 71.  Europe Fixed Robots Market Volume, By Country, 2021-2030, Thousand Units

FIGURE 72.  Asia-Pacific Fixed Robots Market Value, By Country, 2021-2030, Million USD

FIGURE 73.  Asia-Pacific Fixed Robots Market Volume, By Country, 2021-2030, Thousand Units

FIGURE 74.  Rest of the World Fixed Robots Market Value, By Country, 2021-2030, Million USD

FIGURE 75.  Rest of the World Fixed Robots Market Volume, By Country, 2021-2030, Thousand Units

FIGURE 76.  Mobile Robots Market Value, By Region, 2021-2030, Million USD

FIGURE 77.  Mobile Robots Market Volume, By Region, 2021-2030, Thousand Units

FIGURE 78.  North America Mobile Robots Market Value, By Country, 2021-2030, Million USD

FIGURE 79.  North America Mobile Robots Market Volume, By Country, 2021-2030, Thousand Units

FIGURE 80.  Europe Mobile Robots Market Value, By Country, 2021-2030, Million USD

FIGURE 81.  Europe Mobile Robots Market Volume, By Country, 2021-2030, Thousand Units

FIGURE 82.  Asia-Pacific Mobile Robots Market Value, By Country, 2021-2030, Million USD

FIGURE 83.  Asia-Pacific Mobile Robots Market Volume, By Country, 2021-2030, Thousand Units

FIGURE 84.  Rest of the World Mobile Robots Market Value, By Country, 2021-2030, Million USD

FIGURE 85.  Rest of the World Mobile Robots Market Volume, By Country, 2021-2030, Thousand Units

FIGURE 86.  Global Industrial Robotics Market Value, By End User, 2021-2030, Million USD

FIGURE 87.  Global Industrial Robotics Market Volume, By End User, 2021-2030, Thousand Units

FIGURE 88.  Logistics Market Value, By Region, 2021-2030, Million USD

FIGURE 89.  Logistics Market Volume, By Region, 2021-2030, Thousand Units

FIGURE 90.  North America Logistics Market Value, By Country, 2021-2030, Million USD

FIGURE 91.  North America Logistics Market Volume, By Country, 2021-2030, Thousand Units

FIGURE 92.  Europe Logistics Market Value, By Country, 2021-2030, Million USD

FIGURE 93.  Europe Logistics Market Volume, By Country, 2021-2030, Thousand Units

FIGURE 94.  Asia-Pacific Logistics Market Value, By Country, 2021-2030, Million USD

FIGURE 95.  Asia-Pacific Logistics Market Volume, By Country, 2021-2030, Thousand Units

FIGURE 96.  Rest of the World Logistics Market Value, By Country, 2021-2030, Million USD

FIGURE 97.  Rest of the World Logistics Market Volume, By Country, 2021-2030, Thousand Units

FIGURE 98.  Aerospace & Defense Market Value, By Region, 2021-2030, Million USD

FIGURE 99.  Aerospace & Defense Market Volume, By Region, 2021-2030, Thousand Units

FIGURE 100.                        North America Aerospace & Defense Market Value, By Country, 2021-2030, Million USD

FIGURE 101.                        North America Aerospace & Defense Market Volume, By Country, 2021-2030, Thousand Units

FIGURE 102.                        Europe Aerospace & Defense Market Value, By Country, 2021-2030, Million USD

FIGURE 103.                        Europe Aerospace & Defense Market Volume, By Country, 2021-2030, Thousand Units

FIGURE 104.                        Asia-Pacific Aerospace & Defense Market Value, By Country, 2021-2030, Million USD

FIGURE 105.                        Asia-Pacific Aerospace & Defense Market Volume, By Country, 2021-2030, Thousand Units

FIGURE 106.                        Rest of the World Aerospace & Defense Market Value, By Country, 2021-2030, Million USD

FIGURE 107.                        Rest of the World Aerospace & Defense Market Volume, By Country, 2021-2030, Thousand Units

FIGURE 108.                        Healthcare Market Value, By Region, 2021-2030, Million USD

FIGURE 109.                        Healthcare Market Volume, By Region, 2021-2030, Thousand Units

FIGURE 110.                        North America Healthcare Market Value, By Country, 2021-2030, Million USD

FIGURE 111.                        North America Healthcare Market Volume, By Country, 2021-2030, Thousand Units

FIGURE 112.                        Europe Healthcare Market Value, By Country, 2021-2030, Million USD

FIGURE 113.                        Europe Healthcare Market Volume, By Country, 2021-2030, Thousand Units

FIGURE 114.                        Asia-Pacific Healthcare Market Value, By Country, 2021-2030, Million USD

FIGURE 115.                        Asia-Pacific Healthcare Market Volume, By Country, 2021-2030, Thousand Units

FIGURE 116.                        Rest of the World Healthcare Market Value, By Country, 2021-2030, Million USD

FIGURE 117.                        Rest of the World Healthcare Market Volume, By Country, 2021-2030, Thousand Units

FIGURE 118.                        Food & Beverages Market Value, By Region, 2021-2030, Million USD

FIGURE 119.                        Food & Beverages Market Volume, By Region, 2021-2030, Thousand Units

FIGURE 120.                        North America Food & Beverages Market Value, By Country, 2021-2030, Million USD

FIGURE 121.                        North America Food & Beverages Market Volume, By Country, 2021-2030, Thousand Units

FIGURE 122.                        Europe Food & Beverages Market Value, By Country, 2021-2030, Million USD

FIGURE 123.                        Europe Food & Beverages Market Volume, By Country, 2021-2030, Thousand Units

FIGURE 124.                        Asia-Pacific Food & Beverages Market Value, By Country, 2021-2030, Million USD

FIGURE 125.                        Asia-Pacific Food & Beverages Market Volume, By Country, 2021-2030, Thousand Units

FIGURE 126.                        Rest of the World Food & Beverages Market Value, By Country, 2021-2030, Million USD

FIGURE 127.                        Rest of the World Food & Beverages Market Volume, By Country, 2021-2030, Thousand Units

FIGURE 128.                        Automotive & Transportation Market Value, By Region, 2021-2030, Million USD

FIGURE 129.                        Automotive & Transportation Market Volume, By Region, 2021-2030, Thousand Units

FIGURE 130.                        North America Automotive & Transportation Market Value, By Country, 2021-2030, Million USD

FIGURE 131.                        North America Automotive & Transportation Market Volume, By Country, 2021-2030, Thousand Units

FIGURE 132.                        Europe Automotive & Transportation Market Value, By Country, 2021-2030, Million USD

FIGURE 133.                        Europe Automotive & Transportation Market Volume, By Country, 2021-2030, Thousand Units

FIGURE 134.                        Asia-Pacific Automotive & Transportation Market Value, By Country, 2021-2030, Million USD

FIGURE 135.                        Asia-Pacific Automotive & Transportation Market Volume, By Country, 2021-2030, Thousand Units

FIGURE 136.                        Rest of the World Automotive & Transportation Market Value, By Country, 2021-2030, Million USD

FIGURE 137.                        Rest of the World Automotive & Transportation Market Volume, By Country, 2021-2030, Thousand Units

FIGURE 138.                        Manufacturing Market Value, By Region, 2021-2030, Million USD

FIGURE 139.                        Manufacturing Market Volume, By Region, 2021-2030, Thousand Units

FIGURE 140.                        North America Manufacturing Market Value, By Country, 2021-2030, Million USD

FIGURE 141.                        North America Manufacturing Market Volume, By Country, 2021-2030, Thousand Units

FIGURE 142.                        Europe Manufacturing Market Value, By Country, 2021-2030, Million USD

FIGURE 143.                        Europe Manufacturing Market Volume, By Country, 2021-2030, Thousand Units

FIGURE 144.                        Asia-Pacific Manufacturing Market Value, By Country, 2021-2030, Million USD

FIGURE 145.                        Asia-Pacific Manufacturing Market Volume, By Country, 2021-2030, Thousand Units

FIGURE 146.                        Rest of the World Manufacturing Market Value, By Country, 2021-2030, Million USD

FIGURE 147.                        Rest of the World Manufacturing Market Volume, By Country, 2021-2030, Thousand Units

FIGURE 148.                        Media & Entertainment Market Value, By Region, 2021-2030, Million USD

FIGURE 149.                        Media & Entertainment Market Volume, By Region, 2021-2030, Thousand Units

FIGURE 150.                        North America Media & Entertainment Market Value, By Country, 2021-2030, Million USD

FIGURE 151.                        North America Media & Entertainment Market Volume, By Country, 2021-2030, Thousand Units

FIGURE 152.                        Europe Media & Entertainment Market Value, By Country, 2021-2030, Million USD

FIGURE 153.                        Europe Media & Entertainment Market Volume, By Country, 2021-2030, Thousand Units

FIGURE 154.                        Asia-Pacific Media & Entertainment Market Value, By Country, 2021-2030, Million USD

FIGURE 155.                        Asia-Pacific Media & Entertainment Market Volume, By Country, 2021-2030, Thousand Units

FIGURE 156.                        Rest of the World Media & Entertainment Market Value, By Country, 2021-2030, Million USD

FIGURE 157.                        Rest of the World Media & Entertainment Market Volume, By Country, 2021-2030, Thousand Units

FIGURE 158.                        Others Market Value, By Region, 2021-2030, Million USD

FIGURE 159.                        Others Market Volume, By Region, 2021-2030, Thousand Units

FIGURE 160.                        North America Others Market Value, By Country, 2021-2030, Million USD

FIGURE 161.                        North America Others Market Volume, By Country, 2021-2030, Thousand Units

FIGURE 162.                        Europe Others Market Value, By Country, 2021-2030, Million USD

FIGURE 163.                        Europe Others Market Volume, By Country, 2021-2030, Thousand Units

FIGURE 164.                        Asia-Pacific Others Market Value, By Country, 2021-2030, Million USD

FIGURE 165.                        Asia-Pacific Others Market Volume, By Country, 2021-2030, Thousand Units

FIGURE 166.                        Rest of the World Others Market Value, By Country, 2021-2030, Million USD

FIGURE 167.                        Rest of the World Others Market Volume, By Country, 2021-2030, Thousand Units

FIGURE 168.                        Global Industrial Robotics Market Value, By Region, 2021-2030, Million USD

FIGURE 169.                        Global Industrial Robotics Market Volume, By Region, 2021-2030, Thousand Units

FIGURE 170.                        North America Industrial Robotics Market Value, By Type, 2021-2030, Million USD

FIGURE 171.                        North America Industrial Robotics Market Volume, By Type, 2021-2030, Thousand Units

FIGURE 172.                        North America Industrial Robotics Market Value, By Mobility, 2021-2030, Million USD

FIGURE 173.                        North America Industrial Robotics Market Volume, By Mobility, 2021-2030, Thousand Units

FIGURE 174.                        North America Industrial Robotics Market Value, By End User, 2021-2030, Million USD

FIGURE 175.                        North America Industrial Robotics Market Volume, By End User, 2021-2030, Thousand Units

FIGURE 176.                        North America Industrial Robotics Market Value, By Country, 2021-2030, Million USD

FIGURE 177.                        North America Industrial Robotics Market Volume, By Country, 2021-2030, Thousand Units

FIGURE 178.                        U.S. Industrial Robotics Market Value, By Type, 2021-2030, Million USD

FIGURE 179.                        U.S. Industrial Robotics Market Volume, By Type, 2021-2030, Thousand Units

FIGURE 180.                        U.S. Industrial Robotics Market Value, By Mobility, 2021-2030, Million USD

FIGURE 181.                        U.S. Industrial Robotics Market Volume, By Mobility, 2021-2030, Thousand Units

FIGURE 182.                        U.S. Industrial Robotics Market Value, By End User, 2021-2030, Million USD

FIGURE 183.                        U.S. Industrial Robotics Market Volume, By End User, 2021-2030, Thousand Units

FIGURE 184.                        Canada Industrial Robotics Market Value, By Type, 2021-2030, Million USD

FIGURE 185.                        Canada Industrial Robotics Market Volume, By Type, 2021-2030, Thousand Units

FIGURE 186.                        Canada Industrial Robotics Market Value, By Mobility, 2021-2030, Million USD

FIGURE 187.                        Canada Industrial Robotics Market Volume, By Mobility, 2021-2030, Thousand Units

FIGURE 188.                        Canada Industrial Robotics Market Value, By End User, 2021-2030, Million USD

FIGURE 189.                        Canada Industrial Robotics Market Volume, By End User, 2021-2030, Thousand Units

FIGURE 190.                        Mexico Industrial Robotics Market Value, By Type, 2021-2030, Million USD

FIGURE 191.                        Mexico Industrial Robotics Market Volume, By Type, 2021-2030, Thousand Units

FIGURE 192.                        Mexico Industrial Robotics Market Value, By Mobility, 2021-2030, Million USD

FIGURE 193.                        Mexico Industrial Robotics Market Volume, By Mobility, 2021-2030, Thousand Units

FIGURE 194.                        Mexico Industrial Robotics Market Value, By End User, 2021-2030, Million USD

FIGURE 195.                        Mexico Industrial Robotics Market Volume, By End User, 2021-2030, Thousand Units

FIGURE 196.                        Europe Industrial Robotics Market Value, By Type, 2021-2030, Million USD

FIGURE 197.                        Europe Industrial Robotics Market Volume, By Type, 2021-2030, Thousand Units

FIGURE 198.                        Europe Industrial Robotics Market Value, By Mobility, 2021-2030, Million USD

FIGURE 199.                        Europe Industrial Robotics Market Volume, By Mobility, 2021-2030, Thousand Units

FIGURE 200.                        Europe Industrial Robotics Market Value, By End User, 2021-2030, Million USD

FIGURE 201.                        Europe Industrial Robotics Market Volume, By End User, 2021-2030, Thousand Units

FIGURE 202.                        Europe Industrial Robotics Market Value, By Country, 2021-2030, Million USD

FIGURE 203.                        Europe Industrial Robotics Market Volume, By Country, 2021-2030, Thousand Units

FIGURE 204.                        UK Industrial Robotics Market Value, By Type, 2021-2030, Million USD

FIGURE 205.                        UK Industrial Robotics Market Volume, By Type, 2021-2030, Thousand Units

FIGURE 206.                        UK Industrial Robotics Market Value, By Mobility, 2021-2030, Million USD

FIGURE 207.                        UK Industrial Robotics Market Volume, By Mobility, 2021-2030, Thousand Units

FIGURE 208.                        UK Industrial Robotics Market Value, By End User, 2021-2030, Million USD

FIGURE 209.                        UK Industrial Robotics Market Volume, By End User, 2021-2030, Thousand Units

FIGURE 210.                        Germany Industrial Robotics Market Value, By Type, 2021-2030, Million USD

FIGURE 211.                        Germany Industrial Robotics Market Volume, By Type, 2021-2030, Thousand Units

FIGURE 212.                        Germany Industrial Robotics Market Value, By Mobility, 2021-2030, Million USD

FIGURE 213.                        Germany Industrial Robotics Market Volume, By Mobility, 2021-2030, Thousand Units

FIGURE 214.                        Germany Industrial Robotics Market Value, By End User, 2021-2030, Million USD

FIGURE 215.                        Germany Industrial Robotics Market Volume, By End User, 2021-2030, Thousand Units

FIGURE 216.                        France Industrial Robotics Market Value, By Type, 2021-2030, Million USD

FIGURE 217.                        France Industrial Robotics Market Volume, By Type, 2021-2030, Thousand Units

FIGURE 218.                        France Industrial Robotics Market Value, By Mobility, 2021-2030, Million USD

FIGURE 219.                        France Industrial Robotics Market Volume, By Mobility, 2021-2030, Thousand Units

FIGURE 220.                        France Industrial Robotics Market Value, By End User, 2021-2030, Million USD

FIGURE 221.                        France Industrial Robotics Market Volume, By End User, 2021-2030, Thousand Units

FIGURE 222.                        Spain Industrial Robotics Market Value, By Type, 2021-2030, Million USD

FIGURE 223.                        Spain Industrial Robotics Market Volume, By Type, 2021-2030, Thousand Units

FIGURE 224.                        Spain Industrial Robotics Market Value, By Mobility, 2021-2030, Million USD

FIGURE 225.                        Spain Industrial Robotics Market Volume, By Mobility, 2021-2030, Thousand Units

FIGURE 226.                        Spain Industrial Robotics Market Value, By End User, 2021-2030, Million USD

FIGURE 227.                        Spain Industrial Robotics Market Volume, By End User, 2021-2030, Thousand Units

FIGURE 228.                        Italy Industrial Robotics Market Value, By Type, 2021-2030, Million USD

FIGURE 229.                        Italy Industrial Robotics Market Volume, By Type, 2021-2030, Thousand Units

FIGURE 230.                        Italy Industrial Robotics Market Value, By Mobility, 2021-2030, Million USD

FIGURE 231.                        Italy Industrial Robotics Market Volume, By Mobility, 2021-2030, Thousand Units

FIGURE 232.                        Italy Industrial Robotics Market Value, By End User, 2021-2030, Million USD

FIGURE 233.                        Italy Industrial Robotics Market Volume, By End User, 2021-2030, Thousand Units

FIGURE 234.                        Netherlands Industrial Robotics Market Value, By Type, 2021-2030, Million USD

FIGURE 235.                        Netherlands Industrial Robotics Market Volume, By Type, 2021-2030, Thousand Units

FIGURE 236.                        Netherlands Industrial Robotics Market Value, By Mobility, 2021-2030, Million USD

FIGURE 237.                        Netherlands Industrial Robotics Market Volume, By Mobility, 2021-2030, Thousand Units

FIGURE 238.                        Netherlands Industrial Robotics Market Value, By End User, 2021-2030, Million USD

FIGURE 239.                        Netherlands Industrial Robotics Market Volume, By End User, 2021-2030, Thousand Units

FIGURE 240.                        Rest of Europe Industrial Robotics Market Value, By Type, 2021-2030, Million USD

FIGURE 241.                        Rest of Europe Industrial Robotics Market Volume, By Type, 2021-2030, Thousand Units

FIGURE 242.                        Rest of Europe Industrial Robotics Market Value, By Mobility, 2021-2030, Million USD

FIGURE 243.                        Rest of Europe Industrial Robotics Market Volume, By Mobility, 2021-2030, Thousand Units

FIGURE 244.                        Rest of Europe Industrial Robotics Market Value, By End User, 2021-2030, Million USD

FIGURE 245.                        Rest of Europe Industrial Robotics Market Volume, By End User, 2021-2030, Thousand Units

FIGURE 246.                        Asia-Pacific Industrial Robotics Market Value, By Type, 2021-2030, Million USD

FIGURE 247.                        Asia-Pacific Industrial Robotics Market Volume, By Type, 2021-2030, Thousand Units

FIGURE 248.                        Asia-Pacific Industrial Robotics Market Value, By Mobility, 2021-2030, Million USD

FIGURE 249.                        Asia-Pacific Industrial Robotics Market Volume, By Mobility, 2021-2030, Thousand Units

FIGURE 250.                        Asia-Pacific Industrial Robotics Market Value, By End User, 2021-2030, Million USD

FIGURE 251.                        Asia-Pacific Industrial Robotics Market Volume, By End User, 2021-2030, Thousand Units

FIGURE 252.                        Asia-Pacific Industrial Robotics Market Value, By Country, 2021-2030, Million USD

FIGURE 253.                        Asia-Pacific Industrial Robotics Market Volume, By Country, 2021-2030, Thousand Units

FIGURE 254.                        China Industrial Robotics Market Value, By Type, 2021-2030, Million USD

FIGURE 255.                        China Industrial Robotics Market Volume, By Type, 2021-2030, Thousand Units

FIGURE 256.                        China Industrial Robotics Market Value, By Mobility, 2021-2030, Million USD

FIGURE 257.                        China Industrial Robotics Market Volume, By Mobility, 2021-2030, Thousand Units

FIGURE 258.                        China Industrial Robotics Market Value, By End User, 2021-2030, Million USD

FIGURE 259.                        China Industrial Robotics Market Volume, By End User, 2021-2030, Thousand Units

FIGURE 260.                        Japan Industrial Robotics Market Value, By Type, 2021-2030, Million USD

FIGURE 261.                        Japan Industrial Robotics Market Volume, By Type, 2021-2030, Thousand Units

FIGURE 262.                        Japan Industrial Robotics Market Value, By Mobility, 2021-2030, Million USD

FIGURE 263.                        Japan Industrial Robotics Market Volume, By Mobility, 2021-2030, Thousand Units

FIGURE 264.                        Japan Industrial Robotics Market Value, By End User, 2021-2030, Million USD

FIGURE 265.                        Japan Industrial Robotics Market Volume, By End User, 2021-2030, Thousand Units

FIGURE 266.                        India Industrial Robotics Market Value, By Type, 2021-2030, Million USD

FIGURE 267.                        India Industrial Robotics Market Volume, By Type, 2021-2030, Thousand Units

FIGURE 268.                        India Industrial Robotics Market Value, By Mobility, 2021-2030, Million USD

FIGURE 269.                        India Industrial Robotics Market Volume, By Mobility, 2021-2030, Thousand Units

FIGURE 270.                        India Industrial Robotics Market Value, By End User, 2021-2030, Million USD

FIGURE 271.                        India Industrial Robotics Market Volume, By End User, 2021-2030, Thousand Units

FIGURE 272.                        Australia Industrial Robotics Market Value, By Type, 2021-2030, Million USD

FIGURE 273.                        Australia Industrial Robotics Market Volume, By Type, 2021-2030, Thousand Units

FIGURE 274.                        Australia Industrial Robotics Market Value, By Mobility, 2021-2030, Million USD

FIGURE 275.                        Australia Industrial Robotics Market Volume, By Mobility, 2021-2030, Thousand Units

FIGURE 276.                        Australia Industrial Robotics Market Value, By End User, 2021-2030, Million USD

FIGURE 277.                        Australia Industrial Robotics Market Volume, By End User, 2021-2030, Thousand Units

FIGURE 278.                        South Korea Industrial Robotics Market Value, By Type, 2021-2030, Million USD

FIGURE 279.                        South Korea Industrial Robotics Market Volume, By Type, 2021-2030, Thousand Units

FIGURE 280.                        South Korea Industrial Robotics Market Value, By Mobility, 2021-2030, Million USD

FIGURE 281.                        South Korea Industrial Robotics Market Volume, By Mobility, 2021-2030, Thousand Units

FIGURE 282.                        South Korea Industrial Robotics Market Value, By End User, 2021-2030, Million USD

FIGURE 283.                        South Korea Industrial Robotics Market Volume, By End User, 2021-2030, Thousand Units

FIGURE 284.                        Taiwan Industrial Robotics Market Value, By Type, 2021-2030, Million USD

FIGURE 285.                        Taiwan Industrial Robotics Market Volume, By Type, 2021-2030, Thousand Units

FIGURE 286.                        Taiwan Industrial Robotics Market Value, By Mobility, 2021-2030, Million USD

FIGURE 287.                        Taiwan Industrial Robotics Market Volume, By Mobility, 2021-2030, Thousand Units

FIGURE 288.                        Taiwan Industrial Robotics Market Value, By End User, 2021-2030, Million USD

FIGURE 289.                        Taiwan Industrial Robotics Market Volume, By End User, 2021-2030, Thousand Units

FIGURE 290.                        Vietnam Industrial Robotics Market Value, By Type, 2021-2030, Million USD

FIGURE 291.                        Vietnam Industrial Robotics Market Volume, By Type, 2021-2030, Thousand Units

FIGURE 292.                        Vietnam Industrial Robotics Market Value, By Mobility, 2021-2030, Million USD

FIGURE 293.                        Vietnam Industrial Robotics Market Volume, By Mobility, 2021-2030, Thousand Units

FIGURE 294.                        Vietnam Industrial Robotics Market Value, By End User, 2021-2030, Million USD

FIGURE 295.                        Vietnam Industrial Robotics Market Volume, By End User, 2021-2030, Thousand Units

FIGURE 296.                        Rest of Asia-Pacific Industrial Robotics Market Value, By Type, 2021-2030, Million USD

FIGURE 297.                        Rest of Asia-Pacific Industrial Robotics Market Volume, By Type, 2021-2030, Thousand Units

FIGURE 298.                        Rest of Asia-Pacific Industrial Robotics Market Value, By Mobility, 2021-2030, Million USD

FIGURE 299.                        Rest of Asia-Pacific Industrial Robotics Market Volume, By Mobility, 2021-2030, Thousand Units

FIGURE 300.                        Rest of Asia-Pacific Industrial Robotics Market Value, By End User, 2021-2030, Million USD

FIGURE 301.                        Rest of Asia-Pacific Industrial Robotics Market Volume, By End User, 2021-2030, Thousand Units

FIGURE 302.                        Rest of the World Industrial Robotics Market Value, By Type, 2021-2030, Million USD

FIGURE 303.                        Rest of the World Industrial Robotics Market Volume, By Type, 2021-2030, Thousand Units

FIGURE 304.                        Rest of the World Industrial Robotics Market Value, By Mobility, 2021-2030, Million USD

FIGURE 305.                        Rest of the World Industrial Robotics Market Volume, By Mobility, 2021-2030, Thousand Units

FIGURE 306.                        Rest of the World Industrial Robotics Market Value, By End User, 2021-2030, Million USD

FIGURE 307.                        Rest of the World Industrial Robotics Market Volume, By End User, 2021-2030, Thousand Units

FIGURE 308.                        Rest of the World Industrial Robotics Market Value, By Country, 2021-2030, Million USD

FIGURE 309.                        Rest of the World Industrial Robotics Market Volume, By Country, 2021-2030, Thousand Units

FIGURE 310.                        Latin America Industrial Robotics Market Value, By Type, 2021-2030, Million USD

FIGURE 311.                        Latin America Industrial Robotics Market Volume, By Type, 2021-2030, Thousand Units

FIGURE 312.                        Latin America Industrial Robotics Market Value, By Mobility, 2021-2030, Million USD

FIGURE 313.                        Latin America Industrial Robotics Market Volume, By Mobility, 2021-2030, Thousand Units

FIGURE 314.                        Latin America Industrial Robotics Market Value, By End User, 2021-2030, Million USD

FIGURE 315.                        Latin America Industrial Robotics Market Volume, By End User, 2021-2030, Thousand Units

FIGURE 316.                        Middle East Industrial Robotics Market Value, By Type, 2021-2030, Million USD

FIGURE 317.                        Middle East Industrial Robotics Market Volume, By Type, 2021-2030, Thousand Units

FIGURE 318.                        Middle East Industrial Robotics Market Value, By Mobility, 2021-2030, Million USD

FIGURE 319.                        Middle East Industrial Robotics Market Volume, By Mobility, 2021-2030, Thousand Units

FIGURE 320.                        Middle East Industrial Robotics Market Value, By End User, 2021-2030, Million USD

FIGURE 321.                        Middle East Industrial Robotics Market Volume, By End User, 2021-2030, Thousand Units

FIGURE 322.                        Africa Industrial Robotics Market Value, By Type, 2021-2030, Million USD

FIGURE 323.                        Africa Industrial Robotics Market Volume, By Type, 2021-2030, Thousand Units

FIGURE 324.                        Africa Industrial Robotics Market Value, By Mobility, 2021-2030, Million USD

FIGURE 325.                        Africa Industrial Robotics Market Volume, By Mobility, 2021-2030, Thousand Units

FIGURE 326.                        Africa Industrial Robotics Market Value, By End User, 2021-2030, Million USD

FIGURE 327.                        Africa Industrial Robotics Market Volume, By End User, 2021-2030, Thousand Units

FIGURE 328.                        ABB : NET SALES, 2018–2020 ($Million)

FIGURE 329.                        ABB: Primary Market Competitors

FIGURE 330.                        KUKA AG: NET SALES, 2018–2020 ($MILLION)

FIGURE 331.                        KUKA AG: Primary Market Competitors

FIGURE 332.                        FANUC : NET SALES, 2018–2020 ($MILLION)

FIGURE 333.                        FANUC.: Primary Market Competitors

FIGURE 334.                        YASKAWA ELECTRIC CORPORATION: NET SALES, 2018–2020 ($MILLION)

FIGURE 335.                        YASKAWA ELECTRIC CORPORATION.: Primary Market Competitors

FIGURE 336.                        DENSO CORPORATION: NET SALES, 2018–2020 ($BILLION)

FIGURE 337.                        DENSO ROBOTICS.: Primary Market Competitors

FIGURE 338.                        Universal Robots: Primary Market Competitors

FIGURE 339.                        NACHI-FUJIKOSHI CORP. : NET SALES, 2018–2020 ($BILLION)

FIGURE 340.                        NACHI-FUJIKOSHI CORP.: Primary Market Competitors

FIGURE 341.                        OMRON CORPORATION : NET SALES, 2018–2020 ($MILLION)

FIGURE 342.                        OMRON CORPORATION.: Primary Market Competitors

FIGURE 343.                        Rethink Robotics GmbH: Primary Market Competitors

FIGURE 344.                        KAWASAKI HEAVY INDUSTRIES LTD. : NET SALES, 2018–2020 ($MILLION)

FIGURE 345.                        KAWASAKI HEAVY INDUSTRIES LTD.: Primary Market Competitors

FIGURE 346.                        KRONES AG: NET SALES, 2018–2020 ($MILLION)

FIGURE 347.                        KRONES AG: Primary Market Competitors

FIGURE 348.                        MITSUBISHI ELECTRIC CORP. : NET SALES, 2018–2020 ($MILLION)

FIGURE 349.                        MITSUBISHI ELECTRIC CORP: Primary Market Competitors

FIGURE 350.                        BRENTON LLC: Primary Market Competitors

FIGURE 351.                        Doosan Robotics Inc.: Primary Market Competitors

FIGURE 352.                        Panasonic: NET SALES, 2018–2020 ($MILLION)

FIGURE 353.                        panasonic corporation: Primary Market Competitors

FIGURE 354.                        Comau S.p.A.: Primary Market Competitors

FIGURE 355.                        TECHMAN ROBOT INC.: Primary Market Competitors

FIGURE 356.                        SCHNEIDER ELECTRIC S.E.: NET SALES, 2018–2020 ($MILLION)

FIGURE 357.                        SCHNEIDER ELECTRIC S.E.: Primary Market Competitors

FIGURE 358.                        Precise Automation: Primary Market Competitors


KEY PLAYERS:

  • ABB Ltd.

  • Yaskawa Electric Corporation

  • Mitsubishi Electric Corporation

  • Nachi-Fujikoshi Corp.

  • Comau Automation Company

  • KUKA Robotics Company

  • Fanuc Corporation

  • Denso Corporation

  • Kawasaki Heavy Industries, Ltd.

  • Omron Corporation


Frequently Asked Questions
What is the market size of the industrial robot’s market in 2023?

According to the report published by Next Move Strategy Consulting, the global Industrial Robotics market is valued at USD 40.61 billion in 2023.

Which are the major companies in the industrial Robotics market?

The major companies in the industrial Robotics market includes ABB Ltd., Yaskawa Electric Corporation, Mitsubishi Electric Corporation, Nachi-Fujikoshi Corp., Comau Automation Company, KUKA Robotics Company, Fanuc Corporation, Denso Corporation, Kawasaki Heavy Industries, Ltd. and Omron Corporation.

Which region is the fastest growing region in the industrial Robotics market?

The European region is the fastest growing region in the industrial Robotics market.

What is the estimated revenue of the global industrial Robotics market by the end of 2030?

According to the report published by Next Move Strategy Consulting, the global industrial Robotics market is expected to hit USD 90.35 billion by 2030.

What are the different application of industrial Robotics?

Industrial Robotics are used for varying purpose such as material handling, assembly, packaging, processing, welding and soldering, pick and place and others.