Insurtech Market

The Insurtech market size was USD 12.8 Billion in 2025, and is projected to reach USD 71.9 Billion by 2035 at an 18.5% CAGR from 2026 to 2035 worldwide.

Download Free Sample PDF
Base Year (2025)
$12.80 Billion
Forecast (2035)
$71.90 Billion
CAGR (2026-2035)
18.5%
Top Region
North America

What Is the Insurtech Market Size?

The Insurtech Market size was valued at USD 12.8 Billion in 2025 and is estimated at USD 15.6 Billion in 2026, forecast to reach USD 71.9 Billion by 2035, expanding at an 18.5% CAGR between 2026 and 2035. North America leads with approximately a 38% share, while Software platforms dominate all components with approximately a 34% share.

We observed that growth is concentrated in AI-driven claims and underwriting automation, with cloud-native platforms displacing legacy on-premises insurance core systems as digital-native carriers scale profitably through 2035.

Insurtech Market Revenue Forecast

Values in USD Billion

2025 $12.80 Billion
2025
2026 $15.60 Billion
2026
2027 $18.49 Billion
2027
2028 $21.91 Billion
2028
2029 $25.96 Billion
2029
2030 $30.76 Billion
2030
2031 $36.45 Billion
2031
2032 $43.20 Billion
2032
2033 $51.19 Billion
2033
2034 $60.66 Billion
2034
2035 $71.90 Billion
2035

Key Takeaways

By Component: Software platforms held the largest share of approximately 34% (USD 4.35 Billion) in 2025; Claims and underwriting automation solutions is the fastest-growing sub-segment at 21.84% CAGR from 2026–2035.

By Application: Property and casualty insurance held the largest share of approximately 27% (USD 3.46 Billion) in 2025; Business and commercial insurance is the fastest-growing sub-segment at 20.94% CAGR from 2026–2035.

By Deployment Model: Cloud held the largest share of approximately 71% (USD 9.09 Billion) in 2025 and is also the fastest-growing sub-segment at 20.89% CAGR from 2026–2035.

By Technology: AI and machine learning held the largest share of approximately 41% (USD 5.25 Billion) in 2025 and is also the fastest-growing sub-segment at 22.43% CAGR from 2026–2035.

By End User: Insurance carriers held the largest share of approximately 56% (USD 7.17 Billion) in 2025; Individual consumers is the fastest-growing sub-segment at 23.24% CAGR from 2026–2035.

Dominant Region: North America dominated with approximately 38% revenue share (USD 4.86 Billion) in 2025.

Fastest-Growing Region: Middle East & Africa is expected to register the highest CAGR of 25.38% during 2026–2035.

Dominant Country: The U.S. led the market with approximately USD 4.13 Billion in 2025.

Fastest-Growing Country: India is expected to register the highest CAGR of approximately 26.8% during 2026–2035.

Market Opportunity: The Insurtech market is expected to create an absolute dollar opportunity of USD 56.3 Billion between 2026 and 2035, presenting significant investment potential across AI-driven claims automation and cloud-native core platform technologies.

According to NMSC analysis, digital-native carriers are increasingly deploying AI across underwriting, pricing, and claims simultaneously rather than automating single workflow steps, a shift that favors platforms with integrated, end-to-end AI capability over point-solution vendors as carriers pursue profitability alongside continued premium growth through 2035.

Ecosystem Analysis of the Insurtech Industry

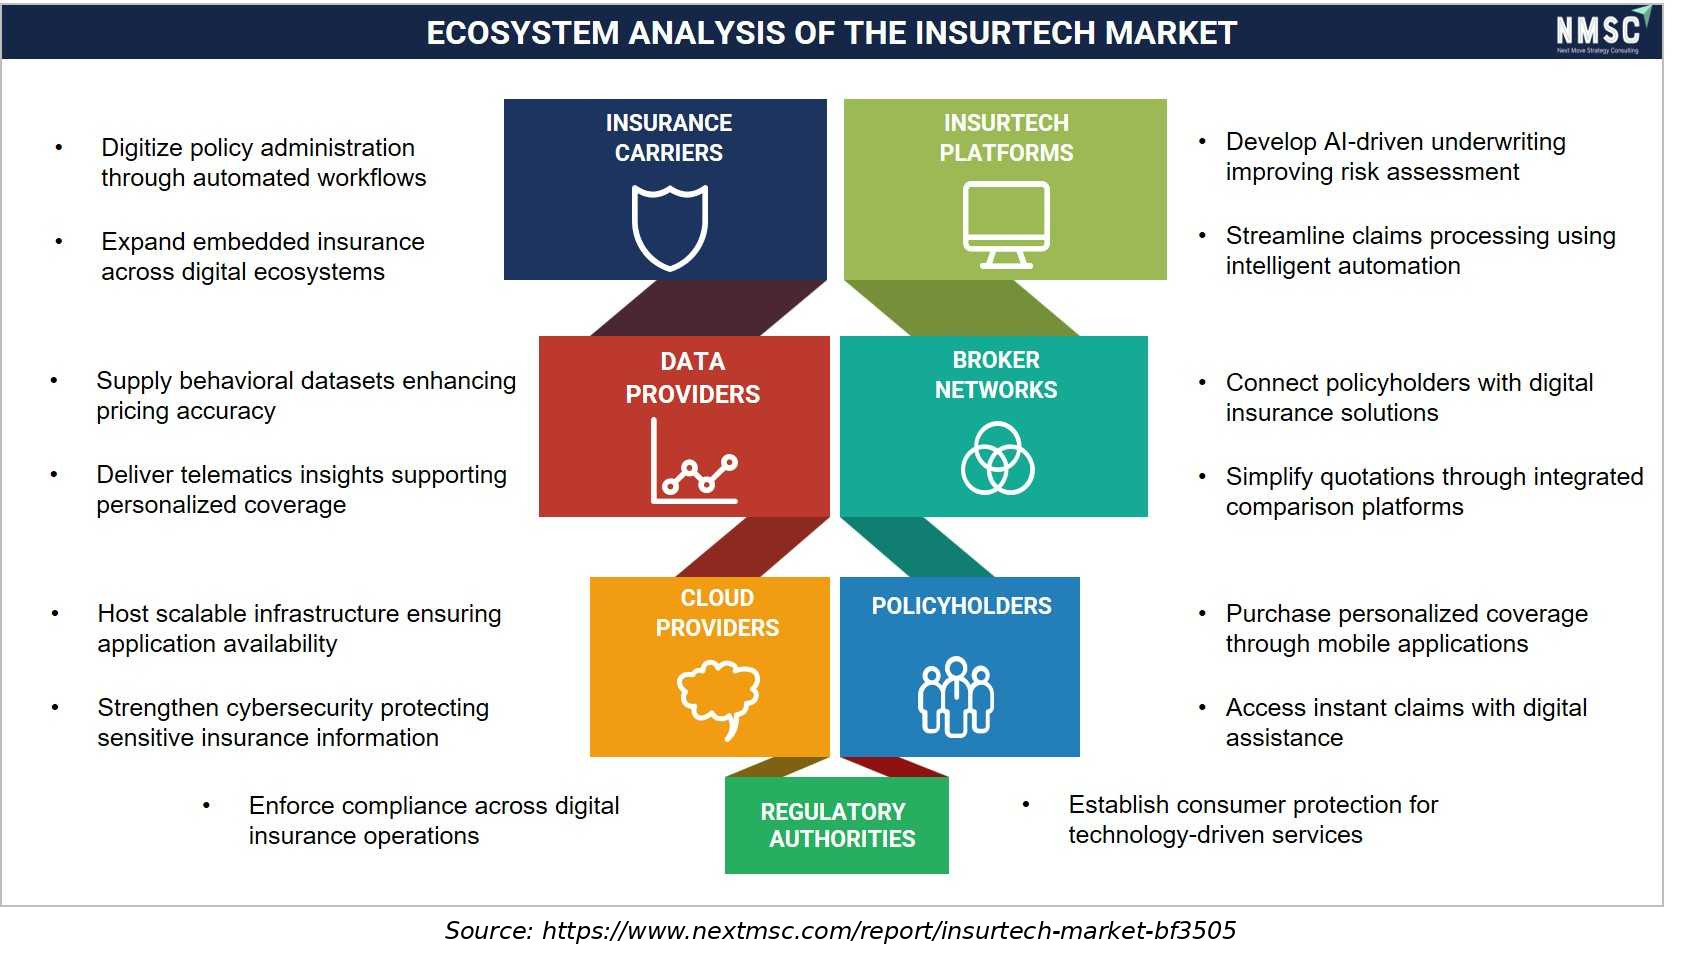
The above infographic presents an ecosystem analysis of the insurtech market, covering insurance carriers, insurtech platforms, data providers, cloud providers, distribution networks, regulatory authorities, and policyholders. AI-driven underwriting and intelligent automation are streamlining claims processing and improving risk assessment, while insurtech platforms enable embedded insurance across digital ecosystems and simplify quotation through integrated comparison tools. Data providers support analytics, and cloud providers host scalable infrastructure, while distribution networks connect policyholders with digital solutions. At the same time, regulatory authorities enforce compliance and cybersecurity measures to protect sensitive information. Looking ahead, we observed that these interconnected elements collectively shape the market's evolution across the insurance sector.

What Does the Insurtech Market Encompass?

The Insurtech Market encompasses software platforms, digital distribution solutions, and technology-enabled services that insurance carriers, brokers, and digital-native insurers use to underwrite, price, distribute, and administer insurance products. Our assessment indicates that the scope covers core policy administration platforms, claims and underwriting automation, data and analytics solutions, and cloud computing-based deployment models serving auto, health, life, and property and casualty insurance applications.
Regulatory frameworks, including state insurance department rate and underwriting model approval requirements and evolving data privacy statutes, increasingly shape how insurtech platforms deploy AI-driven pricing and claims models. We observed that technology adoption is shifting from single-function point solutions toward integrated platforms spanning underwriting, pricing, and claims automation within a unified data architecture. NMSC's analysis indicates that this structural shift, combined with digital-native carriers' continued progress toward underwriting profitability, is redefining vendor selection criteria across the insurtech value chain.

Market Drivers & Dynamics

Interactive Dataset
Rising AI adoption across underwriting and claims workflows driver +3.6% Global 2026-2035
Digital-native carrier progress toward underwriting profitability driver +2.4% North America, Europe 2026-2032
Expanding digital insurance distribution in underinsured markets driver +2.0% Asia-Pacific, Middle East & Africa 2026-2035
Growing cloud-native core platform replacement demand driver +1.5% Global 2026-2032
Rising commercial and business insurance digitalization driver +1.1% Global 2026-2035
Expanding embedded insurance distribution partnerships driver +0.8% Global 2028-2035
Regulatory scrutiny of AI-driven underwriting and pricing models restraint -1.3% North America, Europe 2026-2032
Persistent underwriting losses among early-stage digital carriers restraint -0.9% North America 2026-2030
Data privacy compliance costs across multiple jurisdictions restraint -0.6% Global 2026-2032
Source: Next Move Strategy Consulting

Growth Drivers

What Is the Primary Growth Driver of the Insurtech Market?

Rising AI adoption across underwriting and claims workflows is the primary driver of the market. Lemonade, Inc. reported full-year 2025 revenue of USD 738 million, up from USD 526.5 million in 2024, crediting AI-driven automation across underwriting, pricing, claims, and marketing. We observed that this AI-driven efficiency gain, reinforced by narrowing losses across major digital carriers, continues to anchor baseline demand for integrated insurtech platforms.

How Is Digital Carrier Profitability Progress Driving Market Growth?

Improving underwriting profitability among digital-native carriers is accelerating platform investment and reinvestment in technology capability. Hippo Holdings reported a swing to USD 98.1 million in net income in the third quarter of 2025, compared with an USD 8.5 million loss a year earlier, driven partly by improved underwriting metrics and combined ratio improvement to 100 from 127.9. Our assessment indicates that this profitability progress is compressing technology investment payback periods for digital carriers.

Growth Inhibitors

What Is Restraining Insurtech Market Expansion?

Regulatory scrutiny of AI-driven underwriting and pricing models restrains platform deployment speed across regulated jurisdictions. State insurance regulators continue to require rate and underwriting model filing approval before AI-driven pricing algorithms can be deployed commercially. We found that this regulatory review burden disproportionately affects smaller insurtech platforms with limited compliance resources compared with large, established carriers and software vendors.

What Are the Growth Opportunities?

How Can Platforms Capture Demand From Commercial Line Diversification?

Expanding digital carrier diversification into commercial and casualty lines creates a mechanism for insurtech platforms to capture underwriting automation contracts beyond personal lines. Vendors offering configurable commercial underwriting workflows stand to benefit most, as carriers seek to replicate personal-lines AI efficiency gains within more complex commercial risk assessment.

What Opportunity Does Embedded Insurance Present for Distribution Platforms?

Growing embedded insurance partnerships between digital carriers and non-insurance platforms create a mechanism for distribution technology vendors to capture point-of-sale insurance contracts. Platforms offering seamless API-based integration stand to benefit most, capturing partnerships with e-commerce, travel, and mobility platforms seeking to embed insurance products directly into their customer journeys.

How Can Vendors Unlock Underinsured Emerging Market Demand?

Rising mobile penetration across underinsured emerging markets creates a mechanism for insurtech platforms to reach first-time insurance buyers through simplified digital distribution. Vendors building lightweight, mobile-first platforms with blockchain-enabled claims verification stand to benefit most, capturing early-mover positioning in Asia-Pacific and Middle East & Africa markets.

Segmentation Analysis

2025 (USD Billion)
2035 (USD Billion)
Software platforms 2025: $4.35 Billion | 2035: $21.57 Billion
Software pla
Digital distribution and marketplace solutions 2025: $3.07 Billion | 2035: $15.82 Billion
Digital dist
Claims and underwriting automation solutions 2025: $2.69 Billion | 2035: $19.41 Billion
Claims and u
Data and analytics solutions 2025: $1.79 Billion | 2035: $11.50 Billion
Data and ana
Managed and support services 2025: $0.90 Billion | 2035: $3.60 Billion
Managed and
Software platforms $4.35 Billion $21.57 Billion 16.88%
Digital distribution and marketplace solutions $3.07 Billion $15.82 Billion 17.38%
Claims and underwriting automation solutions $2.69 Billion $19.41 Billion 21.84%
Data and analytics solutions $1.79 Billion $11.50 Billion 20.30%
Managed and support services $0.90 Billion $3.60 Billion 14.20%

Which Component Segment Dominates the Market?

Software platforms led the market with USD 4.35 Billion in 2025, supported by sustained core policy administration and pricing system replacement demand among established carriers. We observed that Claims and underwriting automation solutions is the fastest-growing component, expanding at a 21.84% CAGR from 2026 to 2035, as carriers increasingly deploy AI models to automate claims triage, fraud detection, and underwriting risk assessment simultaneously.

2025 (USD Billion)
2035 (USD Billion)
Auto insuran
Health insur
Property and
Life insuran
Business and
Segment Item 2025 (USD Billion) 2035 (USD Billion) CAGR
Auto insurance $10.0 USD Billion $40.0 USD Billion 18.0%
Health insurance $17.1 USD Billion $51.1 USD Billion 16.0%
Property and casualty insurance $24.2 USD Billion $62.2 USD Billion 22.0%
Life insurance $31.3 USD Billion $73.3 USD Billion 12.0%
Business and commercial insurance $38.4 USD Billion $84.4 USD Billion 19.0%

Segment-wise data is locked

Unlock complete segment-wise numbers for By Application.

Unlock Full Data

Which Application Segment Leads the Market?

Property and casualty insurance led the market with USD 3.46 Billion in 2025, supported by sustained digital carrier expansion across homeowners, renters, and commercial multiperil lines. Business and commercial insurance is the fastest-growing application, expanding at a 20.94% CAGR from 2026 to 2035, as digital carriers increasingly diversify into commercial lines to reduce volatility and improve underwriting margins beyond single-product exposure.

2025 (USD Billion)
2035 (USD Billion)
Cloud
On-premises
Segment Item 2025 (USD Billion) 2035 (USD Billion) CAGR
Cloud $10.0 USD Billion $40.0 USD Billion 18.0%
On-premises $17.1 USD Billion $51.1 USD Billion 24.0%

Segment-wise data is locked

Unlock complete segment-wise numbers for By Deployment Model.

Unlock Full Data
2025 (USD Billion)
2035 (USD Billion)
AI and machi
Blockchain
IoT and tele
Big data and
Other techno
Segment Item 2025 (USD Billion) 2035 (USD Billion) CAGR
AI and machine learning $10.0 USD Billion $40.0 USD Billion 16.0%
Blockchain $17.1 USD Billion $51.1 USD Billion 22.0%
IoT and telematics $24.2 USD Billion $62.2 USD Billion 16.0%
Big data and analytics $31.3 USD Billion $73.3 USD Billion 26.0%
Other technologies $38.4 USD Billion $84.4 USD Billion 25.0%

Segment-wise data is locked

Unlock complete segment-wise numbers for By Technology.

Unlock Full Data
2025 (USD Billion)
2035 (USD Billion)
Insurance ca
Insurance br
Individual c
Enterprises
Segment Item 2025 (USD Billion) 2035 (USD Billion) CAGR
Insurance carriers $10.0 USD Billion $40.0 USD Billion 26.0%
Insurance brokers and agents $17.1 USD Billion $51.1 USD Billion 16.0%
Individual consumers $24.2 USD Billion $62.2 USD Billion 18.0%
Enterprises $31.3 USD Billion $73.3 USD Billion 8.0%

Segment-wise data is locked

Unlock complete segment-wise numbers for By End User.

Unlock Full Data

Porter's Five Forces Analysis of the Insurtech Market

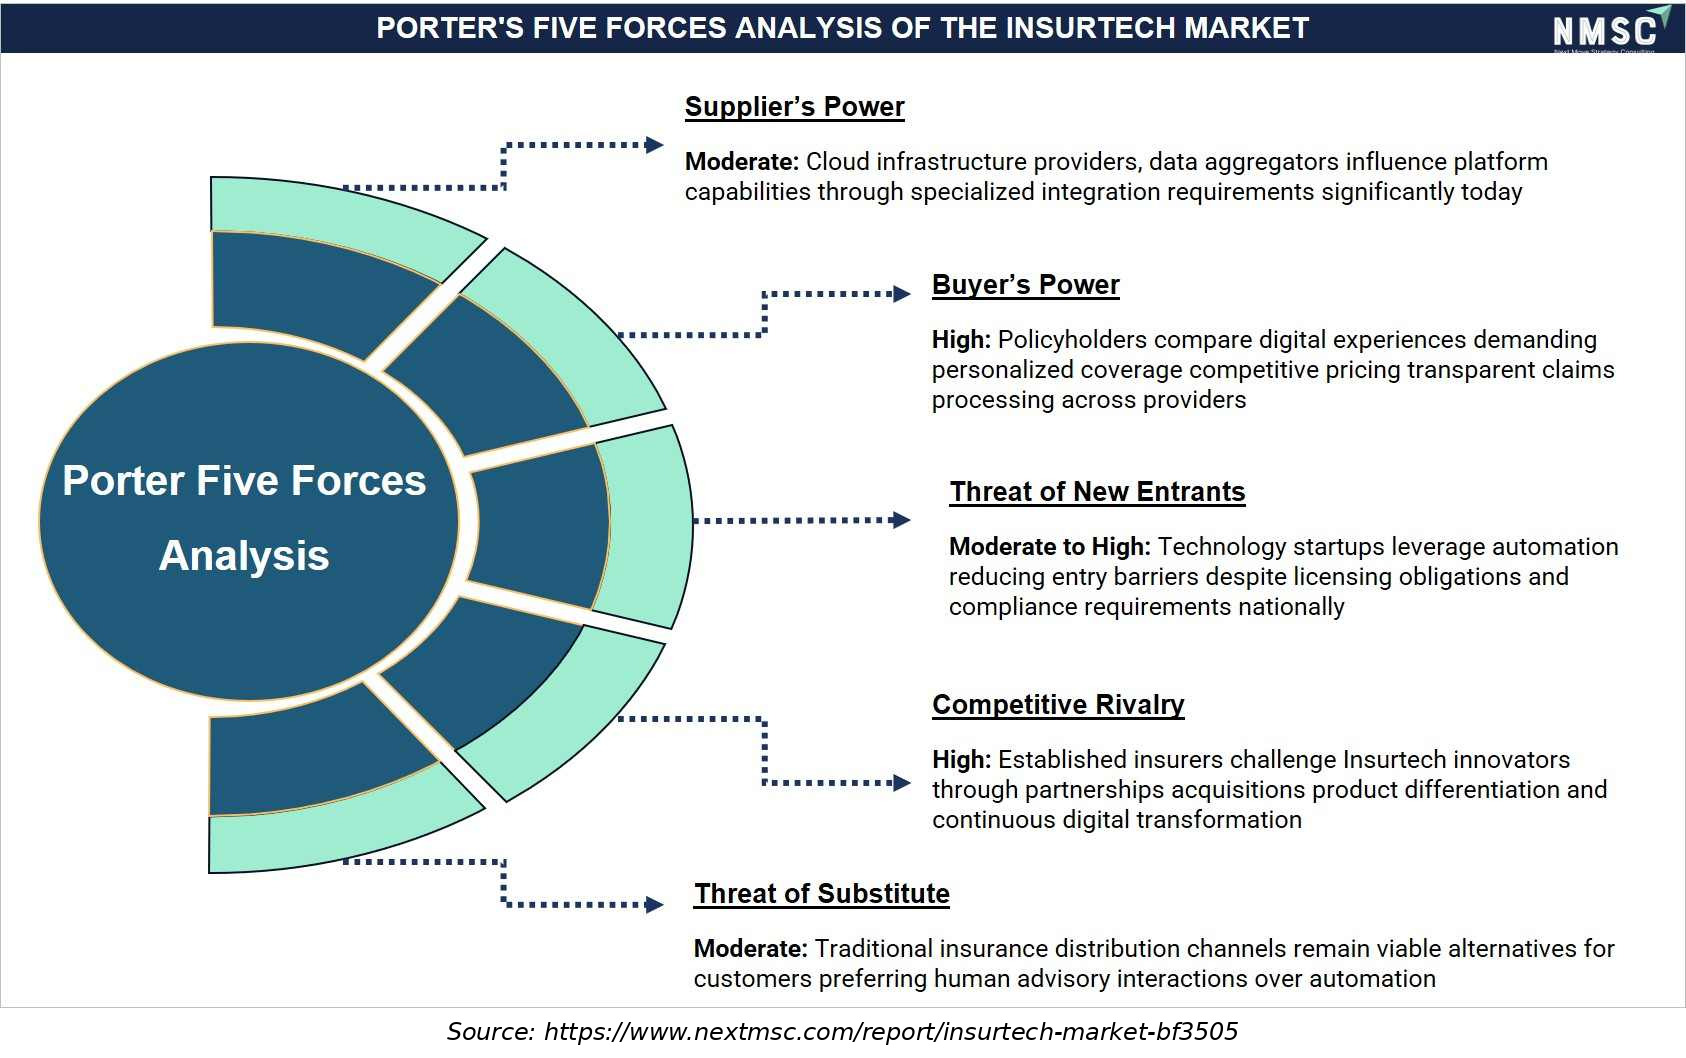
The above infographic presents a Porter's Five Forces analysis of the insurtech market, where supplier power remains moderate due to reliance on cloud providers and data aggregators. At the same time, buyer power is high as policyholders compare digital experiences and claim processing across providers. The threat of new entrants is moderate to high, as technology startups leverage automation to reduce entry barriers despite licensing and compliance requirements. Competitive rivalry is intense between established insurers and insurtech innovators competing through partnerships, acquisitions, and digital transformation. Looking ahead, we observed that the threat of substitutes stays moderate, as traditional insurance channels remain viable for customers who prefer human advisory interactions over automation.

Growth Opportunities

We found that three forward-looking whitespace opportunities stand out for stakeholders positioning within the Insurtech market over the coming decade.

How Can Platforms Capture Demand From Commercial Line Diversification?

Expanding digital carrier diversification into commercial and casualty lines creates a mechanism for insurtech platforms to capture underwriting automation contracts beyond personal lines. Vendors offering configurable commercial underwriting workflows stand to benefit most, as carriers seek to replicate personal-lines AI efficiency gains within more complex commercial risk assessment.

What Opportunity Does Embedded Insurance Present for Distribution Platforms?

Growing embedded insurance partnerships between digital carriers and non-insurance platforms create a mechanism for distribution technology vendors to capture point-of-sale insurance contracts. Platforms offering seamless API-based integration stand to benefit most, capturing partnerships with e-commerce, travel, and mobility platforms seeking to embed insurance products directly into their customer journeys.

How Can Vendors Unlock Underinsured Emerging Market Demand?

Rising mobile penetration across underinsured emerging markets creates a mechanism for insurtech platforms to reach first-time insurance buyers through simplified digital distribution. Vendors building lightweight, mobile-first platforms with blockchain-enabled claims verification stand to benefit most, capturing early-mover positioning in Asia-Pacific and Middle East & Africa markets.

Regional Outlook

2025 (USD Billion)
2035 (USD Billion)
North Americ
Europe
Asia-Pacific
Middle East
Latin Americ
Region 2025 (USD Billion) 2035 (USD Billion) CAGR (%)
North America $10.0 USD Billion $40.0 USD Billion 9.0%
Europe $17.1 USD Billion $51.1 USD Billion 27.0%
Asia-Pacific $24.2 USD Billion $62.2 USD Billion 25.0%
Middle East & Africa $31.3 USD Billion $73.3 USD Billion 23.0%
Latin America $38.4 USD Billion $84.4 USD Billion 12.0%

Regional data is locked

Unlock complete regional numbers for this market.

Unlock Full Data

Competitive Landscape

We observed that the Insurtech market features a moderately fragmented competitive landscape, with established insurance core software vendors competing alongside digital-native carriers and specialized automation platforms on technology capability, distribution reach, and underwriting performance. Key Takeaways

Dimension Description
Market Structure Moderately fragmented; leading software platform vendors and digital-native carriers profiled in this report collectively account for a significant share of branded insurtech revenue, while regional platforms serve smaller national market demand.
Innovation Focus AI-driven underwriting and claims automation, cloud-native core platform architecture, and telematics-based pricing dominate current innovation pipelines across leading vendors and carriers.
M&A Activity Selective reinsurance and distribution restructuring, exemplified by Lemonade's reduced reinsurance cession ratio and Hippo Holdings' sale of its homebuilder distribution network to focus on core underwriting.

How Do Companies Compete in the Insurtech Market?

Companies compete primarily on AI-driven underwriting accuracy, platform breadth, and demonstrated profitability progress across the industry. Established core system vendors such as Guidewire Software and Sapiens International leverage broad carrier customer bases to serve traditional insurers, while digital-native carriers such as Lemonade and Hippo Holdings compete on direct-to-consumer AI-driven pricing and claims automation capability.

Which Competitive Archetypes Dominate the Insurtech Market?

Two archetypes dominate the market: established insurance core software vendors offering policy administration and claims platforms to traditional carriers, and digital-native insurance carriers building proprietary AI-driven underwriting and distribution capability. Guidewire Software and Duck Creek Technologies exemplify the software vendor archetype, while Lemonade and Root exemplify the digital-native carrier archetype pursuing direct underwriting profitability through AI automation.

How Are Companies Differentiating Through Innovation in Insurtech?

Innovation and differentiation strategy increasingly center on integrated AI capability spanning underwriting, pricing, and claims. Lemonade's AI-driven telematics pricing for human and autonomous vehicle miles and its continued investment in cross-sell pricing engines both reflect efforts to secure differentiated positioning among cost-conscious digital insurance consumers. Our analysis shows that carriers unable to demonstrate integrated AI capability risk losing customers to more automated competitors.

What M&A and Expansion Activity Is Shaping the Market?

Portfolio restructuring and reinsurance strategy shifts continue to reshape competitive positioning within the industry. Hippo Holdings' sale of its homebuilder distribution network for a USD 91 million gain and Lemonade's reduced reinsurance cession ratio from 55% to 20% both illustrate how digital carriers are prioritizing core underwriting profitability and capital retention over broader distribution expansion.

Key Market Players

Our assessment indicates that the following companies are actively shaping platform innovation, underwriting capability, and distribution reach within the Insurtech market.

Lemonade, Inc. Root, Inc. Hippo Holdings Inc. Guidewire Software, Inc. Duck Creek Technologies, LLC Sapiens International Corporation N.V. Shift Technology SAS Tractable Ltd Zhong An Online P&C Insurance Co., Ltd. Waterdrop Inc. PB Fintech Limited Acko General Insurance Limited Go Digit General Insurance Limited wefox Holding AG Bolttech Management Pte. Ltd. Next Insurance, Inc. Cover Genius Pty Ltd EIS Ltd Company 19 Company 20

Latest Developments

We found that recent financial results and strategic actions within the insurtech supply chain are concentrated on AI-driven profitability improvement and portfolio diversification.

Date Event
June 2026 Lemonade launched Lemonade Autonomous Car insurance for Tesla drivers in Indiana. The AI-powered product uses telematics and driving data from Tesla's Full Self-Driving (Supervised) technology to provide usage-based pricing and automated underwriting, reflecting continued innovation in digital insurance models.
May 2026 Cover Genius announced an expanded partnership with Turkish Airlines to deliver embedded travel protection through its global XCover distribution platform.

Investment Opportunities

What Capital Inflows Are Supporting the Insurtech Market?

Digital carriers and software vendors are directing capital toward AI-driven underwriting capability and core platform modernization. Lemonade's improved capital retention following its reduced reinsurance cession and Hippo Holdings' reinvestment of its homebuilder network sale proceeds illustrate sustained capital allocation toward core underwriting and technology capability.

How Is Infrastructure Investment Shaping Insurtech Demand?

Cloud infrastructure and mobile network investment continues to expand the addressable base for digital insurance distribution, particularly across underinsured emerging markets. Our assessment indicates that expanding mobile payment and cloud infrastructure investment in Asia-Pacific and Middle East & Africa is creating multi-year procurement pipelines for insurtech platforms offering mobile-first distribution capability.

What ESG Considerations Are Influencing Insurtech Investment Decisions?

Environmental, social, and governance considerations are increasingly influencing capital allocation toward financial inclusion-focused insurtech platforms. Digital carriers expanding coverage to historically underinsured populations align with broader financial inclusion objectives pursued by development finance institutions. We observed that investors are favoring platforms with documented financial inclusion impact as sustainability-linked investment criteria gain traction across the insurtech sector.

Key Benefits for Stakeholders

How Does This Report Benefit Industry Leaders and Carrier Executives?

Industry leaders and carrier executives gain granular segmentation data across component, application, and regional axes, enabling informed technology investment decisions for new underwriting and claims automation initiatives. Our analysis, data, and forecasts help executives benchmark platform strategy against verified 2025–2035 market trajectories and evolving AI adoption trends.

How Does This Report Benefit Investors and Financial Analysts?

Investors and financial analysts gain a validated 2025 base-year market size, a fundamentals-supported 2026–2035 CAGR, and segment-level growth trajectories that support capital allocation and competitive benchmarking decisions. The report's strategic insights into carrier profitability trends and platform innovation help analysts assess relative positioning across the insurtech value chain.

How Does This Report Benefit Technology Vendors and Product Teams?

Technology vendors and product teams gain visibility into the fastest-growing sub-segments, including Claims and underwriting automation solutions and Individual consumers end users, informing product roadmap and go-to-market prioritization aligned with documented buyer and application demand shifts through 2035.

Key Market Segments Evaluated

By Component

  • Software platforms
  • Digital distribution and marketplace solutions
  • Claims and underwriting automation solutions
  • Data and analytics solutions
  • Managed and support services

By Deployment Model

  • Cloud
  • On-premises

By Application

  • Auto insurance
  • Health insurance
  • Property and casualty insurance
  • Life insurance
  • Business and commercial insurance

By Technology

  • AI and machine learning
  • Blockchain
  • IoT and telematics
  • Big data and analytics
  • Other technologies

By End User

  • Insurance carriers
  • Insurance brokers and agents
  • Individual consumers
  • Enterprises

By Region

  • North America 
    • U.S.
    • Canada
    • Mexico
  • Europe 
    • UK
    • Germany
    • France
    • Italy
    • Spain
    • Sweden
    • Denmark
    • Finland
    • Netherlands
    • Rest of Europe
  • Asia-Pacific 
    • China
    • India
    • Japan
    • South Korea
    • Taiwan
    • Indonesia
    • Vietnam
    • Australia
    • Philippines
    • Malaysia
    • Rest of APAC
  • Middle East & Africa 
    • Saudi Arabia
    • UAE
    • Egypt
    • Israel
    • Turkey
    • Nigeria
    • South Africa
    • Rest of MEA
  • Latin America 
    • Brazil
    • Argentina
    • Chile
    • Colombia
    • Rest of LATAM

Conclusion & Recommendations

The Insurtech market is positioned for sustained rapid growth through 2035, underpinned by AI-driven underwriting efficiency and expanding digital carrier profitability. We expect Claims and underwriting automation solutions and Business and commercial insurance to gain structural share as carriers diversify beyond personal lines, while Software platforms and Auto insurance retain their position as significant revenue contributors across the forecast period.

What Strategic Positioning Should Insurtech Vendor Pursue?

Vendors should prioritize integrated, end-to-end AI capability spanning underwriting, pricing, and claims to align with digital carrier profitability priorities. Our assessment indicates that platforms investing in unified AI architecture, following the pattern established by Lemonade's cross-functional AI deployment, are best positioned to capture commercial line diversification and embedded insurance opportunities through 2035.

How Attractive Is the Insurtech Market for Investment?

The market presents an attractive investment case, supported by a validated USD 56.3 Billion absolute dollar opportunity between 2026 and 2035 and a fundamentals-backed 18.5% CAGR. Improving digital carrier profitability, as demonstrated by Lemonade and Hippo Holdings' 2025 financial results, signals sustained investor confidence in the segment's transition from hypergrowth to profitable scale.

What Market Shifts and Key Risks Should Stakeholders Monitor?

Stakeholders should monitor regulatory scrutiny of AI-driven underwriting and pricing models, which restrains deployment speed across regulated jurisdictions. We found that persistent underwriting losses among early-stage digital carriers also pose a risk to near-term platform investment, particularly for vendors dependent on venture-backed carrier customers still pursuing profitability.

What Are the Key Growth Pathways Through 2035?

Key growth pathways include expanding commercial line diversification among digital carriers, scaling embedded insurance distribution partnerships, and deepening mobile-first platform adoption across underinsured emerging markets. Our findings suggest that vendors combining AI-driven automation with proven carrier profitability outcomes are best positioned to capture disproportionate share of the market's projected USD 71.9 Billion 2035 revenue base.

Delivered Customizations

We have successfully delivered the following deep-dive customizations:

Client Request Customization Delivered Value Adds
Historical Market Growth Analysis
  • Historical revenue and adoption analysis of insurtech solutions and services by component, application, and deployment model.
  • Identifies high-growth segments and sets investment and entry priorities.
Company-Level Insurtech Revenue Benchmarking
  • Revenue, premiums written, and policy or customer volume benchmarking for listed insurtech providers using filings and earnings releases.
  • Highlights provider scale and growth differences to support competitive positioning.
TAM, SAM and SOM Opportunity Assessment
  • Addressable market sizing by application, end user, and deployment model with realistically obtainable share.
  • Prioritizes target segments and supports market-entry and investment decisions.
Technology Adoption Mapping by Insurance Value Chain
  • Adoption mapping of AI and machine learning, blockchain, IoT and telematics, big data analytics, and cloud technologies across underwriting, claims, distribution, and policy administration.
  • Pinpoints technology investments with the strongest use-case maturity and ROI.
End-User Demand Analysis by Insurer Type
  • Demand and solution-spend patterns across insurance carriers, brokers and agents, MGAs, and reinsurers by application and deployment preference.
  • Sharpens customer targeting and tailors offerings to each buyer group's needs.
Regulatory and Partnership Landscape Assessment
  • Mapping of insurtech regulation, data and cloud compliance rules, regulatory sandboxes, and carrier-insurtech partnerships and M&A across key regions.
  • Guides localization, partnership selection, and geographic expansion sequencing.

FAQs

About the Author

Mayurima Roy

Mayurima Roy

Mayurima Roy is Research Analyst at Next Move Strategy Consulting, where she has spent 4 years working across the firm's full industry coverage rather than a single fixed vertical. Her work centers on structured research, ongoing trend tracking, competitive assessment, and insight-led content development, translating complex market data into clear, decision-ready narratives that support informed client decision-making across diverse global industries, market sectors, and world regions every day.

About the Reviewer

Supradip Baul

Supradip Baul

Supradip Baul is an accomplished business consultant and strategist with over a decade of rich experience in market intelligence, strategy, technology, and business transformation. His work has included rigorous qualitative and quantitative analysis across multiple industries, helping clients shape investment decisions and long-term roadmaps. Earlier in his career, he was associated with Gartner, where he contributed to industry-leading reports and market share analyses. He has worked with leading global companies and holds an MBA with a dual specialization in Marketing and Finance.

Download Free Sample

Mohit Agarwal

MOHIT AGARWAL

Chief Manager

DryChem India Pvt. Ltd.

Next Move Strategy Consulting is an amazing team of consultants. We required a market study report for our investors on top priority and the team went above and beyond our expectations to deliver the same with ample supporting data within a short time span enabling us to secure the investments and keep our project timeline maintained. Their professionalism, attention to detail, and timely delivery of actionable recommendations have left a lasting impression on our organization.

Nishant Awate

NISHANT AWATE

Business Development Global Sales

Zehnder Group Deutschland GmbH

Our experience working with Next Move Strategy Consulting was positive. The team was responsive, professional, and open to incorporating our specific requirements throughout the project. The India AHU market study was comprehensive and well structured, covering market value and volume forecasts, product and application segments, and key industry trends. The inclusion of both AHU and residential MVHR market insights made the study particularly relevant for our strategic market assessment. Overall, the report provides a solid foundation for evaluating market potential, identifying priority segments, and supporting business-development decisions in India.

Kevin Coker

KEVIN COKER

Founder, CEO and Board Diector

Proxima Clinical Research

I have been using Next MSC reports for product positioning in a new geography for a long time. They have by far the best reports I have found and the price is reasonable too!

Pratyush Kumar Das

PRATYUSH KUMAR DAS

Assistant Manager

Polycab India Limited

We would like to express our appreciation for the data and insights provided by nextmsc. We are very pleased with the quality and depth of the information, which has proven to be highly valuable and beneficial for our business decision-making.

Gaurav Jaiswal

GAURAV JAISWAL

Founder & CEO

Yano Charge Private Limited

The EV Charging market research report provided by the NextMSC was exceptionally detailed and insightful. It offered a comprehensive analysis that proved to be a game-changer for our strategic planning. Truly a testament to the NextMSC’s expertise and thoroughness in EV market landscape & analysis.

Custom Market Research Services

We will customize the research for you if the listed report does not fully match your requirements.

Get 30% Free Customization

Select License

This website uses cookies to ensure you get the best experience on our website. Learn more

✖