Lubricant Additives Market Global Industry Analysis and Forecast (2026–2035)

The global Lubricant Additives Market size was valued at USD 18.85 billion in 2025 and is estimated at USD 19.62 billion in 2026, forecast to reach USD 27.85 billion by 2035, expanding at a 3.97% CAGR between 2026 and 2035. Asia-Pacific leads with approximately 40% share, while Dispersants dominate all other product types with approximately 23% share.
Download Free Sample PDF
Base Year (2025)
$18.85 Billion
Forecast (2035)
$27.85 Billion
CAGR (2026-2035)
4.0%
Top Region
Asia-Pacific

What Is the Lubricant Additives Market Size?

The global Lubricant Additives Market size was valued at USD 18.85 billion in 2025 and is estimated at USD 19.62 billion in 2026, forecast to reach USD 27.85 billion by 2035, expanding at a 3.97% CAGR between 2026 and 2035. Asia-Pacific leads with approximately a 40% share, while Dispersants dominate all other product types with approximately a 23% share.
We observed that growth is broad-based across every segmentation axis, with synthetic base oil compatibility and bio-based additive formulation driving the dominant structural shifts through 2035.

Lubricant Additives Market Global Industry Analysis and Forecast (2026–2035) Revenue Forecast
Values in USD Billion

2025 $18.85 Billion
2025
2026 $19.62 Billion
2026
2027 $20.40 Billion
2027
2028 $21.21 Billion
2028
2029 $22.05 Billion
2029
2030 $22.93 Billion
2030
2031 $23.84 Billion
2031
2032 $24.78 Billion
2032
2033 $25.77 Billion
2033
2034 $26.79 Billion
2034
2035 $27.85 Billion
2035

Key Takeaways

By Product Type: Dispersants held the largest share of approximately 23% (USD 4.34 Billion) in 2025; Friction Modifiers is the fastest-growing sub-segment at 6.1% CAGR from 2026-2035.

By Application: Engine Oils held the largest share of approximately 46% (USD 8.67 Billion) in 2025; Compressor and Turbine Oils is the fastest-growing sub-segment at 6.1% CAGR from 2026-2035.

By Base Oil Type: Mineral Oil Based held the largest share of approximately 68% (USD 12.82 Billion) in 2025; Bio-Based Oil is the fastest-growing sub-segment at 10.0% CAGR from 2026-2035.

By End User Industry: Automotive held the largest share of approximately 52% (USD 9.80 Billion) in 2025; Aviation is the fastest-growing sub-segment at 5.7% CAGR from 2026-2035.

Dominant Region: Asia-Pacific dominated with approximately 40% revenue share (USD 7.54 Billion) in 2025.

Fastest-Growing Region: Asia-Pacific is expected to register the highest CAGR of 5.6% during 2026-2035.

Dominant Country: China led with approximately USD 2.71 Billion in 2025.

Fastest-Growing Country: India is the fastest-growing country at approximately 10.4% CAGR from 2026-2035.

Market Opportunity: The Lubricant Additives Market is expected to create an absolute dollar opportunity of USD 8.23 billion between 2026 and 2035, presenting significant investment potential across synthetic base oil-compatible formulations and bio-based additive development.
According to NMSC analysis, additive manufacturers are increasingly reformulating dispersant and viscosity modifier chemistries to meet tightening original equipment manufacturer specifications for extended drain intervals, a shift that favors integrated additive package developers with in-house testing capability over single-chemistry suppliers as engine oil specifications evolve through 2035.

What does the Lubricant Additives Market Encompass?

The Lubricant Additives Market encompasses dispersants, detergents, viscosity modifiers, antiwear and extreme pressure additives, antioxidants, corrosion inhibitors, friction modifiers, and pour point depressants blended into engine oils, hydraulic fluids, metalworking fluids, and gear oils across mineral, synthetic, and bio-based lubricant formulations. We observed that the scope spans automotive, industrial manufacturing, marine, and aviation end markets, evolving from single-function additives into fully integrated additive packages engineered for specific original equipment manufacturer specifications.

Market Drivers & Dynamics

Interactive Dataset
Rising vehicle production and parc expansion in Asia-Pacific driver +1.4% Asia-Pacific 2026-2035
Growing demand for synthetic and bio-based lubricant formulations driver +1.1% North America, Europe 2026-2035
Expansion of industrial manufacturing and metalworking activity driver +0.9% Asia-Pacific, North America 2026-2033
Tightening emissions and extended drain interval specifications driver +0.8% North America, Europe 2026-2032
Growth of marine and aviation lubricant demand driver +0.6% Global 2026-2032
Electric vehicle adoption reducing conventional engine oil demand restraint -1.0% North America, Europe, Asia-Pacific 2026-2035
Volatile crude oil-derived base oil and feedstock pricing restraint -0.7% Global 2026-2030
Stringent regulatory approval timelines for new formulations restraint -0.5% Global 2026-2031
Extended drain intervals reducing per-vehicle additive volume restraint -0.4% North America, Europe 2026-2030
Source: Next Move Strategy Consulting

Growth Drivers

What Is the Primary Growth Driver for the Lubricant Additives Market?

The primary growth driver is rising vehicle production and parc expansion in Asia-Pacific, which sustains demand for engine oil additives across an expanding installed vehicle base. We observed that China's Ministry of Industry and Information Technology has documented sustained growth in domestic vehicle production since 2024, reinforcing demand for additive packages compatible with both conventional and modern low-emission engine platforms.

How Is Industrial Manufacturing Expansion Driving Market Growth?

Industrial manufacturing expansion is driving market growth as metalworking, hydraulic, and gear applications require specialized additive chemistries for machinery protection. Based on research conducted by NMSC, we found that expanding metalworking fluids demand across Asia-Pacific manufacturing hubs is increasing consumption of extreme pressure and corrosion inhibitor additives for machine tool and precision manufacturing applications.

Growth Inhibitors

What Is Restraining the Lubricant Additives Market?

Electric vehicle adoption reducing conventional engine oil demand restrains long-term volume growth, as battery electric vehicles eliminate the need for internal combustion engine oil additive packages. The U.S. Department of Energy has documented steady growth in electric vehicle registrations since 2024, signaling gradual displacement of conventional engine oil demand in mature automotive markets. Our analysis shows that manufacturers diversifying into industrial, marine, and electric vehicle fluid additives face less exposure than those concentrated solely in passenger vehicle engine oil chemistry.

Segmentation Analysis

2025 (USD Billion)
2035 (USD Billion)
Dispersants 2025: $4.34 Billion | 2035: $6.13 Billion
Dispersants
Detergents 2025: $3.58 Billion | 2035: $5.01 Billion
Detergents
Viscosity Modifiers 2025: $3.02 Billion | 2035: $5.01 Billion
Viscosity Mo
Antiwear and Extreme Pressure Additives 2025: $2.64 Billion | 2035: $3.90 Billion
Antiwear and
Antioxidants 2025: $1.89 Billion | 2035: $2.79 Billion
Antioxidants
Corrosion Inhibitors 2025: $1.32 Billion | 2035: $1.95 Billion
Corrosion In
Friction Modifiers 2025: $0.94 Billion | 2035: $1.67 Billion
Friction Mod
Pour Point Depressants 2025: $0.57 Billion | 2035: $0.84 Billion
Pour Point D
Other Additives 2025: $0.55 Billion | 2035: $0.55 Billion
Other Additi
Dispersants $4.34 Billion $6.13 Billion 3.5%
Detergents $3.58 Billion $5.01 Billion 3.3%
Viscosity Modifiers $3.02 Billion $5.01 Billion 5.3%
Antiwear and Extreme Pressure Additives $2.64 Billion $3.90 Billion 4.0%
Antioxidants $1.89 Billion $2.79 Billion 4.0%
Corrosion Inhibitors $1.32 Billion $1.95 Billion 4.0%
Friction Modifiers $0.94 Billion $1.67 Billion 6.1%
Pour Point Depressants $0.57 Billion $0.84 Billion 4.0%
Other Additives $0.55 Billion $0.55 Billion 0.0%

Which Product Type Dominates the Lubricant Additives Market?

Dispersants dominate the product type axis, contributing USD 4.34 billion in 2025 and projected to reach USD 6.13 billion by 2035. We found that dispersants remain the largest revenue contributor given their essential role in suspending combustion byproducts across lubricant formulations, while Friction Modifiers grow fastest as fuel economy-focused formulations expand across passenger vehicle engine oil categories.

2025 (USD Billion)
2035 (USD Billion)
Engine Oils
Hydraulic Fl
Metalworking
Gear Oils
Greases
Segment Item 2025 (USD Billion) 2035 (USD Billion) CAGR
Engine Oils $10.0 USD Billion $40.0 USD Billion 18.0%
Hydraulic Fluids $17.1 USD Billion $51.1 USD Billion 16.0%
Metalworking Fluids $24.2 USD Billion $62.2 USD Billion 22.0%
Gear Oils $31.3 USD Billion $73.3 USD Billion 12.0%
Greases $38.4 USD Billion $84.4 USD Billion 19.0%

Segment-wise data is locked

Unlock complete segment-wise numbers for By Application.

Unlock Full Data

Which Application Is Growing Fastest?

Engine Oils remain the largest application at USD 8.67 billion in 2025, while Compressor and Turbine Oils is the fastest-growing at a 6.1% CAGR through 2035. Our findings suggest that expanding power generation and industrial compression capacity is driving demand for oxidation-resistant, high-temperature-stable additive packages formulated for continuous-duty rotating equipment applications.

2025 (USD Billion)
2035 (USD Billion)
Mineral Oil
Synthetic Oi
Bio-Based Oi
Segment Item 2025 (USD Billion) 2035 (USD Billion) CAGR
Mineral Oil Based $10.0 USD Billion $40.0 USD Billion 27.0%
Synthetic Oil Based $17.1 USD Billion $51.1 USD Billion 13.0%
Bio-Based Oil $24.2 USD Billion $62.2 USD Billion 19.0%

Segment-wise data is locked

Unlock complete segment-wise numbers for By Base Oil Type.

Unlock Full Data

Why Does Bio-Based Oil Grow Fastest Among Base Oil Types?

Mineral Oil-based formulations lead with USD 12.82 billion in 2025, reflecting the broad installed base of conventional lubricants still in service across global vehicle and industrial equipment fleets. We observed that Bio-Based Oil is the fastest-growing base oil category at a 10.0% CAGR through 2035, as sustainability procurement mandates and renewable feedstock availability expand additive compatibility testing for bio-based lubricant formulations.

2025 (USD Billion)
2035 (USD Billion)
Automotive
Industrial M
Marine
Aviation
Power Genera
Segment Item 2025 (USD Billion) 2035 (USD Billion) CAGR
Automotive $10.0 USD Billion $40.0 USD Billion 20.0%
Industrial Manufacturing $17.1 USD Billion $51.1 USD Billion 26.0%
Marine $24.2 USD Billion $62.2 USD Billion 24.0%
Aviation $31.3 USD Billion $73.3 USD Billion 26.0%
Power Generation $38.4 USD Billion $84.4 USD Billion 9.0%

Segment-wise data is locked

Unlock complete segment-wise numbers for By End User Industry.

Unlock Full Data
2025 (USD Billion)
2035 (USD Billion)
North Americ
Canada
Mexico
Europe: UK
Germany
Segment Item 2025 (USD Billion) 2035 (USD Billion) CAGR
North America: U.S. $10.0 USD Billion $40.0 USD Billion 10.0%
Canada $17.1 USD Billion $51.1 USD Billion 8.0%
Mexico $24.2 USD Billion $62.2 USD Billion 18.0%
Europe: UK $31.3 USD Billion $73.3 USD Billion 8.0%
Germany $38.4 USD Billion $84.4 USD Billion 15.0%

Segment-wise data is locked

Unlock complete segment-wise numbers for By Region.

Unlock Full Data

PESTEL Analysis of the Lubricant Additives Market

PESTEL Analysis of the Lubricant Additives Market

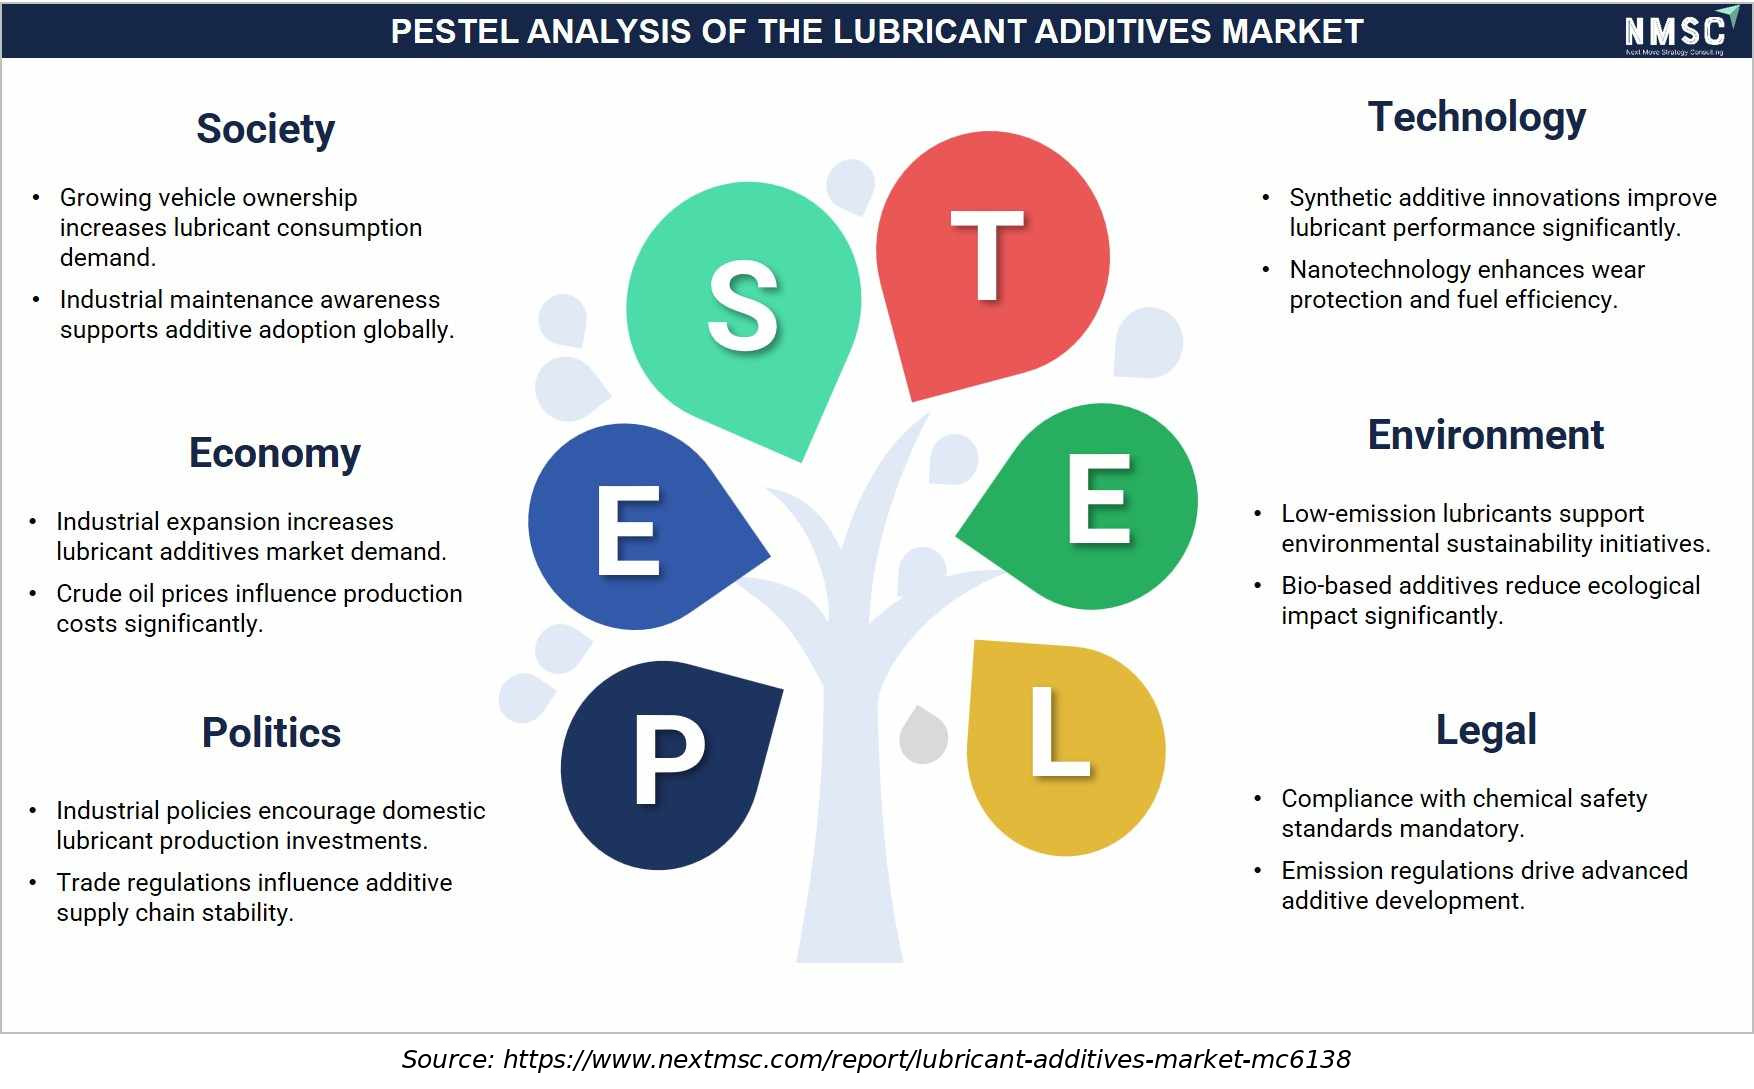
The above infographic presents a PESTEL analysis of the lubricant additives market, wherein industrial policies and trade regulations are shaping domestic production and supply chain stability. Growing vehicle ownership and industrial maintenance awareness are driving demand, while synthetic innovations and nanotechnology are enhancing wear protection and fuel efficiency. Low-emission and bio-based additives are supporting sustainability goals and reducing ecological impact. Compliance with chemical safety and emissions regulations governs formulation and use. Looking ahead, we observed that continued investment in eco-friendly technologies and regulatory alignment will remain critical for long-term market resilience and performance optimization.

Growth Opportunities

Beyond the core drivers outlined above, three forward-looking whitespace opportunities stand out for stakeholders positioning within the lubricant additives market over the 2026-2035 forecast period.

Can Electric Vehicle Fluid Additives Unlock Value for Additive Manufacturers?

Electric vehicle-specific thermal management and dielectric fluid additives present a whitespace opportunity as manufacturers diversify beyond conventional engine oil chemistry. Companies that expand additive packages engineered for electric vehicle transmission and battery cooling fluids stand to capture recurring formulation revenue as automakers scale electric vehicle production programs.

Where Does Bio-Based Additive Chemistry Create New Demand?

Bio-based additive chemistry represents an underpenetrated opportunity as original equipment manufacturers expand sustainability procurement requirements for renewable lubricant formulations. Companies such as Croda International Plc and Evonik Industries AG that scale specialty chemicals -grade renewable feedstock additive production can capture recurring demand from environmentally focused lubricant formulators.

How Can Extended Drain Interval Packages Benefit Heavy-Duty Fleet Operators?

Extended drain interval additive packages create a mechanism to serve heavy-duty fleet operators seeking reduced maintenance downtime and total cost of ownership. This category benefits manufacturers offering integrated antioxidant and dispersant packages, directly supporting continued demand growth within the fastest-growing Compressor and Turbine Oils and Friction Modifiers segments through 2035.

Ecosystem Analysis

Regional Outlook

2025 (USD Billion)
2035 (USD Billion)
North Americ
Europe
Asia-Pacific
Middle East
Latin Americ
Region 2025 (USD Billion) 2035 (USD Billion) CAGR (%)
North America $10.0 USD Billion $40.0 USD Billion 9.0%
Europe $17.1 USD Billion $51.1 USD Billion 27.0%
Asia-Pacific $24.2 USD Billion $62.2 USD Billion 25.0%
Middle East & Africa $31.3 USD Billion $73.3 USD Billion 23.0%
Latin America $38.4 USD Billion $84.4 USD Billion 12.0%

Regional data is locked

Unlock complete regional numbers for this market.

Unlock Full Data

Competitive Landscape

We observed that the lubricant additives market features a moderately consolidated competitive landscape, with diversified specialty chemical companies competing alongside integrated petroleum companies on formulation breadth, testing infrastructure, and pricing flexibility.

Dimension Description
Market Structure Moderately consolidated; the top companies profiled in this report collectively account for a significant share of global lubricant additives revenue, while numerous regional blenders serve country-specific formulation demand
Innovation Focus Low-ash formulation chemistry, bio-based additive development, and electric vehicle fluid additives dominate current innovation pipelines across leading manufacturers
M&A Activity Selective consolidation through specialty chemical acquisitions, exemplified by Lubrizol Corporation's continued investment in advanced additive testing and formulation infrastructure

How Do Companies Compete in the Lubricant Additives Market?

Companies compete primarily on formulation breadth, testing infrastructure, and pricing flexibility across application tiers. We observed that global players such as Lubrizol Corporation and Infineum International Limited leverage broad integrated additive package portfolios to serve multinational lubricant blenders, while regional manufacturers compete on cost efficiency for price-sensitive conventional formulation demand.

Which Competitive Archetypes Dominate the Market?

Two archetypes dominate the market: diversified integrated additive package developers offering formulation, testing, and technical support under a single relationship, and specialty chemical producers focused on individual additive chemistries. Chevron Oronite Company LLC exemplifies the integrated archetype through comprehensive engine oil additive package development, while King Industries, Inc. exemplifies the specialty chemistry archetype serving niche formulation demand.

How Are Companies Differentiating Through Innovation?

Innovation and differentiation strategy increasingly center on low-ash formulation chemistry and specialty chemicals -grade bio-based additive development. Evonik Industries AG and BASF SE have both expanded renewable feedstock additive capability to secure sustainability-focused formulator contracts, while manufacturers unable to demonstrate emissions-compatible formulation risk losing specification share to more advanced competitors.

What M&A and Expansion Activity Is Shaping the Market?

Mergers, acquisitions, and geographic expansion continue to consolidate lubricant additives capabilities within the industry. Lubrizol Corporation's ongoing investment in advanced formulation testing infrastructure has strengthened its integrated additive package capability, while NewMarket Corporation's continued investment through its Afton Chemical Corporation subsidiary illustrates how diversified companies pursue geographic expansion and technology breadth across engine oil and industrial application segments.

Key Market Players

We observed that the following eighteen companies represent the verified competitive set shaping formulation innovation, geographic expansion, and pricing strategy across the Lubricant Additives Market.

The Lubrizol Corporation Chevron Oronite Company LLC Infineum International Limited NewMarket Corporation BASF SE Evonik Operations GmbH Croda International Plc Clariant AG Innospec Inc. China Petroleum & Chemical Corporation TotalEnergies SE NYCO Solvay SA LANXESS AG King Industries, Inc. Vanderbilt Chemicals, LLC Dow Inc. Idemitsu Kosan Co., Ltd

Latest Developments

We found that recent product and capacity announcements underscore accelerating manufacturer investment in low-ash and bio-based additive formulation capability.

Date Event
July 2026 Chevron Oronite introduced its PC-12 additive technology platform for next-generation heavy-duty engine oils. The solutions include new dispersant chemistry and are designed to address fuel efficiency, oil-life, engine protection, and aftertreatment requirements, with first licensing targeted for January 2027.
July 2026 Infineum and Kangtai expanded their partnership through a new distribution arrangement across Southern Asia. The collaboration strengthens regional access and distribution capabilities for Infineum's lubricant additive products.
May 2026 LANXESS and Hindustan Petroleum Corporation Limited agreed to jointly expand the availability of LANXESS-branded aviation and industrial lubricant solutions across India and SAARC countries. The partnership supports market access for LANXESS's additive, synthetic base-stock and finished-fluid portfolio.

Investment Opportunities

Where Are Capital Inflows Concentrated in the Market?

Capital inflows are concentrated in bio-based additive chemistry developers and electric vehicle fluid formulation specialists, with strategic acquirers targeting firms offering proprietary renewable feedstock and thermal management technology. Our analysis shows that established manufacturers are increasingly funding internal sustainable chemistry research, reflecting confidence in the segment's 3.97% CAGR through 2035 as a durable, fundamentals-supported growth trajectory.

How Significant Is Infrastructure Investment Supporting Market Growth?

Infrastructure investment supporting synthetic base oil and base oil compatibility testing underpins the market's Bio-Based Oil and Asia-Pacific growth, projected at a 10.0% and 5.6% CAGR respectively through 2035. We observed that formulation testing capacity expansion across North America and Asia-Pacific is directly enabling faster adoption of next-generation additive chemistries.

What ESG Considerations Are Shaping Investment Decisions?

Environmental, Social, and Governance considerations increasingly factor into manufacturer and investor decisions, as bio-based additive chemistry directly reduces reliance on petroleum-derived feedstocks. Our assessment indicates that investors favor manufacturers demonstrating measurable progress toward renewable feedstock adoption and emissions-compatible formulation, aligning lubricant additives development with broader corporate sustainability reporting requirements across automotive and industrial customers.

Key Benefits for Stakeholders

How Does This Report Benefit Enterprise and Industry Leaders?

Enterprise and industry leaders gain access to segment-level revenue forecasts across product type, application, and base oil type axes, enabling informed prioritization of formulation investment and supplier selection decisions. Our analysis shows that benchmarking against the 3.97% market CAGR through 2035 helps chemical industry leaders justify budget allocation relative to peers, while regional data supports manufacturing footprint and sourcing decisions.

How Does This Report Benefit Investors and Financial Analysts?

Investors and financial analysts benefit from reconciled market sizing across eighteen companies and thirty-eight countries, supporting due diligence on competitive positioning and growth trajectory. NMSC's analysis indicates that the report's segment-level CAGR data, including the 10.0% growth rate for Bio-Based Oil formulations, helps identify underappreciated growth pockets ahead of broader market recognition.

How Does This Report Benefit Technology Vendors and Product Teams?

Technology vendors and product teams gain visibility into which product types and applications are growing fastest, directly informing product roadmap and go-to-market prioritization. Our findings suggest that the report's competitive landscape and latest developments sections help product teams benchmark feature investment against direct competitors, reducing the risk of misallocating research spend toward slower-growing segments.

Supply Chain Structure of the Lubricant Additives Industry

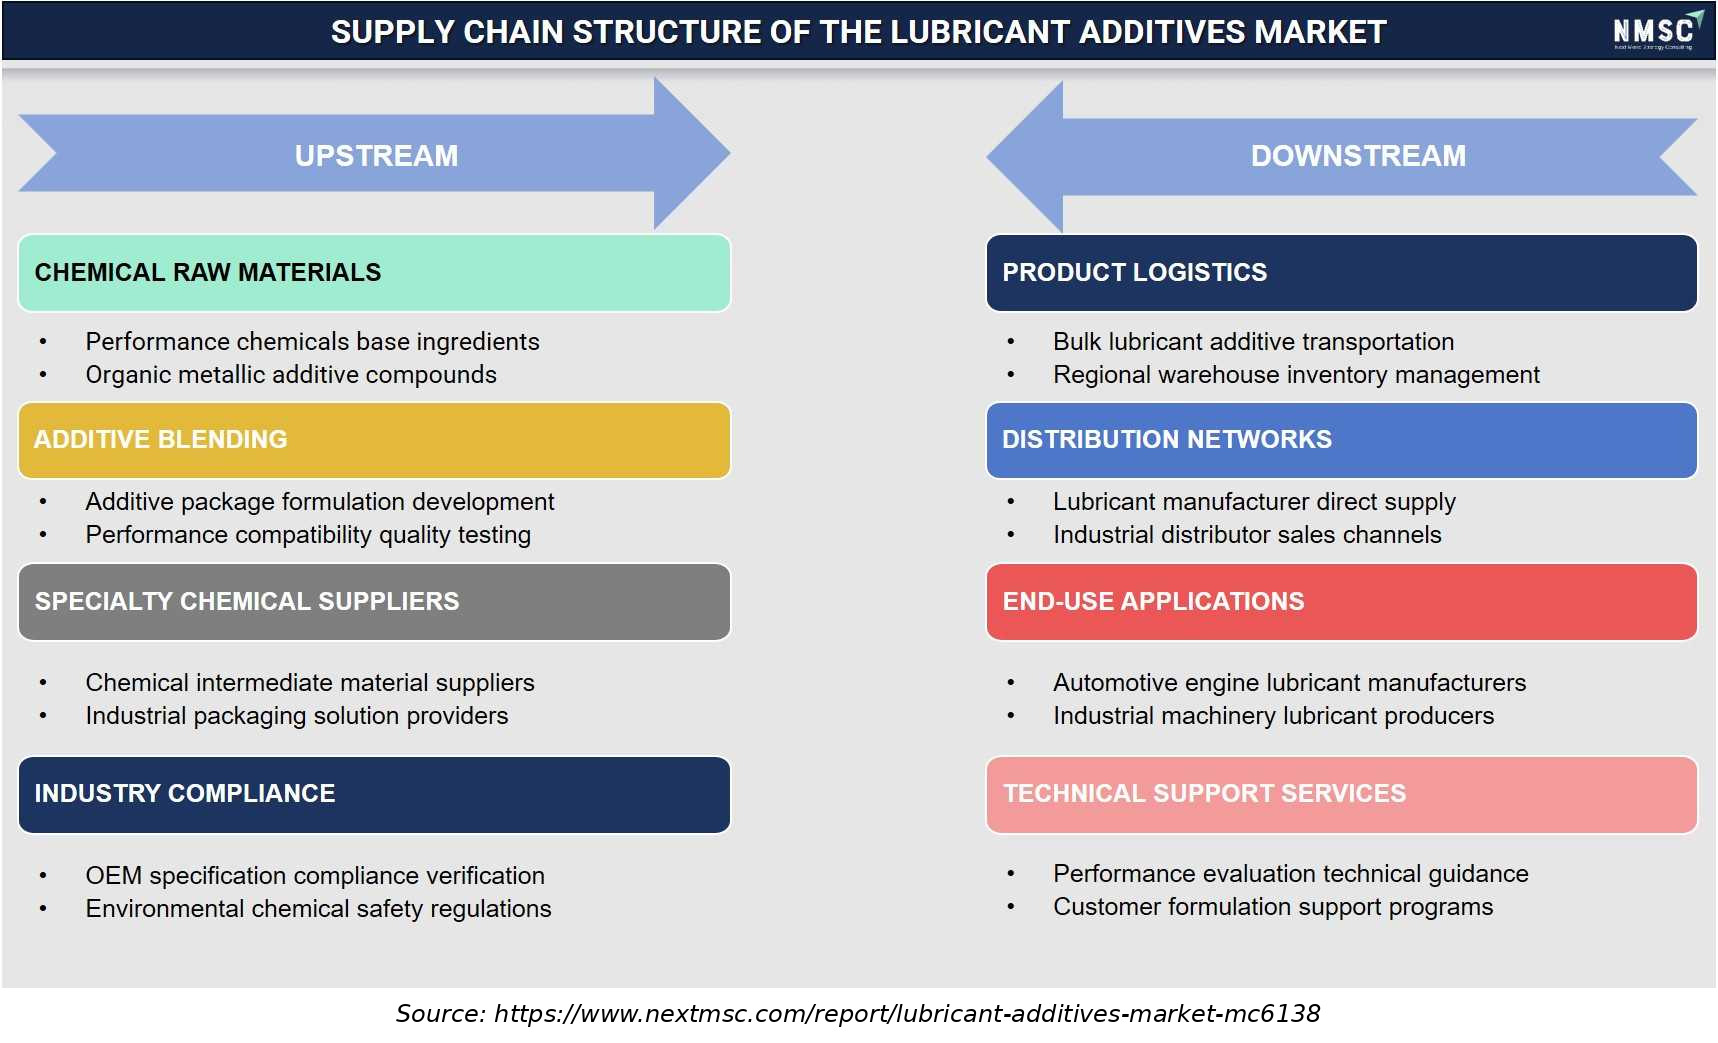
The above infographic presents the supply chain structure of the lubricant additives market, segmented into upstream and downstream activities. Performance chemicals and organic metallic compounds are blended and tested to develop additive packages, supported by specialty chemical suppliers and packaging providers. Compliance with OEM specifications and environmental safety regulations governs production. Downstream, bulk logistics and distribution networks supply automotive and industrial lubricant manufacturers. Looking ahead, we observed that performance evaluation and formulation support remain essential for optimizing product quality and customer satisfaction across the industry.

Key Market Segments Evaluated

By Product Type

  • Dispersants
  • Detergents
  • Viscosity Modifiers
  • Antiwear and Extreme Pressure Additives
  • Antioxidants
  • Corrosion Inhibitors
  • Friction Modifiers
  • Pour Point Depressants
  • Other Additives

By Application

  • Engine Oils
  • Hydraulic Fluids
  • Metalworking Fluids
  • Gear Oils
  • Greases
  • Compressor and Turbine Oils
  • Other Applications

By Base Oil Type

  • Mineral Oil Based
  • Synthetic Oil Based
  • Bio-Based Oil

By End User Industry

  • Automotive
  • Industrial Manufacturing
  • Marine
  • Aviation
  • Power Generation
  • Other Industries

By Region

  • North America 
    • U.S.
    • Canada
    • Mexico
  • Europe 
    • UK
    • Germany
    • France
    • Italy
    • Spain
    • Sweden
    • Denmark
    • Finland
    • Netherlands
    • Rest of Europe
  • Asia-Pacific 
    • China
    • India
    • Japan
    • South Korea
    • Taiwan
    • Indonesia
    • Vietnam
    • Australia
    • Philippines
    • Malaysia
    • Rest of APAC
  • Middle East & Africa 
    • Saudi Arabia
    • UAE
    • Egypt
    • Israel
    • Turkey
    • Nigeria
    • South Africa
    • Rest of MEA
  • Latin America 
    • Brazil
    • Argentina
    • Chile
    • Colombia
    • Rest of LATAM

Conclusion & Recommendations

The long-term outlook for the market remains steady, with global revenue projected to expand from USD 19.62 billion in 2026 to USD 27.85 billion by 2035 at a 3.97% CAGR. We observed that sustained industrial manufacturing growth, synthetic and bio-based formulation adoption, and Asia-Pacific vehicle production expansion will continue underpinning growth across application segments through the forecast period.

What Strategic Positioning Should Manufacturers Pursue?

Manufacturers should prioritize low-ash and bio-based formulation capability while pursuing electric vehicle fluid additive diversification to secure long-term customer relationships. Our assessment indicates that smaller manufacturers without advanced testing infrastructure face competitive disadvantage, making strategic alliances with base oil and specialty chemical technology providers an increasingly important positioning lever heading into the later years of the forecast period.

How Attractive Is the Lubricant Additives Market for New Investment?

The lubricant additives industry presents a moderately attractive investment case, supported by a USD 8.23 billion absolute dollar opportunity between 2026 and 2035 and above-average growth in Asia-Pacific and Bio-Based Oil categories. We found that investment attractiveness is highest for manufacturers combining integrated formulation capability with scaled testing and technical support infrastructure.

What Market Shifts and Key Risks Should Stakeholders Monitor?

Stakeholders should monitor electric vehicle adoption reducing conventional engine oil demand, volatile base oil feedstock pricing, and extended drain intervals reducing per-vehicle additive volume as key factors shaping the lubricant additives market. Our analysis shows that manufacturers unable to diversify into industrial, marine, and electric vehicle fluid additives risk losing volume share as passenger vehicle engine oil demand growth moderates.

What Are the Key Growth Pathways for the Lubricant Additives Market?

Key growth pathways include expanding Bio-Based Oil and Friction Modifiers product portfolios, scaling electric vehicle fluid additive capability, and deepening penetration into industrial manufacturing and marine application channels. NMSC's analysis indicates that manufacturers pursuing these pathways while maintaining cost competitiveness in standard mineral oil-based categories will be best positioned to capture the market's projected growth through 2035.

FAQs

About the Author

Mayurima Roy

Mayurima Roy

Mayurima Roy is Research Analyst at Next Move Strategy Consulting, where she has spent 4 years working across the firm's full industry coverage rather than a single fixed vertical. Her work centers on structured research, ongoing trend tracking, competitive assessment, and insight-led content development, translating complex market data into clear, decision-ready narratives that support informed client decision-making across diverse global industries, market sectors, and world regions every day.

About the Reviewer

Supradip Baul

Supradip Baul

Supradip Baul is an accomplished business consultant and strategist with over a decade of rich experience in market intelligence, strategy, technology, and business transformation. His work has included rigorous qualitative and quantitative analysis across multiple industries, helping clients shape investment decisions and long-term roadmaps. Earlier in his career, he was associated with Gartner, where he contributed to industry-leading reports and market share analyses. He has worked with leading global companies and holds an MBA with a dual specialization in Marketing and Finance.

Download Free Sample

Amos Chang

AMOS CHANG

Strategy Consultant

Kardex Group

I have bought the intralogistics market reports from NMSC two times so far. Joseph and his team are always very helpful and flexible in responding to any customization requirements on the report. Their expertise in market reports really helps us steer the day-to-day business. I will definitely recommend and come back myself whenever there is a need.

Pratyush Kumar Das

PRATYUSH KUMAR DAS

Assistant Manager

Polycab India Limited

We would like to express our appreciation for the data and insights provided by nextmsc. We are very pleased with the quality and depth of the information, which has proven to be highly valuable and beneficial for our business decision-making.

Kishu Kanda

KISHU KANDA

Strategy Analyst

Accenture

We purchased the AI Consumer Market Report from this company. Not only did they customize the report to meet our specific requirements, but they also showed great flexibility in accommodating our budget. The report we received fully met our expectations. Additionally, they provided prompt and thorough responses to both our pre-purchase and follow-up questions. We look forward to working with this company again in the future.

Gaurav Jaiswal

GAURAV JAISWAL

Founder & CEO

Yano Charge Private Limited

The EV Charging market research report provided by the NextMSC was exceptionally detailed and insightful. It offered a comprehensive analysis that proved to be a game-changer for our strategic planning. Truly a testament to the NextMSC’s expertise and thoroughness in EV market landscape & analysis.

Ross J Mckenzie

ROSS J MCKENZIE

Business Insight Manager

Staysure Group

“Next MSC have been incredibly helpful in providing detailed & robust information on our market, alongside quantifying growth by different segments. The process to procure was simple and easy, with sample reports and regular contact to ensure we had what we needed. Succinct detail on their sources & methodologies is also greatly received, allowing transparency in this respect helps build trust in the detail you pay for. Joseph in particular was fantastic, and helped ensure efficient provision of the insight pack – thank you NMSC!”.

Custom Market Research Services

We will customize the research for you if the listed report does not fully match your requirements.

Get 30% Free Customization

Select License

This website uses cookies to ensure you get the best experience on our website. Learn more

✖