Market")
North America Air Handling Unit (AHU) Market by Type (Packaged, Modular, and Custom), by Installation (Rooftop and Indoor), by Capacity (Less than 5,000 M3/H, 5,001 – 15,000 M3/H, 15,001 – 30,000 M3/H, 30,001 – 50,000 M3/H, and Greater than 50,001 M3/H), and by Application (Commercial, Industrial, and Residential) - Opportunity Analysis and Industry Forecast, 2024– 2030
Industry: Construction & Manufacturing | Lastest Edition: December 23, 2025 | No of Pages: 131 | No. of Tables: 90 | No. of Figures: 55 | Format: PDF | Report Code : CM1602
Market Definition
The North America Air Handling Unit (AHU) Market size was valued at USD 3.92 billion in 2023, and is predicted to reach USD 5.46 billion by 2030, at a CAGR of 4.3% from 2024 to 2030.
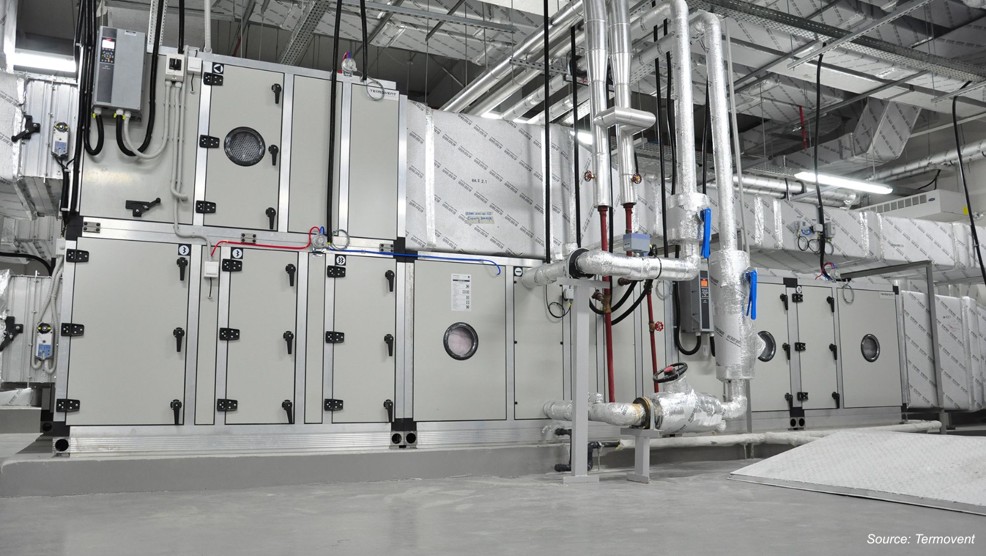
The air handling unit (AHU), also known as air handler, is a fundamental component in heating, ventilation, and air conditioning (HVAC) systems, facilitating efficient airflow regulation and indoor climate control across commercial, industrial, and residential sectors. It collects air from the outside and inside, removes dust and other particles from the collected air, adjusts temperature and humidity, and then supplies clean and conditioned air in the room through ducts.
Increasing Demand for HVAC Systems Fuel the Market Growth
The increasing demand for HVAC systems stands out as a pivotal driving force for the Air Handling Unit (AHU) market. HVAC systems, integral to maintaining comfortable indoor environments in residential, commercial, and industrial spaces, are witnessing a surge in demand. The growing global population, coupled with improving living standards, underscores the need for effective climate control and air quality management.
AHUs, as essential components of HVAC systems, play a key role in regulating temperature, humidity, and air circulation. Factors such as urbanization, changing weather patterns, and a heightened awareness of indoor air quality contribute to the escalating demand for HVAC solutions.
This trend reflects a broader societal emphasis on creating optimal living and working conditions, propelling the growth of the Air Handling Unit market to meet the evolving needs of diverse sectors.
Rising Construction Activities Boost the AHU Industry
The expanding construction industry serves as a primary driver for the increased demand in the Air Handling Unit (AHU) market. As economies undergo development and urbanization, there is a concurrent need for the construction of new residential, commercial, and industrial buildings.
In these construction projects, the installation of HVAC systems is essential, with AHUs playing a crucial role. Whether in new constructions or the renovation of existing structures to meet contemporary standards, the demand for HVAC solutions propels the market for AHUs.
This phenomenon is not limited to specific regions but is particularly evident in areas undergoing rapid urban development and infrastructural growth. The construction industry's expansion directly contributes to the rising adoption of AHUs, emphasizing their integral role in modern heating, ventilation, and air conditioning systems.
High Cost of Raw Materials Hinders the Market Growth
The installation of Air Handling Units (AHUs) involves significant upfront expenses. Purchasing the units, along with the costs associated with their installation, can be relatively high compared to other HVAC solutions.
This initial financial barrier may be a restraining factor for potential customers, especially small businesses or individuals with budget constraints. The higher upfront costs may lead some to explore alternative, more cost-effective solutions or delay upgrading their HVAC systems until absolutely necessary.
To mitigate this challenge, manufacturers and industry stakeholders may need to focus on developing more cost-efficient AHU models or explore financing options to make the initial investment more accessible to a wider range of customers.
Integration of IoT in Air Handler Creates Market Opportunity
Air Handling Units (AHUs) are poised to undergo a transformative shift towards greater intelligence and connectivity with the integration of Internet of Things (IoT) technology.
This evolution entails the incorporation of advanced sensors within AHUs to monitor real-time parameters such as temperature, humidity, and air quality. Coupled with IoT connectivity, these AHUs will be part of a networked system, allowing for remote access and control of HVAC functions.
Building managers and technicians will benefit from the ability to remotely monitor AHU performance, swiftly identifying issues and optimizing system efficiency. Furthermore, the implementation of data analytics and machine learning algorithms enables predictive maintenance, ensuring timely interventions to prevent potential faults.
The key advantages of this smart and IoT-enabled approach include enhanced energy efficiency, improved system performance, and long-term cost savings. Overall, this integration of smart technologies positions AHUs as more responsive, efficient, and adaptable components within the evolving landscape of HVAC solutions.
The U.S. Holds the Dominant Market Share in North America Air Handling Unit (AHU) Market
The expanding construction industry serves as a primary driver for the increased demand in the Air Handling Unit (AHU) market. As economies undergo development and urbanization, there is a concurrent need for the construction of new residential, commercial, and industrial buildings.
In these construction projects, the installation of HVAC systems is essential, with AHUs playing a crucial role. Whether in new constructions or the renovation of existing structures to meet contemporary standards, the demand for HVAC solutions propels the market for AHUs.
This phenomenon is not limited to specific regions but is particularly evident in areas undergoing rapid urban development and infrastructural growth. The construction industry's expansion directly contributes to the rising adoption of AHUs, emphasizing their integral role in modern heating, ventilation, and air conditioning systems.
The increasing demand for HVAC systems stands out as a pivotal driving force for the Air Handling Unit (AHU) market. HVAC systems, integral to maintaining comfortable indoor environments in residential, commercial, and industrial spaces, are witnessing a surge in demand.
The growing global population, coupled with improving living standards, underscores the need for effective climate control and air quality management. AHUs, as essential components of HVAC systems, play a key role in regulating temperature, humidity, and air circulation.
Factors such as urbanization, changing weather patterns, and a heightened awareness of indoor air quality contribute to the escalating demand for HVAC solutions. This trend reflects a broader societal emphasis on creating optimal living and working conditions, propelling the growth of the Air Handling Unit market to meet the evolving needs of diverse sectors.
Mexico to Witness Substantial Growth in the North America Air Handling Unit (AHU) Market
The rising awareness of energy efficiency stands out as a crucial factor propelling the Air Handling Unit (AHU) market. Fueled by environmental sustainability concerns and a desire for energy conservation, end-users are increasingly seeking HVAC solutions that minimize energy consumption while maintaining effective performance.
This shift is driven by the need to reduce operational costs, comply with stringent energy efficiency regulations, and achieve green building certifications such as LEED. Advanced technologies, including variable air volume (VAV) systems and energy recovery solutions, play a pivotal role in optimizing AHU performance and ensuring precise control over energy usage.
As consumers prioritize eco-friendly practices, the market responds by offering energy-efficient AHUs that not only meet regulatory standards but also align with the growing preference for sustainable and environmentally conscious HVAC solutions. In essence, the awareness of energy efficiency emerges as a key driver, shaping the evolution of the AHU market towards more environmentally friendly and economically sound solutions.
Rapid growth in demand for air handlers in data centers is a major driver that boosts growth of the market. With exponential growth of data storage and processing requirements globally, fueled by the proliferation of cloud computing, artificial intelligence (AI), and big data analytics, data centers have become indispensable infrastructure assets.
These facilities rely heavily on precise environmental control to ensure optimal performance and prevent equipment overheating, making AHUs essential components of their HVAC systems. In addition, AHUs are tasked with regulating temperature, humidity, and air quality within data centers, maintaining stable operating conditions for servers and networking equipment.
As data center infrastructure continues to expand to meet escalating demands for digital services, the demand for high-performance AHUs tailored to unique requirements of data center environments is on the rise. AHU manufacturers are thus presented with a lucrative opportunity landscape, characterized by the rise in demand for specialized HVAC solutions in the data center industry.
Competitive Landscape
The market players operating in the North America Air Handling Unit (AHU) market include Daikin Industries, Ltd., Carrier Global Corporation, Trane Technologies, Midea Group, Johnson Controls, Lennox International, Stulz GmbH, Rheem Manufacturing Company, Sinko Industries Ltd., Systemair AB and others.
North America Air Handling Unit (AHU) Market Key Segments
By Type
-
Packaged
-
Modular
-
Custom
By Installation
-
Rooftop
-
Indoor
By Capacity
-
≤ 5,000 M3/H
-
5,001 – 15,000 M3/H
-
15,001 – 30,000 M3/H
-
30,001 – 50,000 M3/H
-
≥ 50,001 M3/H
By Application
-
Commercial
-
Industrial
-
Residential
By Country
-
The U.S.
-
Canada
-
Mexico
Key Players
-
Daikin Industries, Ltd.
-
Carrier Global Corporation
-
Trane Technologies
-
Midea Group
-
Johnson Controls
-
Lennox International
-
Stulz GmbH
-
Rheem Manufacturing Company
-
Sinko Industries Ltd.
-
Systemair AB
REPORT SCOPE AND SEGMENTATION:
|
Parameters |
Details |
|
Market Size in 2023 |
USD 3.92 Billion |
|
Revenue Forecast in 2030 |
USD 5.46 Billion |
|
Growth Rate |
CAGR of 4.3% from 2024 to 2030 |
|
Analysis Period |
2023–2030 |
|
Base Year Considered |
2023 |
|
Forecast Period |
2024–2030 |
|
Market Size Estimation |
Billion (USD) |
|
Growth Factors |
|
|
Countries Covered |
3 |
|
Companies Profiled |
10 |
|
Market Share |
Available for 10 companies |
|
Customization Scope |
Free customization (equivalent up to 80 working hours of analysts) after purchase. Addition or alteration to country, regional, and segment scope. |
|
Pricing and Purchase Options |
Avail customized purchase options to meet your exact research needs. |
 Market Revenue by 2030 (Billion USD)")
 Market Segmentation")
 Market Major Regions")
About the Author
 Jayanta Das is a senior research analyst delivering high-impact market intelligence across global markets. He leads comprehensive studies covering market assessment, forecasting, competitive evaluation, regulatory review, and trend analysis. Known for his structured and methodical approach, Jayanta excels at converting complex datasets into clear, decision-ready insights for leadership teams. His work supports strategic planning through credible sourcing, analytical precision, strong validation frameworks, and well-structured, business-focused reporting that enables confident decision-making.
About the Reviewer
 Supradip Baul is an accomplished business consultant and strategist with over a decade of rich experience in market intelligence, strategy, technology, and business transformation. His work has included rigorous qualitative and quantitative analysis across multiple industries, helping clients shape investment decisions and long-term roadmaps. Earlier in his career, he was associated with Gartner, where he contributed to industry-leading reports and market share analyses. He has worked with leading global companies and holds an MBA with a dual specialization in Marketing and Finance.
At Next Move Strategy Consulting, we understand that insightful market research is the cornerstone of successful business decisions. That's why we employ a robust and multifaceted approach, combining various methodologies to deliver the most accurate and actionable data for our clients.

Research Landscape
We navigate the world of research with two primary approaches:
Qualitative Approach
Our qualitative research methodologies involve immersive techniques such as in-depth interviews, focus groups, and observational studies. By engaging directly with individuals and stakeholders, we uncover valuable insights that quantitative data alone may overlook.

Quantitative Research
In tandem with qualitative methodologies, NMSC leverages the power of Quantitative Research to provide a robust foundation of numerical insights. Through systematic data collection and analysis, we quantify patterns, preferences, and market trends, offering a comprehensive view of the business landscape.
Our quantitative research approach employs diverse tools, including surveys, experiments, and statistical modelling. These methodologies enable us to gather data from a large and representative sample, ensuring the statistical significance of our findings. By employing structured questionnaires and standardized data collection methods, we guarantee the reliability and validity of the information we present to our clients.
Quantitative research is particularly effective in measuring the prevalence of trends, assessing market size, and gauging the impact of various factors on consumer behavior. The numerical precision attained through this approach equips our clients with actionable insights, facilitating data-driven decision-making and strategy formulation.


Our Specialized Toolbox for Industry-Specific Market Research
We deploy a specialized arsenal of techniques tailored to meet your unique requirements. Here's a glimpse into our comprehensive toolbox:

Information Procurement
The stage entails acquiring market data or relevant information through various sources and methodologies.


Market Research Approach
We utilize both top-down and bottom-up approaches in market research analysis to achieve a comprehensive understanding of the market dynamics, leveraging the broad perspective of industry trends and macroeconomic factors alongside detailed insights from specific segments and individual companies.

Porters Five Forces Analysis
We conduct Porter's Five Forces analysis to evaluate the competitive landscape of an industry, providing us with insights into factors that affect profitability and strategic positioning.

SWOT Analysis

Forecasting
We utilize a forecasting model to predict future consumption by considering parameters like population, economics, regulations, market competition, drivers, constraints, technology, and pricing. We also employ statistical techniques such as multilinear regression, exponential smoothing, moving average, ARIMA, and Monte Carlo simulations for accurate predictions. In econometric forecasting, we analyzed short-term and long-term event impacts, attributing values based on regulatory frameworks, economic factors, and market events.


 Speak to Our Analyst