Optical Amplifier Market

Optical amplifier market size was valued at USD 2.85 billion in 2025 and is forecast to reach USD 9.40 billion by 2035, at a 12.8% CAGR from 2026 to 2035.

Download Free Sample PDF
Base Year (2025)
$2.85 Billion
Forecast (2035)
$9.40 Billion
CAGR (2026-2035)
12.8%
Top Region
North America

What Is the Optical Amplifier Market Size?

The global optical amplifier sector size was valued at USD 2.85 billion in 2025 and is estimated at USD 3.18 billion in 2026, projected to reach USD 9.40 billion by 2035, growing at a CAGR of 12.8% from 2026 to 2035. North America led the market with an approximate 34% revenue share in 2025, while the EDFA amplifier type segment dominated at roughly 62% share.

Our findings suggest that the following key takeaways summarize the optical amplifier sector segment-level and geographic dynamics as of 2025.

Optical Amplifier Market Revenue Forecast

Values in USD Billion

2025 $2.85 Billion
2025
2026 $3.21 Billion
2026
2027 $3.63 Billion
2027
2028 $4.09 Billion
2028
2029 $4.61 Billion
2029
2030 $5.20 Billion
2030
2031 $5.87 Billion
2031
2032 $6.62 Billion
2032
2033 $7.47 Billion
2033
2034 $8.43 Billion
2034
2035 $9.40 Billion
2035

Key Takeaways

By Amplifier Type: EDFA dominated, accounting for approximately 62% share and generating USD 1.77 billion in 2025, projected to reach USD 5.08 billion by 2035; Hybrid EDFA/Raman Amplifier is the fastest-growing amplifier type at a 19.6% CAGR from 2026–2035.

By Application: Long-Haul and Submarine Networks dominated with approximately 48% share, generating USD 1.37 billion in 2025; Data Center Interconnect is the fastest-growing application at a 17.8% CAGR from 2026–2035.

By Band: C-Band dominated with approximately 66% share, generating USD 1.88 billion in 2025; C+L Band is the fastest-growing band at an 18.7% CAGR from 2026–2035.

By Deployment: Terrestrial dominated with approximately 78% share, generating USD 2.22 billion in 2025; Submarine is the fastest-growing deployment at a 15.8% CAGR from 2026–2035.

By End User: Telecom Service Providers dominated with approximately 54% share, generating USD 1.54 billion in 2025; Cloud and Hyperscale Data Center Operators is the fastest-growing end-user segment at a 17.6% CAGR from 2026–2035.

Dominant Region: North America dominated with approximately a 34% share, generating USD 969.0 million in 2025.

Fastest-Growing Region: Asia-Pacific is expected to register the highest CAGR of 13.4% during 2026–2035.

Dominant Country: The U.S. led the market, generating USD 775.2 million in 2025.

Fastest-Growing Country: India is expected to register the highest country-level CAGR of 16.4% during 2026–2035.

Market Opportunity: The optical amplifier sector presents an absolute dollar opportunity of approximately USD 6.22 billion between 2026 and 2035, calculated as the difference between the 2035 forecast value and the 2026 base value, an investment window favoring vendors scaling C+L band and hybrid amplification technology for AI-driven capacity expansion.

According to NMSC analysis, we found that the gap between surging AI and cloud data center interconnect bandwidth demand and currently deployed C-band-only amplification infrastructure is widening the addressable market for spectrum-expanding upgrades, even as vendors face intensifying competition on cost-per-wavelength economics.

What does the Optical Amplifier Market Encompass?

The optical amplifier sector encompasses erbium-doped fiber amplifiers, Raman amplifiers, semiconductor optical amplifiers, and hybrid amplification systems that boost optical signal strength across long-haul, submarine, metro, and data center interconnect fiber networks without electrical regeneration. We observed that the market has structurally evolved from single-band, C-band-only amplification toward multi-band C+L systems capable of nearly doubling usable fiber spectrum, as demonstrated by Lumentum's general availability of its 800G ZR+ C-band module alongside new L-band pluggable transceivers showcased at OFC 2025.

Regulatory environments vary by application, with submarine cable systems subject to landing-station and maritime permitting regimes while terrestrial networks follow national telecommunications infrastructure standards. During our market evaluation, we noticed that optical interconnect technology adoption is accelerating fastest within AI and cloud data center interconnect applications, as hyperscale operators drive unprecedented bandwidth demand across metro and regional fiber routes.

Market Drivers & Dynamics

Interactive Dataset
AI and hyperscale data center interconnect bandwidth demand driver +4.8% North America, Asia-Pacific 2026–2032
Multi-band C+L amplification expanding usable fiber spectrum driver +3.2% Global 2026–2033
Submarine cable system expansion connecting new digital hubs driver +2.4% Asia-Pacific, Middle East, Africa 2026–2032
Rising 400G/800G and higher coherent transmission adoption driver +1.8% North America, Europe 2026–2031
National digital infrastructure and broadband expansion programs driver +1.2% Asia-Pacific, Latin America 2026–2030
Intensifying cost-per-wavelength pricing pressure among vendors restraint −1.6% Global 2026–2030
High capital cost of submarine amplifier and repeater deployment restraint −1.1% Global 2026–2032
Long qualification cycles for new amplifier technology with carriers restraint −0.7% North America, Europe 2026–2029
Source: Next Move Strategy Consulting

Growth Drivers

What Is the Primary Growth Driver of the Optical Amplifier Market?

AI and hyperscale data center interconnect bandwidth demand is the single largest driver of optical amplifier sector growth, as compute clusters increasingly require high-capacity fiber connectivity between geographically dispersed data center campuses. Lumentum's public disclosures at OFC 2026 explicitly identified scale-out, scale-up, and scale-across AI infrastructure as a core demand driver for its optical amplification and laser portfolio. We observed that this AI-driven demand is compressing typical technology adoption cycles compared to historical telecom-only deployment patterns.

How Is Multi-Band Amplification Driving Optical Amplifier Market Growth?

Rising adoption of C+L band amplification is driving the fastest segment growth in the market, as operators seek to expand usable fiber spectrum without the capital cost of laying new cable. Lumentum's commercial availability of 800G ZR+ C-band modules alongside newly sampling L-band pluggable transceivers illustrates how vendors are commercializing multi-band capacity expansion at scale. Our analysis shows that the C+L Band segment is growing at an 18.7% CAGR from 2026 to 2035, well above the broader market average of 12.8%.

Growth Inhibitors

What Is Restraining Optical Amplifier Market Growth?

Intensifying cost-per-wavelength pricing pressure restrains vendor margins as carriers and hyperscalers negotiate aggressively on a per-unit-capacity basis amid rapid bandwidth scaling. High capital costs associated with submarine amplifier and repeater deployment also restrain new-route investment, given the multi-year construction and permitting timelines involved in subsea cable systems. We found that these pressures weigh most heavily on smaller vendors lacking the manufacturing scale of established leaders such as Lumentum and Coherent.

What Are the Growth Opportunities?

How Can Vendors Capture Value from AI Data Center Interconnect Retrofits?

Retrofitting existing metro fiber routes with amplification designed for AI data center interconnect creates a mechanism for vendors to capture recurring capacity-upgrade revenue as hyperscale operators scale compute clusters faster than new fiber can be laid. Vendors with proven high-power, low-noise amplifier platforms stand to benefit most from this fastest-growing application opportunity.

What Opportunity Exists in C+L Band Spectrum Expansion Upgrades?

C+L band amplification upgrades create a mechanism for carriers to nearly double usable fiber spectrum on existing long-haul and metro routes without capital-intensive new cable construction. Vendors offering integrated C and L wavelength selective switches and amplifiers are best positioned to capture this fastest-growing band-segment opportunity as fiber capacity constraints intensify.

How Can Suppliers Benefit from Submarine Cable System Expansion?

Continued submarine cable system expansion connecting new digital hubs across Asia-Pacific, the Middle East, and Africa creates a mechanism for amplifier and repeater suppliers to secure large, multi-year subsea project contracts. Vendors with proven ultra-long-haul hybrid Raman-EDFA technology are best positioned to capture this durable, infrastructure-anchored opportunity.

Segmentation Analysis

2025 (USD Billion)
2035 (USD Billion)
EDFA 2025: $1.77 Billion | 2035: $5.08 Billion
EDFA
Raman Amplifier 2025: $0.63 Billion | 2035: $1.88 Billion
Raman Amplif
Hybrid EDFA/Raman Amplifier 2025: $0.31 Billion | 2035: $1.88 Billion
Hybrid EDFA/
SOA 2025: $0.14 Billion | 2035: $0.56 Billion
SOA
EDFA $1.77 Billion $5.08 Billion 11.1%
Raman Amplifier $0.63 Billion $1.88 Billion 11.6%
Hybrid EDFA/Raman Amplifier $0.31 Billion $1.88 Billion 19.6%
SOA $0.14 Billion $0.56 Billion 14.8%

Which Amplifier Type Segment Dominates the Optical Amplifier Market?

EDFA dominates the optical amplifier sector with approximately 62% share in 2025, valued at USD 1.77 billion, reflecting its status as the established, cost-effective amplification standard across telecom networks, with Lumentum alone reporting over 200,000 deployed units. Hybrid EDFA/Raman Amplifier is the fastest-growing segment at a 19.6% CAGR from 2026 to 2035, as operators increasingly combine both technologies to extend transmission reach on ultra-long-haul and submarine routes without additional regeneration.

2025 (USD Billion)
2035 (USD Billion)
Long-haul an
Metro networ
Data center
Access netwo
Segment Item 2025 (USD Billion) 2035 (USD Billion) CAGR
Long-haul and submarine networks $10.0 USD Billion $40.0 USD Billion 18.0%
Metro networks $17.1 USD Billion $51.1 USD Billion 16.0%
Data center interconnect $24.2 USD Billion $62.2 USD Billion 22.0%
Access networks $31.3 USD Billion $73.3 USD Billion 12.0%

Segment-wise data is locked

Unlock complete segment-wise numbers for By Application.

Unlock Full Data

Which Application Segment Is Growing Fastest?

Long-Haul and Submarine Networks lead the application segmentation with approximately 48% share in 2025 at USD 1.37 billion, anchored by the amplification-intensive nature of ultra-long-distance terrestrial and subsea cable systems. Data Center Interconnect is the fastest-growing application at a 17.8% CAGR, driven directly by AI and cloud infrastructure buildout requiring high-capacity fiber connectivity between hyperscale data center campuses across metro and regional distances.

2025 (USD Billion)
2035 (USD Billion)
C-band
L-band
C+L band
O-band and o
Segment Item 2025 (USD Billion) 2035 (USD Billion) CAGR
C-band $10.0 USD Billion $40.0 USD Billion 22.0%
L-band $17.1 USD Billion $51.1 USD Billion 8.0%
C+L band $24.2 USD Billion $62.2 USD Billion 14.0%
O-band and other bands $31.3 USD Billion $73.3 USD Billion 20.0%

Segment-wise data is locked

Unlock complete segment-wise numbers for By Band.

Unlock Full Data

Which Band Segment Leads the Optical Amplifier Market?

C-Band leads the band segmentation with approximately 66% share in 2025 at USD 1.88 billion, reflecting its status as the default spectrum for the vast majority of installed DWDM amplification systems worldwide. C+L Band is the fastest-growing segment at an 18.7% CAGR, as vendors including Lumentum commercialize integrated C and L wavelength selective switches and amplifiers that expand usable spectrum on existing fiber without new cable construction.

2025 (USD Billion)
2035 (USD Billion)
Terrestrial
Submarine
Segment Item 2025 (USD Billion) 2035 (USD Billion) CAGR
Terrestrial $10.0 USD Billion $40.0 USD Billion 10.0%
Submarine $17.1 USD Billion $51.1 USD Billion 24.0%

Segment-wise data is locked

Unlock complete segment-wise numbers for By Deployment.

Unlock Full Data
2025 (USD Billion)
2035 (USD Billion)
Telecom serv
Cloud and hy
Government a
Enterprises
Segment Item 2025 (USD Billion) 2035 (USD Billion) CAGR
Telecom service providers $10.0 USD Billion $40.0 USD Billion 26.0%
Cloud and hyperscale data center operators $17.1 USD Billion $51.1 USD Billion 16.0%
Government and defense $24.2 USD Billion $62.2 USD Billion 18.0%
Enterprises $31.3 USD Billion $73.3 USD Billion 8.0%

Segment-wise data is locked

Unlock complete segment-wise numbers for By End User.

Unlock Full Data
2025 (USD Billion)
2035 (USD Billion)
North Americ
Canada
Mexico
Europe: UK
Germany
Segment Item 2025 (USD Billion) 2035 (USD Billion) CAGR
North America: U.S. $10.0 USD Billion $40.0 USD Billion 10.0%
Canada $17.1 USD Billion $51.1 USD Billion 8.0%
Mexico $24.2 USD Billion $62.2 USD Billion 18.0%
Europe: UK $31.3 USD Billion $73.3 USD Billion 8.0%
Germany $38.4 USD Billion $84.4 USD Billion 15.0%

Segment-wise data is locked

Unlock complete segment-wise numbers for By Region.

Unlock Full Data

Porter’s Five Forces Analysis of the Optical Amplifier Industry

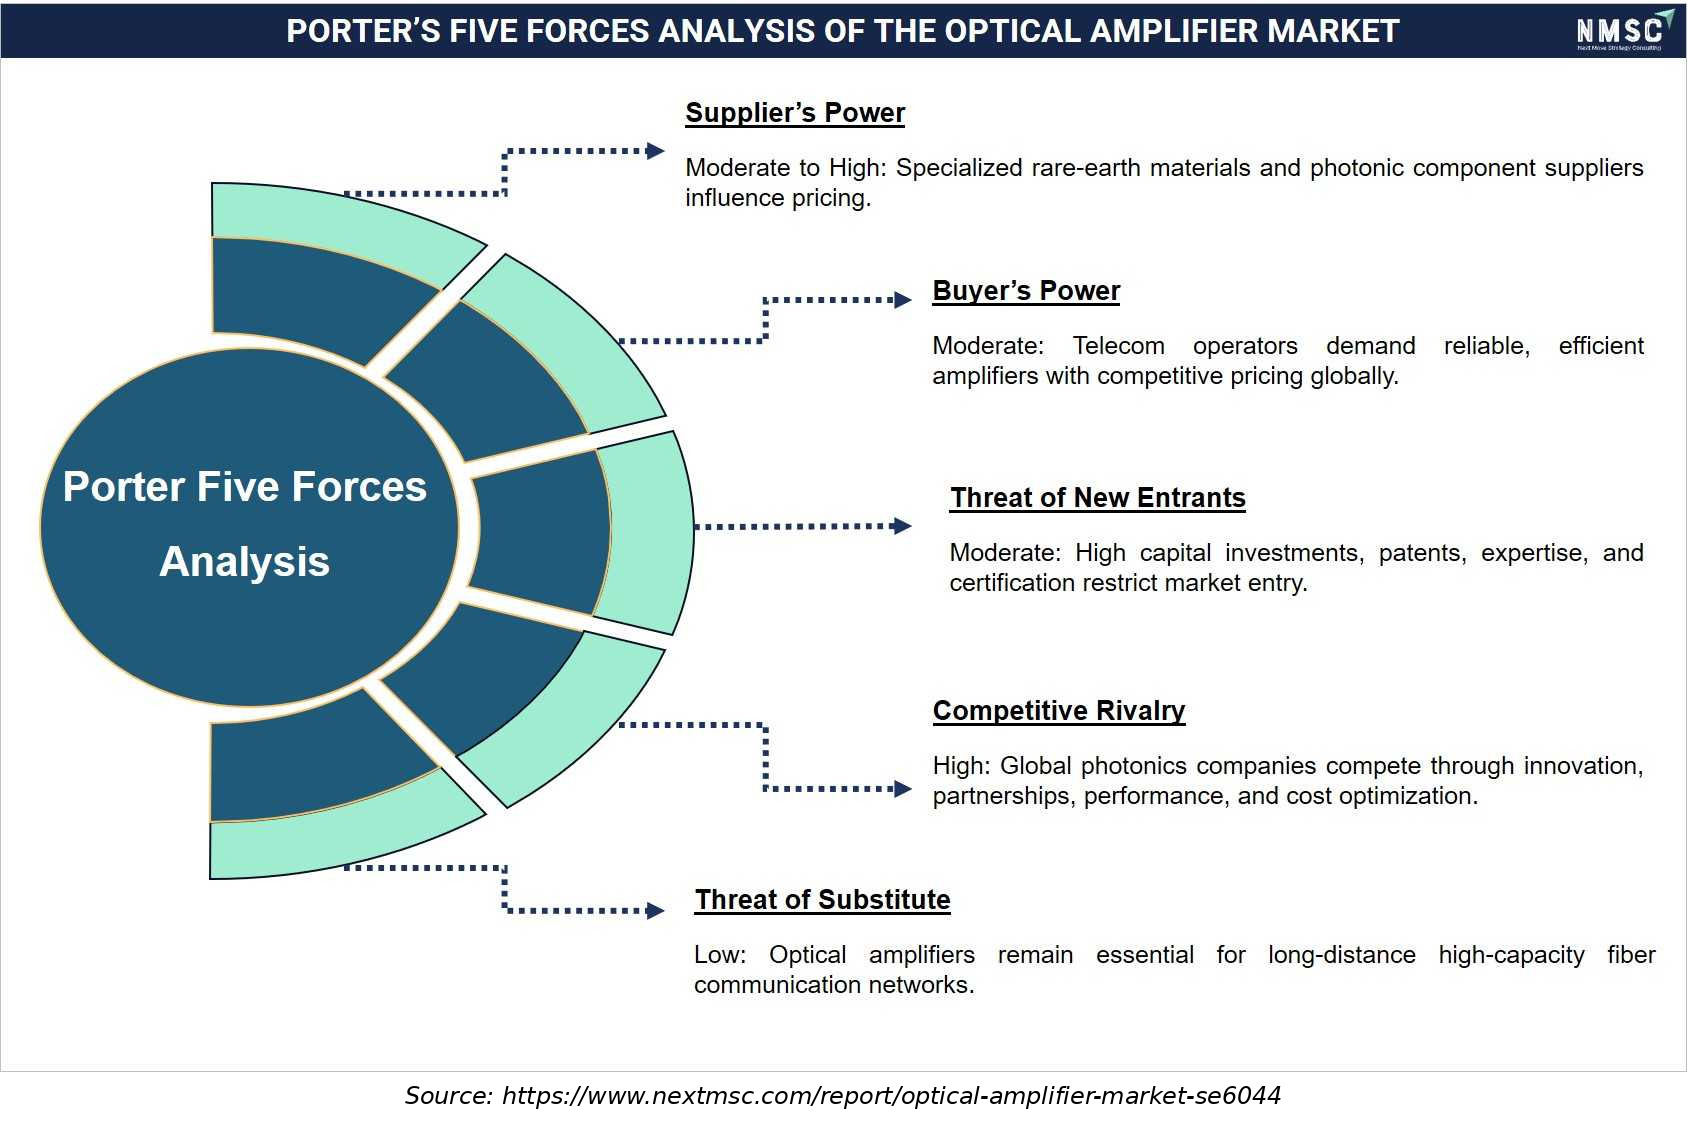
The above infographic presents a Porter's Five Forces analysis of the optical amplifier market, wherein supplier power remains moderate to high due to reliance on specialized rare-earth materials and photonic components. At the same time, buyer power is moderate, as telecom operators continue to demand reliable and competitively priced solutions. The threat of new entrants is constrained by certification and technical expertise requirements, while competitive rivalry remains intense among global photonics companies striving for innovation and cost optimization. Looking ahead, we observed that the threat of substitutes stays low, given that optical amplifiers are indispensable for long-distance, high-capacity fiber communications networks.

Growth Opportunities

Beyond the core drivers shaping overall demand, three whitespace opportunities stand out for optical amplifier vendors positioning portfolios toward 2035.

How Can Vendors Capture Value from AI Data Center Interconnect Retrofits?

Retrofitting existing metro fiber routes with amplification designed for AI data center interconnect creates a mechanism for vendors to capture recurring capacity-upgrade revenue as hyperscale operators scale compute clusters faster than new fiber can be laid. Vendors with proven high-power, low-noise amplifier platforms stand to benefit most from this fastest-growing application opportunity.

What Opportunity Exists in C+L Band Spectrum Expansion Upgrades?

C+L band amplification upgrades create a mechanism for carriers to nearly double usable fiber spectrum on existing long-haul and metro routes without capital-intensive new cable construction. Vendors offering integrated C and L wavelength selective switches and amplifiers are best positioned to capture this fastest-growing band-segment opportunity as fiber capacity constraints intensify.

How Can Suppliers Benefit from Submarine Cable System Expansion?

Continued submarine cable system expansion connecting new digital hubs across Asia-Pacific, the Middle East, and Africa creates a mechanism for amplifier and repeater suppliers to secure large, multi-year subsea project contracts. Vendors with proven ultra-long-haul hybrid Raman-EDFA technology are best positioned to capture this durable, infrastructure-anchored opportunity.

Regional Outlook

2025 (USD Billion)
2035 (USD Billion)
North Americ
Europe
Asia-Pacific
Middle East
Latin Americ
Region 2025 (USD Billion) 2035 (USD Billion) CAGR (%)
North America $10.0 USD Billion $40.0 USD Billion 9.0%
Europe $17.1 USD Billion $51.1 USD Billion 27.0%
Asia-Pacific $24.2 USD Billion $62.2 USD Billion 25.0%
Middle East & Africa $31.3 USD Billion $73.3 USD Billion 23.0%
Latin America $38.4 USD Billion $84.4 USD Billion 12.0%

Regional data is locked

Unlock complete regional numbers for this market.

Unlock Full Data

Supply Chain Analysis of the Optical Amplifier Industry

Supply Chain Analysis of the Optical Amplifier Industry
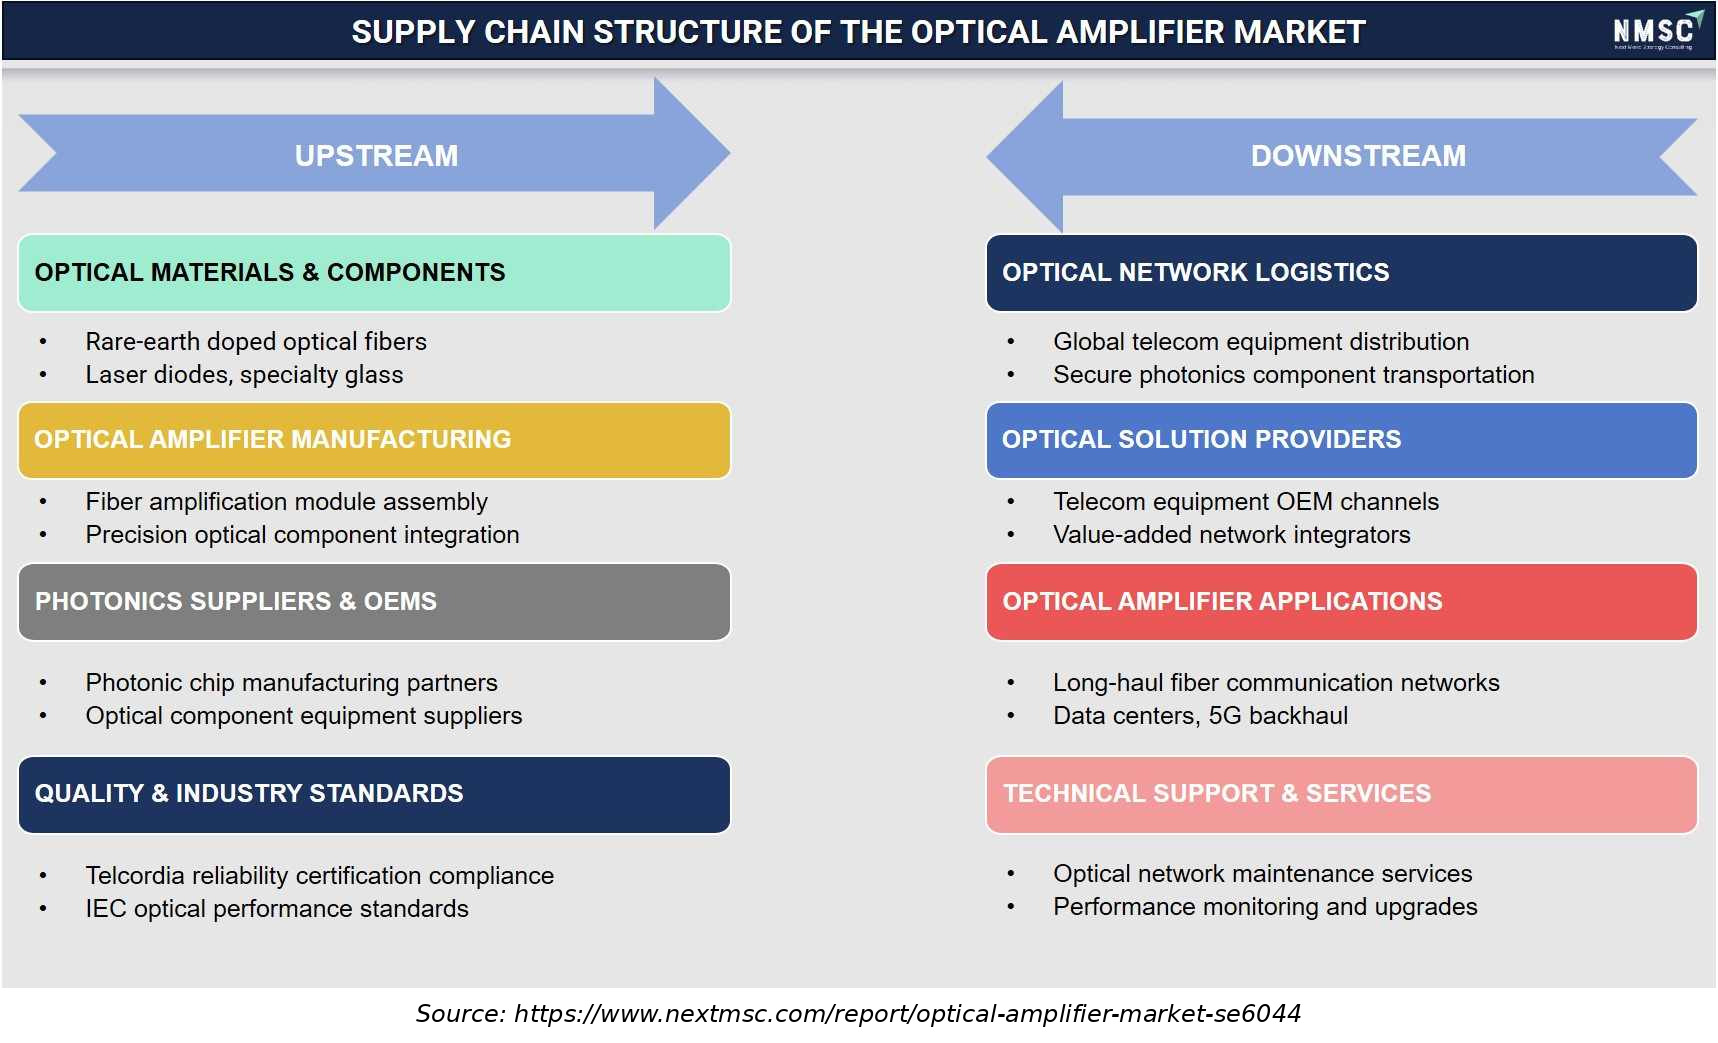
The above infographic presents the supply chain structure of the optical amplifier market, segmented into upstream and downstream activities. Upstream begins with rare-earth-doped fibers, laser diodes, and specialty glass, which are integrated into amplification modules and precision optical components with support from photonic chip manufacturers and equipment suppliers. Compliance with Telcordia and IEC standards ensures product quality and reliability throughout the production process. Moving downstream, global logistics and OEM channels enable distribution to long-haul networks, data centers, and 5G backhaul applications. Looking ahead, we observed that maintenance services and performance monitoring remain critical for sustaining network efficiency and operational continuity across the telecommunications sector.

Competitive Landscape

Our assessment indicates that competitive intensity in the optical amplifier market is shaped by a small group of vertically integrated photonics leaders and diversified network equipment vendors competing across telecom and hyperscale data center verticals within the broader opticalfiber technology industry.

Dimension Description
Dimension Assessment
Market Structure Moderately concentrated, with Lumentum, Coherent Corp, and Huawei collectively commanding substantial global amplifier and photonic component share.
Innovation Focus C+L band spectrum expansion, vertically integrated pump laser design, and AI data center interconnect-optimized amplification.
M&A Activity Selective technology partnerships and coherent optics ecosystem collaboration rather than large-scale horizontal consolidation.

How Do Companies Compete in the Optical Amplifier Market?

Companies compete primarily on gain performance, noise figure, spectrum coverage, and vertically integrated component manufacturing built over decades of photonics engineering. Our analysis shows that Lumentum and Coherent Corp compete heavily on proprietary pump laser and amplifier integration depth, while network equipment vendors including Ciena, Nokia, and Huawei compete on bundling amplification within complete coherent transport system platforms.

Which Competitive Archetypes Dominate the Optical Amplifier Market?

Two archetypes dominate the market: vertically integrated photonic component leaders manufacturing proprietary amplifier and laser technology, and diversified network equipment vendors bundling amplification within complete transport system platforms. Lumentum exemplifies the vertically integrated component archetype through its internally designed pump lasers and EDFA portfolio, while Ciena exemplifies the systems-integrator archetype through its WaveLogic coherent platform that incorporates amplification alongside transponder and switching technology.

How Are Companies Differentiating Through Innovation?

Innovation and differentiation increasingly center on multi-band spectrum expansion and AI infrastructure-optimized amplification. Lumentum's integrated C and L wavelength selective switch and amplifier portfolio, showcased alongside high-power laser sources for AI infrastructure at OFC 2026, illustrates how vendors are embedding proprietary spectrum and power-density advantages to differentiate beyond commodity C-band amplification.

What M&A and Expansion Activity Is Shaping the Optical Amplifier Market?

Expansion activity is concentrated in coherent optics ecosystem partnerships rather than large-format acquisitions. Ciena's extension of its WaveLogic coherent technology to industry partners including Lumentum, alongside Coherent Corp's open-market expansion of its transimpedance amplifier ASIC portfolio, illustrates how vendors are broadening technology reach through licensing and component partnerships rather than horizontal consolidation.

Competitive Dynamics and M&A Landscape

Recent strategic moves, partnerships, and acquisitions shaping the Optical Amplifier Market.

March 2026 Nokia Product Launch March 2026 | Nokia launched a compact in-line amplifier optimized for multi-fiber applications as part of a new optical-networking portfolio for AI-era networks. The solution enables operators to deliver up to 40× more services in the same footprint, addressing rising bandwidth and space requirements.
March 2026 Coherent Product Enhancement March 2026 | Coherent enhanced its compact multi-rail transport platform to support four C+L-band transport rails in a single 1RU in-line amplifier card. The architecture pools resources across rails to increase transport capacity and power efficiency within the same equipment footprint.
March 2026 Ciena Product Unveiling March 2026 | Ciena unveiled new hyper-rail photonics amplifier configurations developed with hyperscalers and service providers. The configurations support up to 32× the density of conventional solutions, or 128 fiber pairs in a single rack, while reducing power consumption by up to 75% and space requirements by 85%.
March 2026 Coherent Product Introduction March 2026 | Coherent introduced uncooled single-mode micro-pump lasers delivering up to 700 mW output with less than 3 W power consumption per fiber across a wide temperature range. The company designed the technology for optical-network amplifier architectures requiring higher output power without increasing footprint or energy consumption.
February 2026 Ciena Strategic Outline February 2026 | Ciena outlined its “scale-across” optical networking approach for hyperscalers and service providers, describing new coherent and photonic innovations designed to support distributed AI training across regional and multi-regional networks and address growing capacity, space, and power requirements.

Key Market Players

Our assessment indicates that the following companies are actively shaping amplifier technology innovation, manufacturing scale, and carrier and hyperscale customer relationships within the global optical amplifier market.

Lumentum Holdings Inc. Coherent Corp. Nokia Corporation Ciena Corporation Infinera Corporation Huawei Technologies Co., Ltd. ZTE Corporation Fujitsu Limited NEC Corporation Furukawa Electric Co., Ltd. Cisco Systems, Inc. IPG Photonics Corporation Amonics Limited Accelink Technologies Co., Ltd. Thorlabs, Inc. EFFECT Photonics B.V. Company 17 Company 18 Company 19 Company 20

Expert Insights

Madhu Krishnaswamy

Senior Vice President and General Manager, Telecom Transport Business Unit | Coherent

"The introduction of our multi-rail technology is a groundbreaking advance in optical transport. This integrated platform will meet escalating bandwidth demands driven by data center interconnects and AI cluster applications."

Analyst Interpretation

The statement highlights the growing need for higher-capacity and more efficient optical transport infrastructure as data-center interconnects and AI clusters generate rapidly increasing bandwidth requirements. NMSC's analysis indicates that optical amplifiers are becoming increasingly important for scaling fiber-optic networks while maintaining signal quality, transmission capacity, and power efficiency. Innovations such as multi-rail architectures and integrated amplification are supporting higher network density without proportionally increasing equipment footprint.

Key Benefits for Stakeholders

How Does This Report Benefit Enterprise and Industry Leaders?

Enterprise and industry leaders gain access to validated segmentation, competitive benchmarking, and regional demand forecasts that support technology-investment and vendor-selection decisions across the optical amplifier industry. Our analysis shows that detailed amplifier type, application, and band breakdowns help network-planning teams align procurement strategy with the fastest-growing segments, including Hybrid EDFA/Raman Amplifier and Data Center Interconnect.

How Does This Report Benefit Investors and Financial Analysts?

Investors and financial analysts benefit from consistent, single-point market size and CAGR estimates that support valuation and capital-allocation decisions across the optical amplifier supply chain. We observed that the report's regional and segment-level growth differentials help identify which vendors are best positioned to capture above-market growth in AI data center interconnect and Asia-Pacific expansion through 2035.

How Does This Report Benefit Technology Vendors and Product Teams?

Technology vendors and product teams gain insight into emerging design requirements, including multi-band spectrum expansion, vertically integrated pump laser manufacturing, and AI infrastructure-optimized amplification, that are reshaping the industry. Our findings suggest that this analysis helps R&D teams prioritize development roadmaps around the C+L Band and Cloud and Hyperscale Data Center Operators segments, showing the strongest above-market growth trajectories.

Key Market Segments Evaluated

By Amplifier Type

  • EDFA
  • Raman amplifier
  • Hybrid EDFA/Raman amplifier
  • SOA

By Application

  • Long-haul and submarine networks
  • Metro networks
  • Data center interconnect
  • Access networks

By Band

  • C-band
  • L-band
  • C+L band
  • O-band and other bands

By Deployment

  • Terrestrial
  • Submarine

By End User

  • Telecom service providers
  • Cloud and hyperscale data center operators
  • Government and defense
  • Enterprises

By Region

  • North America 
    • U.S.
    • Canada
    • Mexico
  • Europe 
    • UK
    • Germany
    • France
    • Italy
    • Spain
    • Sweden
    • Denmark
    • Finland
    • Netherlands
    • Rest of Europe
  • Asia-Pacific 
    • China
    • India
    • Japan
    • South Korea
    • Taiwan
    • Indonesia
    • Vietnam
    • Australia
    • Philippines
    • Malaysia
    • Rest of APAC
  • Middle East & Africa 
    • Saudi Arabia
    • UAE
    • Egypt
    • Israel
    • Turkey
    • Nigeria
    • South Africa
    • Rest of MEA
  • Latin America 
    • Brazil
    • Argentina
    • Chile
    • Colombia
    • Rest of LATAM

Conclusion & Recommendations

The long-term outlook for the optical amplifier market remains strongly positive, with global revenue projected to more than triple from USD 2.85 billion in 2025 to USD 9.40 billion by 2035 at a 12.8% CAGR. We observed that AI-driven data center interconnect demand, multi-band spectrum expansion, and submarine cable system growth will continue underpinning demand across telecom and hyperscale applications through the forecast period.

What Strategic Positioning Should Optical Amplifier Vendors Pursue?

Vendors should prioritize C+L band and hybrid amplification technology while maintaining vertically integrated pump laser manufacturing to sustain performance and cost advantages. Our assessment indicates that vendors investing early in AI infrastructure-optimized amplification will be best positioned to capture premium hyperscale revenue while retaining established telecom carrier relationships.

How Attractive Is the Optical Amplifier Market for New Investment?

The optical amplifier market presents an attractive investment case, supported by a USD 6.22 billion absolute dollar opportunity between 2026 and 2035 and above-average growth in Data Center Interconnect and C+L Band segments. We found that investment attractiveness is highest for vendors combining proven amplifier manufacturing scale with validated hyperscale customer design wins, positioning them to serve both mature telecom demand and rapidly scaling AI infrastructure growth simultaneously.

What Market Shifts and Key Risks Should Stakeholders Monitor?

Stakeholders should monitor intensifying cost-per-wavelength pricing pressure, high submarine deployment capital costs, and long carrier qualification cycles as key risks to the optical amplifier market. Our analysis shows that vendors unable to demonstrate differentiated spectrum or power-efficiency advantages risk losing share to lower-cost competitors as amplification increasingly commoditizes at the C-band tier.

What Are the Key Growth Pathways for the Optical Amplifier Market?

Key growth pathways include scaling C+L band and hybrid amplification platforms, deepening AI infrastructure-optimized product lines following precedents set at OFC 2026, and expanding submarine cable system participation as new digital hubs come online. Next Move Strategy Consulting's analysis indicates that vendors pursuing these pathways while maintaining manufacturing cost discipline will be best positioned to capture the market's projected growth through 2035.

FAQs

Investment Opportunities

What Capital Inflows Are Targeting the Optical Amplifier Market?

Capital inflows are increasingly directed toward multi-band amplification and AI infrastructure-optimized photonics, with established vendors continuing substantial R&D investment in C+L band and high-power laser technology. We observed that investors favor vendors demonstrating validated hyperscale customer relationships, viewing AI data center interconnect design wins as a proxy for durable, multi-year revenue growth beyond cyclical telecom carrier spending.

How Is Infrastructure Investment Supporting Optical Amplifier Market Growth?

Infrastructure investment tied to submarine cable system expansion and national digital infrastructure programs continues to underwrite amplifier demand across both terrestrial and subsea applications. Our findings suggest that vendors with proven ultra-long-haul hybrid amplification technology are best positioned to capture this infrastructure-anchored investment flow as new submarine cable routes continue connecting emerging digital hubs through 2035.

What ESG Considerations Are Shaping Investment Decisions?

Energy efficiency is a central governance consideration shaping investment decisions, as amplifier power consumption directly affects the operating costs and carbon footprint of large-scale fiber networks and data center interconnect systems. We found that investors increasingly treat power-efficient amplifier design, such as Coherent Corp's low-power transimpedance amplifier products, as a governance indicator alongside conventional financial performance metrics.

About the Author

Mayurima Roy

Mayurima Roy

Mayurima Roy is Research Analyst at Next Move Strategy Consulting, where she has spent 4 years working across the firm's full industry coverage rather than a single fixed vertical. Her work centers on structured research, ongoing trend tracking, competitive assessment, and insight-led content development, translating complex market data into clear, decision-ready narratives that support informed client decision-making across diverse global industries, market sectors, and world regions every day.

About the Reviewer

Supradip Baul

Supradip Baul

Supradip Baul is an accomplished business consultant and strategist with over a decade of rich experience in market intelligence, strategy, technology, and business transformation. His work has included rigorous qualitative and quantitative analysis across multiple industries, helping clients shape investment decisions and long-term roadmaps. Earlier in his career, he was associated with Gartner, where he contributed to industry-leading reports and market share analyses. He has worked with leading global companies and holds an MBA with a dual specialization in Marketing and Finance.

Download Free Sample

Kevin Coker

KEVIN COKER

Founder, CEO and Board Diector

Proxima Clinical Research

I have been using Next MSC reports for product positioning in a new geography for a long time. They have by far the best reports I have found and the price is reasonable too!

Henri Knyphausen

HENRI KNYPHAUSEN

Partner at Singulier [Ex-BCG]

Singulier

I recently engaged NEXTMSC.com for a commercial due diligence project within the intralogistics sector, and I am pleased to provide a reference based on my experience. In utilizing NEXTMSC.com's services, I found their report to offer valuable insights into market dynamics and key industry players. The initial report provided a solid foundation for our analysis. However, as we were investigating a smaller target in the market, and I had specific customization requests requiring additional research. These requests included detailed information on product portfolios of various players and sub-market sizes, both inclusive and exclusive of certain product categories. NEXTMSC.com demonstrated commendable responsiveness and agility in accommodating these customization requests. Within a timeframe of 1-2 weeks, they delivered a revised report that met our specific needs. Furthermore, they were receptive to my follow-up inquiries, ensuring clarity and understanding of the data provided. The final deliverable significantly contributed to our due diligence efforts. One of NEXTMSC.com's notable strengths lies in their qualitative research capabilities. However, for future engagements, I would recommend the inclusion of a quantified market model in Excel format. Such a model would offer the ability to conduct in-depth analyses and explore various market segments, including country-specific data and subcomponent breakdowns. Based on my positive experience, I would not hesitate to work with NEXTMSC.com again. Their responsiveness, willingness to accommodate customization requests, and commitment to delivering actionable insights make them a reliable partner for commercial research projects.

Mohit Agarwal

MOHIT AGARWAL

Chief Manager

DryChem India Pvt. Ltd.

Next Move Strategy Consulting is an amazing team of consultants. We required a market study report for our investors on top priority and the team went above and beyond our expectations to deliver the same with ample supporting data within a short time span enabling us to secure the investments and keep our project timeline maintained. Their professionalism, attention to detail, and timely delivery of actionable recommendations have left a lasting impression on our organization.

Nishant Awate

NISHANT AWATE

Business Development Global Sales

Zehnder Group Deutschland GmbH

Our experience working with Next Move Strategy Consulting was positive. The team was responsive, professional, and open to incorporating our specific requirements throughout the project. The India AHU market study was comprehensive and well structured, covering market value and volume forecasts, product and application segments, and key industry trends. The inclusion of both AHU and residential MVHR market insights made the study particularly relevant for our strategic market assessment. Overall, the report provides a solid foundation for evaluating market potential, identifying priority segments, and supporting business-development decisions in India.

Gaurav Jaiswal

GAURAV JAISWAL

Founder & CEO

Yano Charge Private Limited

The EV Charging market research report provided by the NextMSC was exceptionally detailed and insightful. It offered a comprehensive analysis that proved to be a game-changer for our strategic planning. Truly a testament to the NextMSC’s expertise and thoroughness in EV market landscape & analysis.

Custom Market Research Services

We will customize the research for you if the listed report does not fully match your requirements.

Get 30% Free Customization

Select License

This website uses cookies to ensure you get the best experience on our website. Learn more

✖