800G Optical Transceiver Market Size, Share, Trends and Growth Analysis, By Transmission Type (Direct Detect, and Coherent), By Form Factor (OSFP, QSFP-DD, CFP2, and Other Form Factors), By Optical Engine (VCSEL Based, EML Based, Silicon Photonics, TFLN Based, and Other Optical Engine), By Signal Processing, By Application, By Sales Channel, By Customer Type (Hyperscale Cloud and AI, Telecom Carrier and others), and Region — Global Industry Report and Forecast, 2026–2035
Industry: Semiconductor & Electronics | Publishing Date: July 25, 2026 | Last Updated: September 30, 2026 | No of Pages: N/A | No. of Tables: N/A | No. of Figures: N/A | Format: PDF | Report Code: SE5400
What Is the 800G Optical Transceiver Market Size?
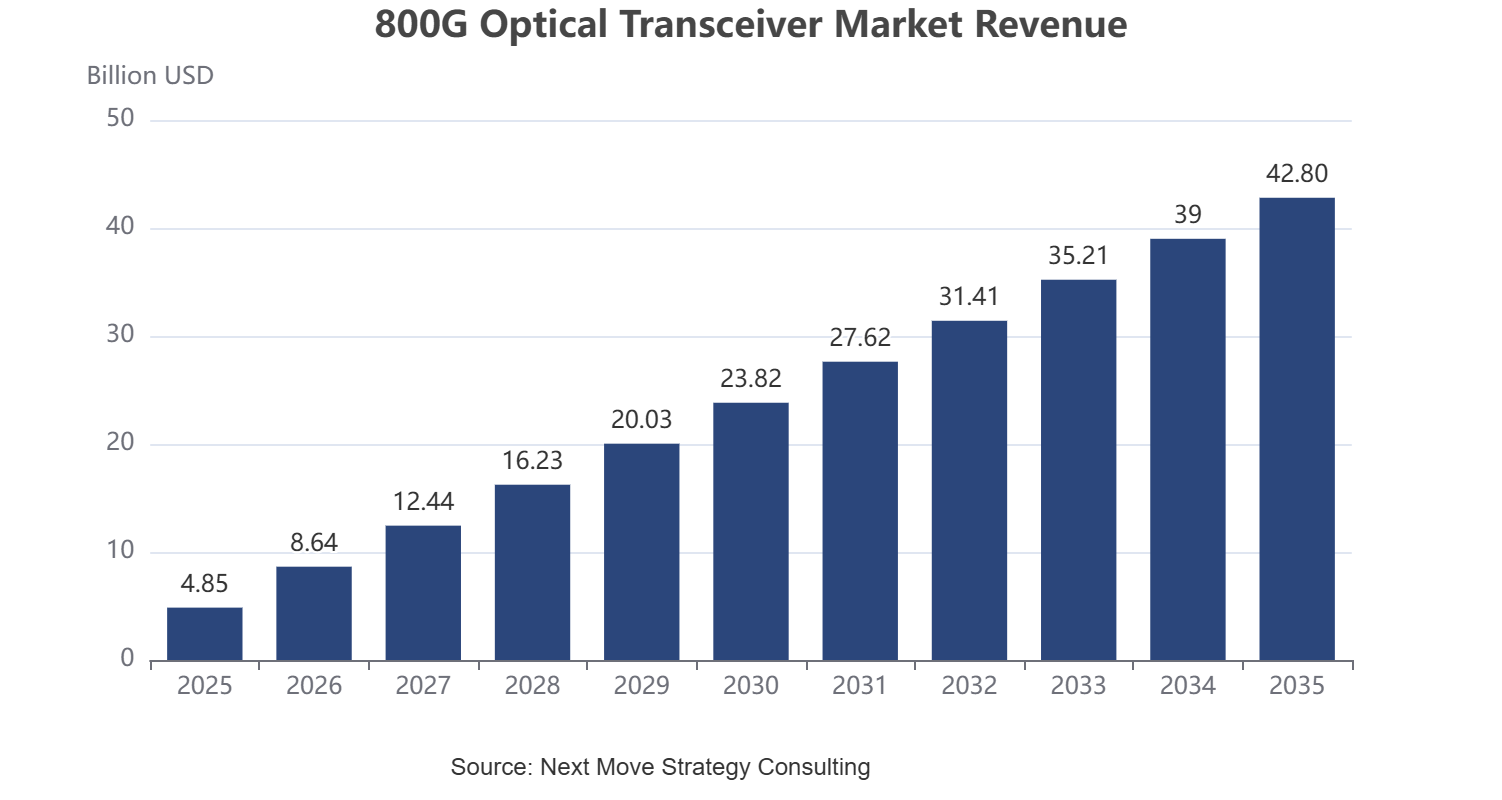
The global 800G optical transceiver market size was valued at USD 4.85 billion in 2025 and is estimated at USD 6.15 billion in 2026, forecast to reach USD 42.80 billion by 2035, expanding at a 24.1% CAGR between 2026 and 2035. North America leads with approximately 36% share, while direct detect modules dominate all other transmission types with approximately 64% share.
We observed that the growth is broad-based across every segmentation axis, with AI cluster interconnect deployment and silicon photonics adoption driving the dominant structural shifts through 2035.
|
Key Takeaways |
|
By Transmission Type: Direct Detect held the largest share of approximately 64% (USD 3.10 Billion) in 2025; Coherent is the fastest-growing sub-segment at 30.7% CAGR from 2026–2035. |
|
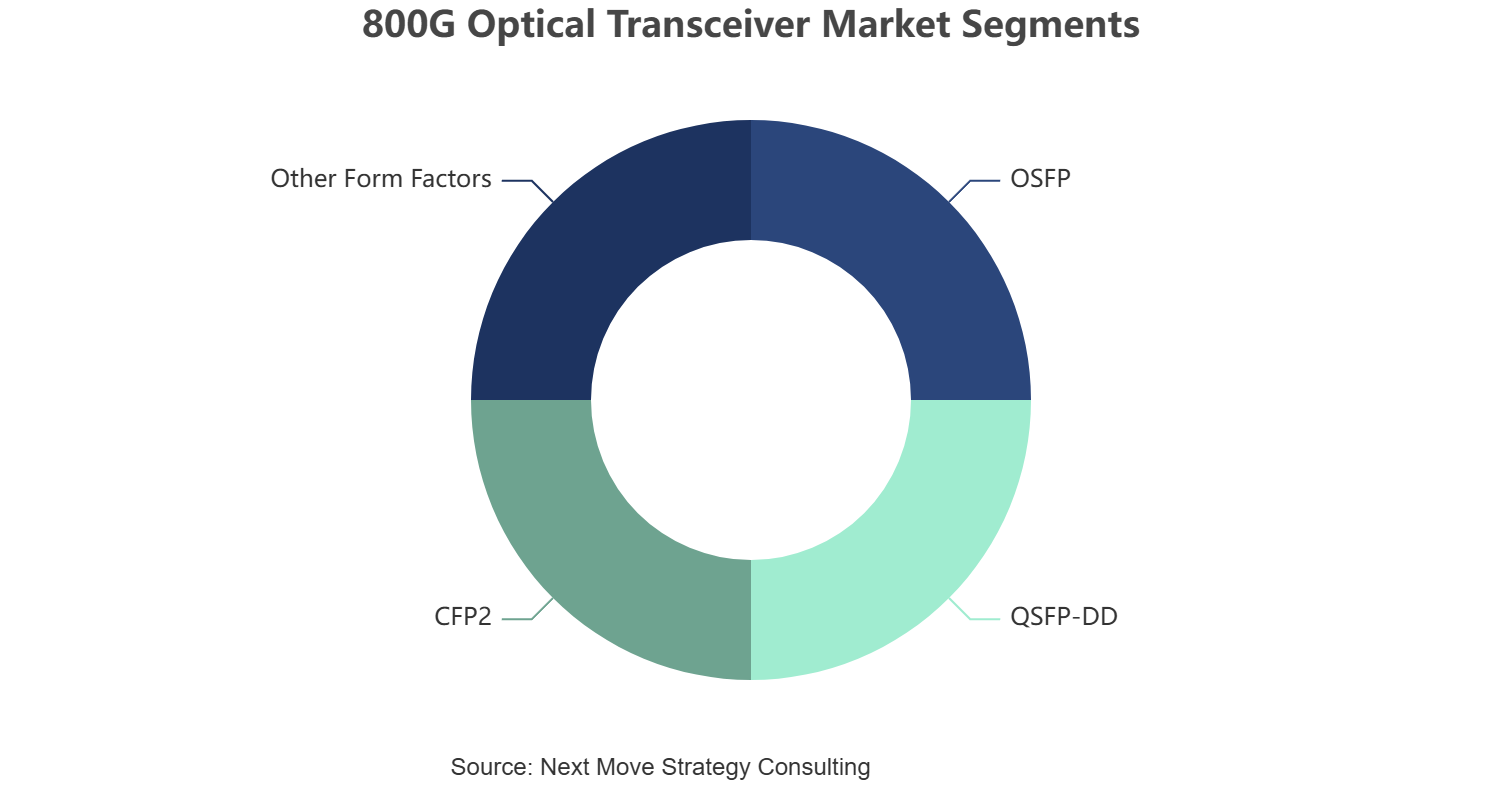
By Form Factor: OSFP held the largest share of approximately 46% (USD 2.23 Billion) in 2025; QSFP-DD is the fastest-growing sub-segment at 28.8% CAGR from 2026–2035. |
|
By Optical Engine: EML Based held the largest share of approximately 38% (USD 1.84 Billion) in 2025; TFLN Based is the fastest-growing sub-segment at 33.2% CAGR from 2026–2035. |
|
By Signal Processing: DSP Based held the largest share of approximately 72% (USD 3.49 Billion) in 2025; Linear Drive is the fastest-growing sub-segment at 35.1% CAGR from 2026–2035. |
|
By Application: AI and HPC Cluster Interconnect and Hyperscale Data Centre Internal Network are the fastest-growing application segments, each expanding at a CAGR of 28.4% from 2026–2035. |
|
By Sales Channel: Direct Key Account held the largest share of approximately 54% (USD 2.62 Billion) in 2025; OEM Captive is the fastest-growing sub-segment at 28.6% CAGR from 2026–2035. |
|
By Customer Type: Hyperscale Cloud and AI held the largest share of approximately 58% (USD 2.81 Billion) in 2025; Networking OEM is the fastest-growing sub-segment at 29.3% CAGR from 2026–2035. |
|
Dominant Region: North America dominated with approximately 36% revenue share (USD 1.75 Billion) in 2025. |
|
Fastest-Growing Region: Asia-Pacific is expected to register the highest CAGR of 29.0% during 2026–2035. |
|
Dominant Country: U.S. led with approximately USD 1.30 Billion in 2025. |
|
Fastest-Growing Country: India is the fastest-growing country at approximately 31.5% CAGR from 2026–2035. |
Market Opportunity: The 800G optical transceiver market is expected to create an absolute dollar opportunity of USD 36.65 billion between 2026 and 2035, presenting significant investment potential across the hyperscale, AI cluster, and telecom transport value chain
According to Next Move Strategy Consulting analysis, hyperscale operators are increasingly qualifying multiple transceiver suppliers per platform generation to de-risk AI cluster build-outs, a shift that favors diversified manufacturers with silicon photonics and linear-drive roadmaps over single-technology specialists as 1.6T migration approaches.
800G Optical Transceiver Market Overview
What Does the 800G Optical Transceiver Market Encompass?
The 800G optical transceiver market encompasses pluggable and co-packaged modules that convert electrical signals into optical signals at 800 gigabit-per-second aggregate throughput for switch-to-switch, switch-to-server, and long-haul transport links. Our assessment indicates that the scope spans direct detect and coherent architectures supplied to hyperscale cloud operators, telecom carriers, and networking OEMs supporting AI training clusters, hyperscale data center fabrics, and metro optical interconnect deployments worldwide. The category has evolved from a niche high-speed networking component into a mainstream AI infrastructure building block, driven by generative AI compute scaling, GPU cluster fabric density, and the transition from 400G to 800G and 1.6T generations.
Regulatory frameworks such as the U.S. Federal Communications Commission's spectrum and equipment authorization rules and the European Union's RoHS and REACH directives shape component sourcing and material compliance for transceiver manufacturing, while U.S. Bureau of Industry and Security export control classifications increasingly influence which optical engine technologies can be shipped to specific destinations. We observed that technology adoption is shifting toward linear-drive and co-packaged optics architectures that reduce power consumption per bit, a critical constraint as AI cluster interconnect fabrics scale beyond 100,000 GPU domains. Next Move Strategy Consulting's analysis indicates that this structural shift, combined with silicon photonics integration, is redefining sourcing criteria across the 800G optical transceiver market.
|
Parameters |
Details |
|
Market Size in 2025 |
USD 4.85 Billion |
|
Market Size in 2026 |
USD 6.15 Billion |
|
Revenue Forecast in 2035 |
USD 42.80 Billion |
|
Growth Rate |
CAGR of 24.1% from 2026 to 2035 |
|
Analysis Period |
2025–2035 |
|
Base Year Considered |
2025 |
|
Forecast Period |
2026–2035 |
|
Market Size Estimation |
Revenue (USD Billion) |
|
Companies Profiled |
20 |
|
Countries Covered |
33 |
|
Market Share |
Available for Top 10 Companies |
Key Emerging Trends
Based on research conducted by Next Move Strategy Consulting, we found that four structural trends are reshaping product development, sourcing, and stakeholder engagement across the industry.
How Is Silicon Photonics Transforming 800G Transceiver Design?
Silicon photonics integration is replacing discrete indium phosphide component architectures to meet density and cost targets for AI cluster deployments. We observed that Coherent Corp. expanded its silicon photonics manufacturing capacity in 2025 to support 800G and emerging 1.6T module volumes for hyperscale customers. Networking OEMs are qualifying silicon photonics platforms to satisfy GPU cluster bandwidth-per-watt targets, while contract manufacturers retool test lines to accommodate wafer-scale photonic integration across data center and AI interconnect applications.
Why Are Linear-Drive Modules Gaining Adoption in AI Clusters?
Linear-drive pluggable optics, which remove the DSP retiming stage, are gaining share as hyperscale operators respond to power and latency constraints inside AI training fabrics. Our findings suggest that GPU cluster interconnect links increasingly specify linear pluggable optics to reduce per-port power draw across short-reach switch-to-server topologies. Manufacturers such as InnoLight and Eoptolink are expanding linear-drive portfolios, positioning these formats as a lower-power, latency-sensitive category within the broader market segmentation structure.
How Is Co-Packaged Optics Reshaping Switch Architecture Requirements?
Co-packaged optics integration is pushing switch vendors toward tighter electrical-optical proximity to reduce insertion loss and power at 800G and beyond. We observed that leading networking OEMs are piloting co-packaged switch platforms alongside conventional pluggable modules for next-generation AI fabric deployments. This trend is elevating demand for photonic engine suppliers among switch platform integrators, while ecosystem partners redesign thermal and mechanical interfaces to accommodate tighter optical-electrical integration.
What Role Does 1.6T Migration Play in 800G Transceiver Innovation?
Early 1.6T qualification cycles are shaping 800G product roadmaps as hyperscale operators plan multi-generation AI cluster upgrades. Our analysis shows that module suppliers in the coherent and direct detect segments are piloting dual-rate platforms compatible with both 800G and forthcoming 1.6T deployments to protect customer tooling investment. Lumentum Holdings' expanded indium phosphide and thin-film lithium niobate production, announced in 2025, exemplifies this direction with a scalable photonic engine platform engineered for repeat use across successive transceiver generations.
Ecosystem Analysis of the 800G Optical Transceiver Market
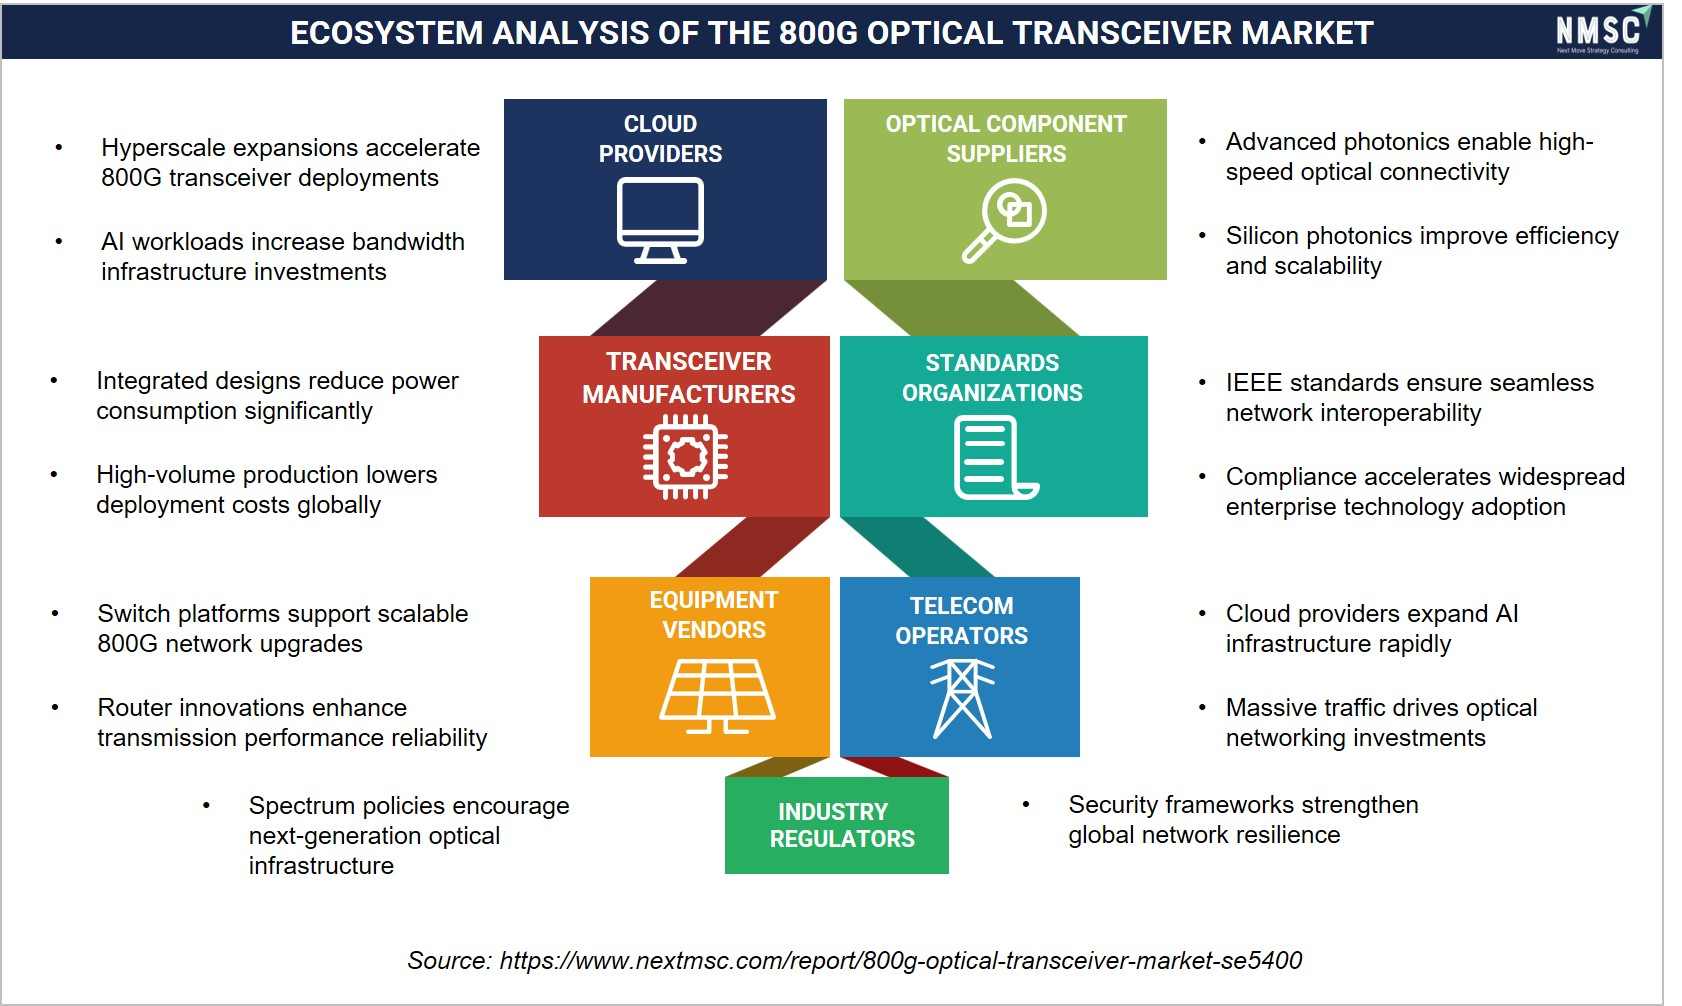
Our analysis indicates that the 800G Optical Transceiver Market operates through a collaborative ecosystem involving cloud providers, optical component suppliers, transceiver manufacturers, equipment vendors, telecom operators, standards organizations, and industry regulators. Cloud service providers and telecom operators drive demand for high-speed optical connectivity, while component suppliers and manufacturers accelerate product innovation. Industry standards and regulatory frameworks ensure interoperability, performance consistency, and reliable deployment across next-generation AI data centers and hyperscale network infrastructures.
Growth Drivers and Restraints
Growth Catalyst and Risk Assessment Matrix
|
Factors |
Type |
(+/−) % Impact on CAGR |
Geographic Relevance |
Impact Timeline |
|
Rapid scaling of generative AI training clusters |
Driver |
+3.4% |
Global |
2026–2035 |
|
Hyperscale data center capacity expansion |
Driver |
+2.6% |
North America, Asia-Pacific |
2026–2035 |
|
Migration from 400G to 800G switch fabrics |
Driver |
+2.1% |
Global |
2026–2032 |
|
Silicon photonics and co-packaged optics adoption |
Driver |
+1.7% |
North America, Asia-Pacific, Europe |
2026–2035 |
|
Telecom metro and long-haul coherent upgrades |
Driver |
+1.2% |
Europe, Asia-Pacific |
2026–2035 |
|
Sovereign and government AI infrastructure investment |
Driver |
+1.0% |
Global |
2027–2035 |
|
High module power consumption per bit |
Restraint |
-1.4% |
Global |
2026–2032 |
|
Export control restrictions on advanced optical components |
Restraint |
-1.1% |
Asia-Pacific, North America |
2026–2035 |
|
Optical component supply chain concentration risk |
Restraint |
-0.7% |
Global |
2026–2030 |
What Is the Primary Growth Driver of the 800G Optical Transceiver Market?
Rapid scaling of generative AI training clusters is the primary driver of the market. The U.S. National Science Foundation continues to fund large-scale computing infrastructure research, sustaining demand for high-bandwidth GPU-to-GPU interconnect fabrics across national laboratories and university consortia. We observed that this compute-scaling trend, reinforced by hyperscale data center capacity additions, continues to anchor baseline consumption of direct detect and OSFP-format transceivers across leading cloud providers and AI infrastructure operators alike.
How Is Hyperscale Data Center Expansion Driving Market Growth?
Continued hyperscale capacity build-out is accelerating market growth toward higher-density optical fabrics. The U.S. Energy Information Administration tracks rising data center electricity consumption tied to AI workload growth, which is pushing operators to specify higher-bandwidth, lower-power optical links per rack. Our assessment indicates that this infrastructure investment pattern, combined with GPU cluster interconnect requirements, is compressing qualification timelines for silicon photonics and linear-drive module architectures across North America and Asia-Pacific.
What Is Restraining 800G Optical Transceiver Market Expansion?
High module power consumption per transmitted bit restrains data center power budget allocation and rack density planning. The U.S. Department of Energy tracks recurring data center power infrastructure constraints that limit how quickly operators can deploy additional optical ports per facility. We found that smaller regional carriers face particular exposure, as limited power infrastructure reduces their ability to adopt high-density 800G fabrics compared with large, vertically integrated hyperscale operators.
Segmentation Analysis
Segment Sizing: By Transmission Type
|
Segment |
2025 (USD) |
2035 (USD) |
CAGR% (2026–2035) |
|
Direct Detect |
USD 3.10 Billion |
USD 23.33 Billion |
25.1% |
|
Coherent |
USD 1.75 Billion |
USD 19.47 Billion |
30.7% |
|
Total |
USD 4.85 Billion |
USD 42.80 Billion |
24.1% |
Which Transmission Type Dominates the 800G Optical Transceiver Market?
Direct detect modules dominate the transmission type segment, supported by their lower cost and power profile for short and mid reach GPU cluster and switch fabric links. We observed that coherent modules are the fastest-growing sub-segment as metro and long-haul carriers upgrade transport networks to 800G ZR and ZR Plus formats. This dual dynamic reflects distinct demand drivers, with AI cluster interconnect favoring direct detect and telecom transport favoring coherent adoption through 2035.
Segment Sizing: By Optical Engine
|
Segment |
2025 (USD) |
2035 (USD) |
CAGR% (2026–2035) |
|
VCSEL Based |
USD 0.48 Billion |
USD 2.57 Billion |
20.3% |
|
EML Based |
USD 1.84 Billion |
USD 12.84 Billion |
24.1% |
|
Silicon Photonics |
USD 1.55 Billion |
USD 16.26 Billion |
29.8% |
|
TFLN Based |
USD 0.58 Billion |
USD 7.70 Billion |
33.2% |
|
Other Optical Engine |
USD 0.40 Billion |
USD 3.43 Billion |
27.4% |
|
Total |
USD 4.85 Billion |
USD 42.80 Billion |
24.1% |
Which Optical Engine Technology Leads the 800G Optical Transceiver Market?
EML based engines lead the optical engine segment given their maturity and cost efficiency across established direct detect module families. We found that silicon photonics is the largest emerging category by absolute growth, while VCSEL based engines retain a foothold in shorter-reach, cost-sensitive applications. TFLN based engines post the fastest CAGR as coherent module suppliers adopt thin-film lithium niobate modulators for higher baud-rate performance.
Segment Sizing: By Application
|
Segment |
2025 (USD) |
2035 (USD) |
CAGR% (2026–2035) |
|
AI and HPC Cluster Interconnect |
USD 1.99 Billion |
USD 18.83 Billion |
28.4% |
|
Hyperscale Data Centre Internal Network |
USD 1.31 Billion |
USD 12.41 Billion |
28.4% |
|
Data Centre Interconnect |
USD 0.78 Billion |
USD 5.56 Billion |
24.5% |
|
Telecom Transport and Backhaul |
USD 0.44 Billion |
USD 3.00 Billion |
23.9% |
|
Enterprise Data Centre and Campus |
USD 0.24 Billion |
USD 2.14 Billion |
27.4% |
|
Other Application |
USD 0.09 Billion |
USD 0.86 Billion |
27.4% |
|
Total |
USD 4.85 Billion |
USD 42.80 Billion |
24.1% |
Which Application Segment Is Growing Fastest?
AI and HPC cluster interconnect is the dominant application, reflecting concentrated capital spending on GPU training fabrics by leading hyperscale operators. Our analysis shows that hyperscale data centre internal network deployment is expanding at a comparable pace as general-purpose cloud fabrics adopt 800G uplinks. Telecom transport and backhaul applications grow more moderately, constrained by longer carrier upgrade cycles relative to hyperscale AI infrastructure investment.
Growth Opportunities
Our findings suggest that three forward-looking whitespace opportunities offer differentiated entry points for suppliers across the value chain.
Can Linear-Drive Optics Unlock Power-Constrained AI Cluster Deployments?
Linear-drive pluggable optics offer switch OEMs and hyperscale operators a path to reduce per-port power draw inside power-constrained AI training racks. Suppliers that qualify linear-drive platforms early stand to capture share among hyperscale cloud and AI customers prioritizing rack-level power efficiency.
Can Co-Packaged Optics Create New Revenue Streams for Photonic Engine Suppliers?
Co-packaged optics integration into next-generation switch silicon opens a whitespace for photonic engine suppliers to embed directly within sovereign AI infrastructure and hyperscale switch platforms, benefiting networking OEMs seeking tighter electrical-optical integration.
Can Regional Manufacturing Diversification Reduce Supply Chain Concentration Risk?
Expansion of assembly and test capacity outside traditional manufacturing hubs offers contract manufacturers and OEM captive suppliers an opportunity to serve customers seeking geographic supply chain diversification amid export control uncertainty.
Regional Outlook
|
Region |
2025 (USD) |
2035 (USD) |
CAGR% (2026–2035) |
Key Driver |
|
North America |
USD 1.75 Billion |
USD 14.12 Billion |
26.1% |
Hyperscale AI cluster capacity expansion |
|
Asia-Pacific |
USD 1.65 Billion |
USD 16.26 Billion |
29.0% |
Manufacturing scale and cloud buildout |
|
Europe |
USD 0.82 Billion |
USD 6.42 Billion |
25.6% |
Telecom transport modernization |
|
Middle East & Africa |
USD 0.34 Billion |
USD 3.43 Billion |
29.3% |
Sovereign AI infrastructure investment |
|
Latin America |
USD 0.29 Billion |
USD 2.57 Billion |
27.4% |
Data center capacity growth |
|
Total |
USD 4.85 Billion |
USD 42.80 Billion |
24.1% |
|
North America 800G Optical Transceiver Market Outlook
North America leads the market on the strength of concentrated hyperscale AI capital expenditure and mature data center networking ecosystems. The region benefits from early qualification cycles among leading cloud operators, favorable regulatory treatment of data center infrastructure investment, and rapid adoption of silicon photonics platforms. Strategic outlook remains anchored to continued GPU cluster capacity expansion through 2035.
Europe 800G Optical Transceiver Market Outlook
Europe's market is shaped by telecom carrier transport modernization and REACH-aligned component sourcing requirements. Regulatory emphasis on energy efficiency is accelerating interest in lower-power linear-drive modules. Technology adoption trends favor coherent upgrades for metro and long-haul networks, with a strategic outlook centered on balancing sovereign digital infrastructure goals against import dependency on Asia-Pacific manufacturing.
Asia-Pacific 800G Optical Transceiver Market Outlook
Asia-Pacific combines the region's largest manufacturing base with rapidly scaling domestic cloud and data center colocation capacity, driving the fastest regional CAGR. Regulatory dynamics around semiconductor export controls influence technology sourcing strategies. Competitive intensity is high given the concentration of module manufacturers headquartered in the region, with a strategic outlook favoring continued vertical integration.
Middle East & Africa 800G Optical Transceiver Market Outlook
Middle East & Africa is an emerging market anchored by sovereign AI infrastructure programs in the Gulf states. Regulatory environments are increasingly supportive of large-scale data center licensing, while technology adoption is concentrated among newly commissioned hyperscale-grade facilities. Strategic outlook favors continued growth as national digital economy strategies mature through 2035.
Latin America 800G Optical Transceiver Market Outlook
Latin America's market reflects growing data center capacity investment concentrated in a small number of national hubs. Regulatory environments vary by country, with technology adoption trailing North America due to slower AI cluster capital deployment. Strategic outlook is positive but more gradual, supported by expanding cloud region announcements from global hyperscale operators.
U.S. 800G Optical Transceiver Market
Based on our estimates, the market in the U.S. was valued at approximately USD 1.30 billion in 2025 and is projected to reach approximately USD 10.30 billion by 2035, registering a CAGR of approximately 25.8%. Demand structure is concentrated among hyperscale cloud operators, with high adoption of silicon photonics and OSFP form factors. Regulatory influence stems from export control policy, while competitive intensity remains high given the presence of leading networking OEMs and a strategic outlook favoring continued AI cluster investment.
Canada 800G Optical Transceiver Market
The market in Canada was valued at approximately USD 0.28 billion in 2025 and is projected to reach approximately USD 2.35 billion by 2035, registering a CAGR of approximately 26.7%. Demand structure reflects growing regional data center capacity, moderate technology penetration relative to the U.S., and competitive intensity shaped by proximity to major North American hyperscale operators, with a strategic outlook tied to renewable-powered data center siting.
UK 800G Optical Transceiver Market
As per our estimate, the market in the UK was valued at approximately USD 0.19 billion in 2025 and is projected to reach approximately USD 1.55 billion by 2035, registering a CAGR of approximately 26.1%. Demand structure centers on financial services and cloud data centers, with regulatory influence from UK data protection and energy efficiency rules shaping technology adoption toward lower-power modules and a strategic outlook favoring gradual coherent network upgrades.
Germany 800G Optical Transceiver Market
According to our analysis, the market in Germany was valued at approximately USD 0.17 billion in 2025 and is projected to reach approximately USD 1.35 billion by 2035, registering a CAGR of approximately 25.8%. Demand structure reflects strong industrial and telecom carrier adoption, regulatory influence from EU packaging and energy directives, and a strategic outlook favoring investment in sovereign digital infrastructure capacity.France 800G Optical Transceiver Market
Based on our estimates, the market in France was valued at approximately USD 0.12 billion in 2025 and is projected to reach approximately USD 0.95 billion by 2035, registering a CAGR of approximately 25.7%. Demand structure is led by telecom transport operators, with moderate technology penetration and competitive intensity shaped by national data sovereignty priorities, supporting a strategic outlook centered on public sector cloud investment.
China 800G Optical Transceiver Market
The market in China was valued at approximately USD 0.58 billion in 2025 and is projected to reach approximately USD 6.10 billion by 2035, registering a CAGR of approximately 29.7%. Demand structure is anchored by domestic hyperscale cloud operators and module manufacturers, with regulatory influence from export control policy shaping technology sourcing and a strategic outlook favoring continued vertical integration of the optical component supply chain.
India 800G Optical Transceiver Market
As per our estimate, the market in India was valued at approximately USD 0.14 billion in 2025 and is projected to reach approximately USD 1.85 billion by 2035, registering a CAGR of approximately 31.5%, the fastest among covered countries. Demand structure reflects rapidly expanding hyperscale cloud region capacity, rising technology penetration, and a strategic outlook supported by government digital infrastructure incentives.
Japan 800G Optical Transceiver Market
According to our analysis, the market in Japan was valued at approximately USD 0.25 billion in 2025 and is projected to reach approximately USD 2.20 billion by 2035, registering a CAGR of approximately 27.9%. Demand structure is led by telecom carriers and domestic cloud operators, with regulatory influence from national digital infrastructure policy and a strategic outlook favoring coherent transport upgrades.
South Korea 800G Optical Transceiver Market
Based on our estimates, the market in South Korea was valued at approximately USD 0.22 billion in 2025 and is projected to reach approximately USD 2.05 billion by 2035, registering a CAGR of approximately 28.4%. Demand structure benefits from strong domestic semiconductor manufacturing capability, high technology penetration, and a strategic outlook favoring continued investment in AI infrastructure by leading domestic technology conglomerates.
Australia 800G Optical Transceiver Market
The market in Australia was valued at approximately USD 0.07 billion in 2025 and is projected to reach approximately USD 0.62 billion by 2035, registering a CAGR of approximately 27.7%. Demand structure reflects growing hyperscale cloud region investment, moderate technology penetration, and a strategic outlook supported by renewable energy-linked data center development.
UAE 800G Optical Transceiver Market
As per our estimate, the market in the UAE was valued at approximately USD 0.09 billion in 2025 and is projected to reach approximately USD 1.00 billion by 2035, registering a CAGR of approximately 30.9%. Demand structure is driven by sovereign AI infrastructure programs, with regulatory influence from national data center licensing frameworks and a strategic outlook favoring continued large-scale hyperscale facility commissioning.
Saudi Arabia 800G Optical Transceiver Market
According to our analysis, the market in Saudi Arabia was valued at approximately USD 0.07 billion in 2025 and is projected to reach approximately USD 0.78 billion by 2035, registering a CAGR of approximately 30.9%. Demand structure reflects national digital economy diversification programs, rising technology penetration, and a strategic outlook supported by government-backed AI infrastructure investment.
South Africa 800G Optical Transceiver Market
Based on our estimates, the market in South Africa was valued at approximately USD 0.03 billion in 2025 and is projected to reach approximately USD 0.25 billion by 2035, registering a CAGR of approximately 26.9%. Demand structure is emerging, with regulatory influence from national telecommunications policy and a strategic outlook tied to regional data center hub development.
Brazil 800G Optical Transceiver Market
The market in Brazil was valued at approximately USD 0.13 billion in 2025 and is projected to reach approximately USD 1.15 billion by 2035, registering a CAGR of approximately 27.4%. Demand structure reflects the largest regional data center hub in Latin America, with regulatory influence from national data protection law and a strategic outlook favoring continued hyperscale cloud region expansion.
Argentina 800G Optical Transceiver Market
As per our estimate, the market in Argentina was valued at approximately USD 0.04 billion in 2025 and is projected to reach approximately USD 0.34 billion by 2035, registering a CAGR of approximately 26.9%. Demand structure remains nascent relative to Brazil, with regulatory influence from national digital infrastructure policy and a strategic outlook supported by gradual cloud capacity investment.
Supply Chain Structure of the 800G Optical Transceiver Market
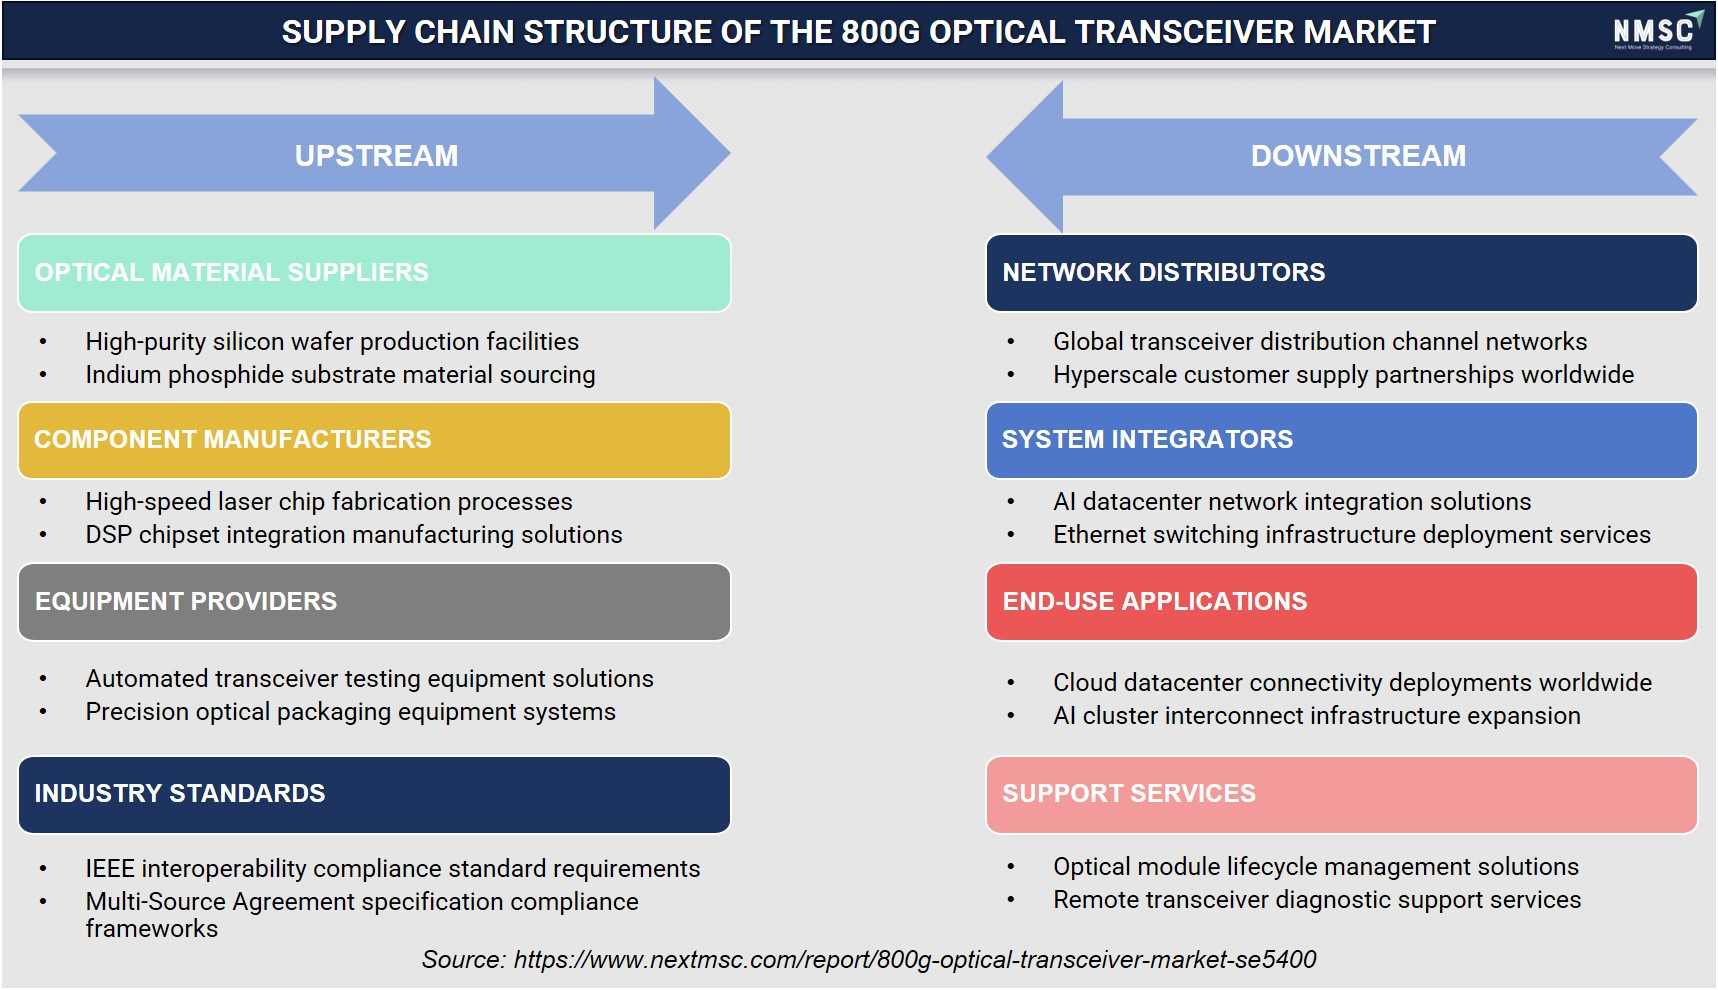
Our findings suggest that the 800G Optical Transceiver Market maintains a highly specialized supply chain, beginning with optical material suppliers, component manufacturers, equipment providers, and industry standards that support precision manufacturing and product quality. Downstream activities include network distributors, system integrators, end-use applications, and support service providers that enable efficient deployment, lifecycle management, and technical assistance. Strong coordination across the supply chain ensures reliable product availability, interoperability, and scalable network expansion for AI-driven and hyperscale data center environments.
Competitive Landscape
We observed that the competitive landscape is moderately consolidated, with a small group of module manufacturers and networking OEMs accounting for the majority of AI cluster and hyperscale transceiver deployments.
|
Category |
Assessment |
|
Market Structure |
Moderately consolidated, with leading module manufacturers and networking OEMs holding concentrated hyperscale customer relationships. |
|
Innovation Focus |
Silicon photonics integration, linear-drive power reduction, and co-packaged optics readiness for next-generation AI fabrics. |
|
M&A Activity |
Selective capacity expansion and photonic engine acquisitions to secure vertically integrated supply chains. |
How Do Companies Compete in the 800G Optical Transceiver Market?
Companies compete primarily on power efficiency, qualification speed with hyperscale customers, and manufacturing scale across direct detect and coherent product lines. We found that suppliers with vertically integrated semiconductor and photonic component capability secure faster design-in cycles with leading cloud operators, while smaller specialists compete on niche performance attributes such as reach or thermal tolerance.
Which Competitive Archetypes Dominate the 800G Optical Transceiver Market?
Two archetypes dominate: diversified optical component manufacturers with in-house laser and photonic integrated circuit fabrication, and networking equipment vendors that source modules but control switch platform integration. Vertical integration and hyperscale account penetration explain the dominance of leading Chinese and U.S. module suppliers within this structure.
What Innovation and Differentiation Strategies Are Companies Pursuing?
Companies are differentiating through silicon photonics platform investment, linear-drive product introductions, and thermal management innovations that support higher port density. Leading suppliers are also expanding thin-film lithium niobate capacity to support coherent module performance requirements for metro and long-haul transport upgrades.
How Active Is M&A and Geographic Expansion in the Market?
M&A activity remains selective, concentrated on securing photonic component supply and expanding assembly capacity outside traditional manufacturing hubs. Geographic expansion strategies favor Southeast Asia and North America as suppliers respond to customer requests for supply chain diversification amid evolving export control conditions.
Key Market Players
We observed that the following 20 companies represent the leading manufacturers and suppliers shaping the competitive structure of the 800G optical transceiver market.
-
InnoLight Technology Co., Ltd.
-
Coherent Corp.
-
Eoptolink Technology Inc., Ltd.
-
Lumentum Holdings Inc.
-
Accelink Technologies Co., Ltd.
-
Source Photonics, Inc.
-
Applied Optoelectronics, Inc.
-
Nokia Corporation
-
Ciena Corporation
-
Arista Networks, Inc.
-
Hengtong Rockley Technology Co., Ltd.
-
Fujitsu Limited
-
ZTE Corporation
-
NEC Corporation
-
ColorChip Ltd.
-
O-Net Technologies (Shenzhen) Group Co., Ltd.
-
Linktel Technologies Co., Ltd.
-
LIGENT Inc
Latest Developments
We observed that the following developments reflect recent strategic and product activity among leading suppliers in the market.
|
Date |
Event |
|
March 2026 |
Lumentum entered into a multi-year strategic agreement with NVIDIA to accelerate the development of advanced optical technologies and high-speed transceiver components for next-generation AI infrastructure, backed by a multi-billion-dollar purchase commitment and expanded U.S. manufacturing capacity |
|
March 2026 |
Cisco Systems expanded its high-density optical portfolio ahead of OFC 2026, upgrading its NCS 1014 multihaul system with a high-capacity 800G pluggable transponder line card leveraging its acquired Acacia silicon photonics technology, delivering a 38% reduction in power consumption for AI-scale data center interconnects |
|
March 2026 |
Applied Optoelectronics (AOI) secured a major volume order exceeding USD 53 million from a primary hyperscale cloud customer for 800G single-mode data center transceivers, with commercial shipments scaling rapidly to support dense AI GPU cluster builds |
Expert Insights
 "The demand for greater bandwidth and longer distances continues to grow rapidly across all parts of the network, from data center interconnect to submarine cables."
— Wupen Yuen, President of Cloud and Networking, Lumentum
Statement made during the announcement of the industry's first interoperable 800G ZR/ZR+ pluggable optical modules, emphasizing the rapidly increasing demand for high-bandwidth optical connectivity across data center interconnect (DCI) and long-haul network infrastructure.
Market Interpretation
The statement highlights the accelerating need for high-speed optical networking solutions as hyperscale data centers, AI workloads, cloud computing, and high-capacity telecommunications networks continue to expand. Increasing bandwidth requirements and longer transmission distances are driving the adoption of 800G optical transceivers, which enable faster data transfer, improved network efficiency, and lower power consumption. Furthermore, continuous investments in next-generation optical infrastructure and interoperable pluggable modules are expected to strengthen market growth, particularly across hyperscale data centers, metro networks, and long-haul communication systems.
Investment Opportunities
Where Are Capital Inflows Concentrated in the 800G optical transceiver market?
Capital inflows are concentrated in silicon photonics fabrication capacity, thin-film lithium niobate production, and FPGA-enabled test and validation infrastructure supporting AI cluster module qualification. We observed that leading suppliers are prioritizing capital deployment toward vertically integrated photonic component manufacturing to secure supply against rising hyperscale demand.
How Significant Is Infrastructure Investment in 800G optical transceiver market?
Infrastructure investment is significant, with hyperscale operators committing substantial capital toward AI data center campuses that directly drive optical port demand. Our assessment indicates that module manufacturers are correspondingly expanding assembly and test capacity to match projected hyperscale capital expenditure cycles through 2035.
What ESG Considerations Are Shaping Investment Decisions?
Environmental, social, and governance considerations increasingly influence investment decisions, with power efficiency per transmitted bit emerging as a primary sustainability metric for data center operators. We found that renewable-powered data center siting and lower-power linear-drive module adoption are becoming standard criteria in hyperscale procurement and investment decisions.
Key Benefits for Stakeholders
How Does This Report Benefit Industry Leaders?
Industry leaders gain access to detailed segmentation, competitive benchmarking, and technology adoption analysis that supports product roadmap and capacity planning decisions. Our analysis of open networking and switch platform trends helps networking OEMs and module manufacturers align R&D investment with hyperscale customer requirements through 2035.
How Does This Report Benefit Investors and Financial Analysts?
Investors and financial analysts gain quantified market sizing, CAGR benchmarks, and regional growth differentials that support valuation and capital allocation decisions across the optical component supply chain. The report's forecasts and competitive landscape data support diligence on manufacturers positioned to capture AI infrastructure investment cycles.
How Does This Report Benefit Technology Vendors and Product Teams?
Technology vendors and product teams gain granular segmentation across optical engine, form factor, and signal processing categories that inform product portfolio prioritization. Strategic insights on emerging trends such as linear-drive and co-packaged optics support roadmap decisions aligned with evolving hyperscale customer specifications.
Key Market Segments
By Transmission Type
-
Direct Detect
-
Short Reach
-
Mid Reach
-
Long Reach
-
Other Direct Detect
-
-
Coherent
-
ZR
-
ZR Plus
-
DCO
-
Other Coherent
-
By Form Factor
-
OSFP
-
QSFP-DD
-
CFP2
-
Other Form Factors
By Optical Engine
-
VCSEL Based
-
EML Based
-
Silicon Photonics
-
TFLN Based
-
Other Optical Engine
By Signal Processing
-
DSP Based
-
Linear Drive
-
Other Signal Processing
By Application
-
AI and HPC Cluster Interconnect
-
Hyperscale Data Centre Internal Network
-
Data Centre Interconnect
-
Telecom Transport and Backhaul
-
Enterprise Data Centre and Campus
-
Other Application
By Sales Channel
-
Direct Key Account
-
OEM Captive
-
Distributor and Reseller
-
Contract Manufacturing
-
Other Sales Channel
By Customer Type
-
Hyperscale Cloud and AI
-
Telecom Carrier
-
Networking OEM
-
Enterprise
-
White Label Provider
-
Other Customer Type
By Region
-
North America: U.S., Canada, Mexico
-
Europe: UK, Germany, France, Italy, Spain, Sweden, Denmark, Finland, Netherlands, Rest of Europe
-
Asia-Pacific: China, India, Japan, South Korea, Taiwan, Indonesia, Vietnam, Australia, Philippines, Malaysia, Rest of APAC
-
Middle East & Africa: Saudi Arabia, UAE, Egypt, Israel, Turkey, Nigeria, South Africa, Rest of MEA
-
Latin America: Brazil, Argentina, Chile, Colombia, Rest of LATAM
Conclusion and Recommendations
What Is the Long-Term Outlook for the 800G Optical Transceiver Market?
The long-term outlook remains strongly positive, with the market projected to grow from USD 4.85 billion in 2025 to USD 42.80 billion by 2035 at a 24.1% CAGR. Sustained AI cluster capacity expansion and progressive migration toward 1.6T architectures are expected to anchor demand well beyond the current forecast window.
What Strategic Positioning Should Suppliers Pursue?
Suppliers should prioritize vertically integrated silicon photonics and advanced chip packaging capability to secure hyperscale design wins, while maintaining dual-sourcing relationships across geographies to mitigate export control exposure and supply chain concentration risk.
How Attractive Is the Market for Investment?
The market presents high investment attractiveness given its structural link to AI infrastructure capital expenditure cycles. Our analysis shows that suppliers with differentiated power-efficiency roadmaps and established hyperscale relationships offer the most favorable risk-adjusted return profile through 2035.
What Are the Key Market Shifts and Risks to Monitor?
Key shifts include the transition toward linear-drive and co-packaged optics, alongside risks from export control tightening and resin and component feedstock volatility. Stakeholders should monitor 1.6T qualification timelines as a leading indicator of demand reallocation away from current 800G platforms.
What Are the Primary Growth Pathways Through 2035?
Primary growth pathways include continued AI cluster interconnect expansion, hyperscale data center internal network upgrades, and gradual telecom transport modernization. Suppliers that align technology roadmaps with successive GPU generation cycles are best positioned to capture sustained growth across the forecast period.
About the Author
 Saista Faiyaz
— Saista Faiyaz is Research Associate at Next Move Strategy Consulting, where she has covered consumer markets and healthcare technologies for 3 years. Her work includes primary interview review, secondary-source validation, market sizing, and structured analysis of company and industry data. She supports research by comparing evidence across sources, organizing findings into market narratives, and documenting assumptions used in analysis. Her scope includes cross-market benchmarking, and reports.
Saista Faiyaz
— Saista Faiyaz is Research Associate at Next Move Strategy Consulting, where she has covered consumer markets and healthcare technologies for 3 years. Her work includes primary interview review, secondary-source validation, market sizing, and structured analysis of company and industry data. She supports research by comparing evidence across sources, organizing findings into market narratives, and documenting assumptions used in analysis. Her scope includes cross-market benchmarking, and reports.
About the Reviewer
 Supradip Baul
— Supradip Baul is an accomplished business consultant and strategist with over a decade of rich experience in market intelligence, strategy, technology, and business transformation. His work has included rigorous qualitative and quantitative analysis across multiple industries, helping clients shape investment decisions and long-term roadmaps. Earlier in his career, he was associated with Gartner, where he contributed to industry-leading reports and market share analyses. He has worked with leading global companies and holds an MBA with a dual specialization in Marketing and Finance.
Supradip Baul
— Supradip Baul is an accomplished business consultant and strategist with over a decade of rich experience in market intelligence, strategy, technology, and business transformation. His work has included rigorous qualitative and quantitative analysis across multiple industries, helping clients shape investment decisions and long-term roadmaps. Earlier in his career, he was associated with Gartner, where he contributed to industry-leading reports and market share analyses. He has worked with leading global companies and holds an MBA with a dual specialization in Marketing and Finance.
At Next Move Strategy Consulting, we understand that insightful market research is the cornerstone of successful business decisions. That's why we employ a robust and multifaceted approach, combining various methodologies to deliver the most accurate and actionable data for our clients.

Research Landscape
We navigate the world of research with two primary approaches:
Qualitative Approach
Our qualitative research methodologies involve immersive techniques such as in-depth interviews, focus groups, and observational studies. By engaging directly with individuals and stakeholders, we uncover valuable insights that quantitative data alone may overlook.

Quantitative Research
In tandem with qualitative methodologies, NMSC leverages the power of Quantitative Research to provide a robust foundation of numerical insights. Through systematic data collection and analysis, we quantify patterns, preferences, and market trends, offering a comprehensive view of the business landscape.
Our quantitative research approach employs diverse tools, including surveys, experiments, and statistical modelling. These methodologies enable us to gather data from a large and representative sample, ensuring the statistical significance of our findings. By employing structured questionnaires and standardized data collection methods, we guarantee the reliability and validity of the information we present to our clients.
Quantitative research is particularly effective in measuring the prevalence of trends, assessing market size, and gauging the impact of various factors on consumer behavior. The numerical precision attained through this approach equips our clients with actionable insights, facilitating data-driven decision-making and strategy formulation.


Our Specialized Toolbox for Industry-Specific Market Research
We deploy a specialized arsenal of techniques tailored to meet your unique requirements. Here's a glimpse into our comprehensive toolbox:

Information Procurement
The stage entails acquiring market data or relevant information through various sources and methodologies.


Market Research Approach
We utilize both top-down and bottom-up approaches in market research analysis to achieve a comprehensive understanding of the market dynamics, leveraging the broad perspective of industry trends and macroeconomic factors alongside detailed insights from specific segments and individual companies.

Porters Five Forces Analysis
We conduct Porter's Five Forces analysis to evaluate the competitive landscape of an industry, providing us with insights into factors that affect profitability and strategic positioning.

SWOT Analysis

Forecasting
We utilize a forecasting model to predict future consumption by considering parameters like population, economics, regulations, market competition, drivers, constraints, technology, and pricing. We also employ statistical techniques such as multilinear regression, exponential smoothing, moving average, ARIMA, and Monte Carlo simulations for accurate predictions. In econometric forecasting, we analyzed short-term and long-term event impacts, attributing values based on regulatory frameworks, economic factors, and market events.





 Speak to Our Analyst