Smart Kitchen Appliances Market Global Industry Analysis and Forecast (2026–2035)

The global Smart Kitchen Appliances Market is valued at USD 39.91 Billion in 2026 and is projected to reach USD 146.35 Billion by 2035, growing at a CAGR of 15.53% from 2026 to 2035. Key growth factors include expanding household connectivity and energy efficiency, with North America leading at approximately 34% share and smart refrigeration appliances holding approximately 34% share.

Download Free Sample PDF
Base Year (2025)
$28.08 Billion
Forecast (2035)
$146.35 Billion
CAGR (2026-2035)
15.5%
Top Region
North America

What Is the Smart Kitchen Appliances Market Size?

The global smart kitchen appliances market size was valued at USD 28.08 billion in 2025 and is estimated at USD 39.91 billion in 2026, forecast to reach USD 146.35 billion by 2035, expanding at a 15.53% CAGR between 2026 and 2035. North America leads with approximately 34% share, while smart refrigeration appliances dominate product types with approximately 34% share.

We observed that growth is broad-based across every segmentation axis, with AI enabled appliances, voice activated systems, and commercial deployments driving the dominant structural shifts through 2035.

Smart Kitchen Appliances Market Global Industry Analysis and Forecast (2026–2035) Revenue Forecast

Values in USD Billion

2025 $28.08 Billion
2025
2026 $39.91 Billion
2026
2027 $46.11 Billion
2027
2028 $53.27 Billion
2028
2029 $61.54 Billion
2029
2030 $71.10 Billion
2030
2031 $82.14 Billion
2031
2032 $94.90 Billion
2032
2033 $109.63 Billion
2033
2034 $126.66 Billion
2034
2035 $146.35 Billion
2035

Key Takeaways

By Product Type: Smart Refrigeration Appliances held the largest share of approximately 34% (USD 9.55 billion) in 2025 and are projected to reach USD 45.37 billion in 2035; Smart Food Preparation Appliances are the fastest-growing sub-segment at 17.96% CAGR from 2026–2035.

By Application: Residential held the largest share of approximately 78% (USD 21.90 billion) in 2025 and is projected to reach USD 105.37 billion in 2035; Commercial is the fastest-growing sub-segment at 18.32% CAGR from 2026–2035.

By Primary Connectivity: Wi-Fi held the largest share of approximately 46% (USD 12.92 billion) in 2025 and is projected to reach USD 52.69 billion in 2035; Voice-Activated Systems are the fastest-growing sub-segment at 19.54% CAGR from 2026–2035.

By Primary Technology: Sensor and Touch Controls held the largest share of approximately 30% (USD 8.42 billion) in 2025 and is projected to reach USD 32.20 billion in 2035; AI Enabled Appliances are the fastest-growing sub-segment at 21.57% CAGR from 2026–2035.

By Distribution Channel: Offline held the largest share of approximately 62% (USD 17.41 billion) in 2025 and is projected to reach USD 74.64 billion in 2035; Online is the fastest-growing sub-segment at 18.47% CAGR from 2026–2035.

Dominant Region: North America dominated with approximately 34% revenue share (USD 9.55 billion) in 2025.

Fastest-Growing Region: Asia-Pacific is expected to register the highest CAGR of 19.16% during 2026–2035.

Dominant Country: U.S. led with approximately USD 7.64 billion in 2025.

Fastest-Growing Country: India is the fastest-growing country at approximately 23.16% CAGR from 2026–2035.

Market Opportunity: The smart kitchen appliances market is expected to create an absolute dollar opportunity of USD 106.44 billion between 2026 and 2035, presenting significant investment potential across connected refrigeration, AI enabled cooking, and appliance software services.

According to Next Move Strategy Consulting analysis, appliance makers are shifting competitive emphasis from individual product features to hub level ecosystems, where a shared AI layer and common interoperability standards determine which brands retain households across refrigeration, cooking, and cleaning categories through 2035.

What Does the Smart Kitchen Appliances Market Encompass?

The smart kitchen appliances market encompasses connected, sensor equipped appliances that combine automation, remote control, and intelligent functions across refrigeration, cooking, dishwashing, beverage preparation, food preparation, and kitchen ventilation. Our assessment indicates that the scope spans residential households and commercial operators in hospitality, foodservice, healthcare, education, corporate, and government settings. The category has evolved from premium showcase products into mainstream smart appliances that operate as nodes inside broader connected homes, supported by app control, cloud services, and recurring software updates.
Regulatory frameworks such as the European Union's ecodesign requirements for domestic ovens, hobs, and range hoods, together with energy-labelling requirements for ovens and range hoods, together with the U.S. ENERGY STAR program, shape efficiency specifications, while the EU Cyber Resilience Act introduces security obligations for connected products. We observed that technology adoption is shifting toward camera based food recognition, voice interfaces, and interoperable connectivity standards. Next Move Strategy Consulting's analysis indicates that this combination is redefining product architecture and service models across the smart kitchen appliances market.

Market Drivers & Dynamics

Interactive Dataset
Expanding household connectivity and smart home ecosystems driver +3.6% Global 2026–2035
Energy efficiency standards and electrification replacement demand driver +2.9% Europe, North America, Asia-Pacific 2026–2035
Urbanisation, income growth, and time saving needs driver +2.7% Asia-Pacific, Middle East & Africa, Latin America 2026–2035
AI enabled cooking, food recognition, and personalisation driver +2.4% Global 2026–2033
Post purchase data and subscription services driver +1.6% North America, Europe 2027–2035
Open interoperability standards such as Matter driver +1.2% Global 2026–2032
High purchase premiums and uneven household budgets restraint −2.3% Global 2026–2035
Cybersecurity and data governance compliance costs restraint −1.4% Europe, North America 2026–2030
Long appliance replacement cycles restraint −1.0% Europe, North America, Japan 2026–2035
Residual ecosystem fragmentation and legacy devices restraint −0.9% Global 2026–2030
Source: Next Move Strategy Consulting

Growth Drivers

What Is the Primary Growth Driver of the Smart Kitchen Appliances Market?

Expanding household connectivity is the primary driver of the smart kitchen appliances market. The International Telecommunication Union reports that 6.0 billion people, or 74% of the world's population, used the Internet in 2025, and Eurostat shows that 14% of EU Internet users used smart home appliances in 2024. We observed that this base lowers the friction of app control, updates, and remote monitoring, allowing smart home ecosystems to pull kitchen appliances into daily use.

How Is Energy Efficiency Driving Smart Kitchen Appliances Market Growth?

Efficiency rules and electricity costs are accelerating replacement demand for intelligent equipment in the smart kitchen appliances market. The International Energy Agency attributes nearly 45% of the increase in global electricity demand in 2025 to buildings, and the U.S. Energy Information Administration reports an average residential price of 0.165 USD per kWh in 2024. Our assessment indicates that buyers increasingly justify upgrades through lifetime operating cost, favoring products that pair efficient hardware with visible energy data.

Growth Inhibitors

What Is Restraining Smart Kitchen Appliances Market Expansion?

Affordability remains the main restraint in the smart kitchen appliances market because connected models carry a price premium over conventional alternatives. The Organisation for Economic Co-operation and Development reports that real household income per capita in the OECD area rose only 0.7% in the fourth quarter of 2025, while Eurostat shows 2025 price levels across EU countries ranging from 63% to 140% of the EU average. We found that consumers defer upgrades when connected features seem optional.

What Are the Growth Opportunities?

How Can Connected Appliance Data Create Recurring Value Pools?

Connected refrigerators and ovens generate usage and fault data that supports diagnostics, feature updates, and maintenance alerts. The United Nations Conference on Trade and Development reports that digitally deliverable services were 56% of worldwide services exports in 2025, confirming demand for software led models. Brands that bundle service plans and predictive maintenance with hardware lift lifetime value, benefiting Smart Refrigeration and Smart Cooking segments first within the smart kitchen appliances market.

Can Food Waste Reduction Open New Smart Refrigeration Applications?

The United Nations Environment Programme estimated 1.05 billion tonnes of food waste in 2022, with households generating about 60% of the total. Inventory tracking, expiry alerts, and camera based food recognition inside connected refrigerators address this loss directly. Residential buyers gain measurable grocery savings, and manufacturers gain a differentiated feature tied to sustainability goals, strengthening the premium refrigerator category.

Will Commercial Kitchens Become the Next Growth Frontier?

Hospitality, foodservice, and healthcare operators face labor constraints and food safety obligations that connected appliances can ease. Remote monitoring, recipe standardization, and energy reporting allow multi site operators to manage fleets centrally. Suppliers offering service contracts and software dashboards capture recurring revenue, making Commercial applications, growing at 18.32% CAGR from 2026 to 2035, the fastest-expanding beneficiary segment.

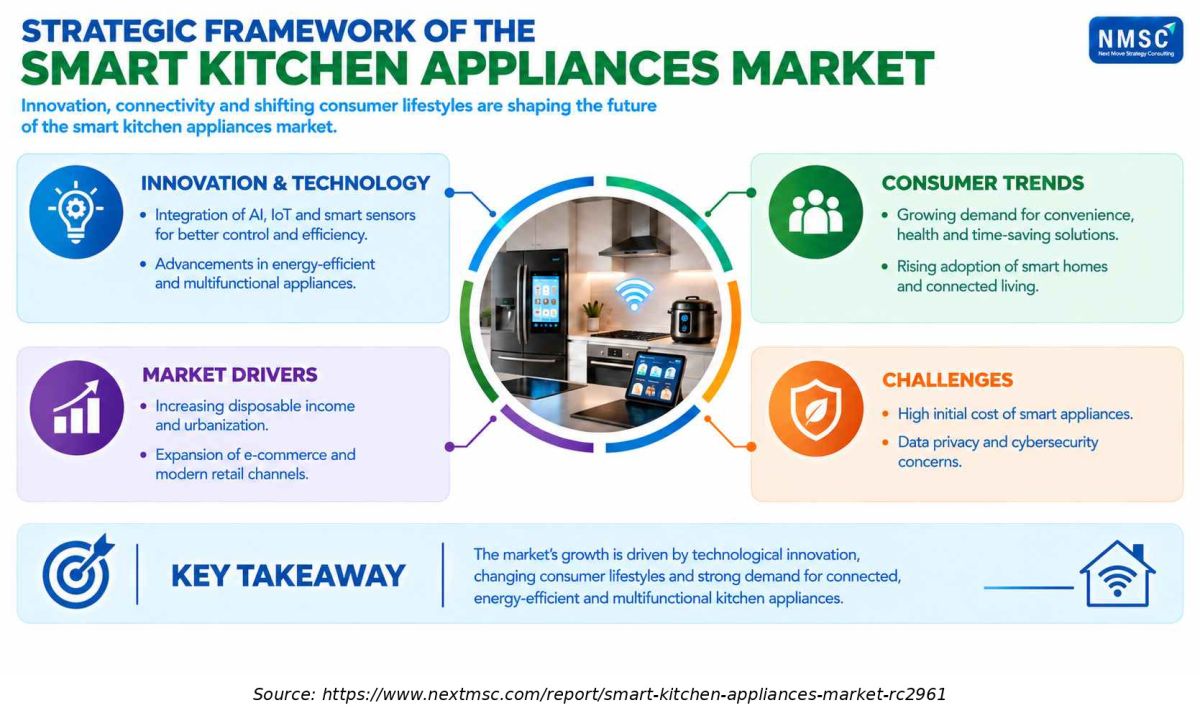
Strategic Framework of the Smart Kitchen Appliances Market

Strategic Framework of the Smart Kitchen Appliances Market
The strategic framework of the smart kitchen appliances market highlights how technological innovation, consumer preferences, market expansion, and evolving lifestyles are shaping industry development. AI, IoT, smart sensors, energy efficiency, and multifunctionality are supporting product advancement, while growing demand for convenience and connected homes creates opportunities. High upfront costs and data privacy concerns remain key considerations.

Segmentation Analysis

2025 (USD Billion)
2035 (USD Billion)
Smart Refrigeration Appliances 2025: $9.55 Billion | 2035: $45.37 Billion
Smart Refrig
Smart Cooking Appliances 2025: $6.74 Billion | 2035: $36.59 Billion
Smart Cookin
Smart Dishwashing Appliances 2025: $2.81 Billion | 2035: $13.17 Billion
Smart Dishwa
Smart Beverage Appliances 2025: $2.25 Billion | 2035: $11.71 Billion
Smart Bevera
Smart Food Preparation Appliances 2025: $4.77 Billion | 2035: $30.73 Billion
Smart Food P
Smart Kitchen Ventilation Appliances 2025: $1.96 Billion | 2035: $8.78 Billion
Smart Kitche
Smart Refrigeration Appliances $9.55 Billion $45.37 Billion 14.46%
Smart Cooking Appliances $6.74 Billion $36.59 Billion 16.00%
Smart Dishwashing Appliances $2.81 Billion $13.17 Billion 14.32%
Smart Beverage Appliances $2.25 Billion $11.71 Billion 15.55%
Smart Food Preparation Appliances $4.77 Billion $30.73 Billion 17.96%
Smart Kitchen Ventilation Appliances $1.96 Billion $8.78 Billion 13.77%

Which Product Type Segment Dominates the Smart Kitchen Appliances Market?

Smart Refrigeration Appliances, encompassing refrigerators, freezers, wine and beverage refrigerators, and other refrigeration units, led the smart kitchen appliances market with USD 9.55 billion in 2025, supported by continuous operation, camera based food management, and high replacement values. We observed that Smart Food Preparation Appliances are the fastest-growing product type, expanding at a 17.96% CAGR from 2026 to 2035, as connected air fryers, electric cookers, and food preparation machines add guided recipes at lower entry prices.

2025 (USD Billion)
2035 (USD Billion)
Category A
Category B
Category C
Category D
Segment Item 2025 (USD Billion) 2035 (USD Billion) CAGR
Category A $10.0 USD Billion $40.0 USD Billion 18.0%
Category B $17.1 USD Billion $51.1 USD Billion 16.0%
Category C $24.2 USD Billion $62.2 USD Billion 22.0%
Category D $31.3 USD Billion $73.3 USD Billion 12.0%

Segment-wise data is locked

Unlock complete segment-wise numbers for Application.

Unlock Full Data
2025 (USD Billion)
2035 (USD Billion)
Category A
Category B
Category C
Category D
Segment Item 2025 (USD Billion) 2035 (USD Billion) CAGR
Category A $10.0 USD Billion $40.0 USD Billion 17.0%
Category B $17.1 USD Billion $51.1 USD Billion 15.0%
Category C $24.2 USD Billion $62.2 USD Billion 13.0%
Category D $31.3 USD Billion $73.3 USD Billion 15.0%

Segment-wise data is locked

Unlock complete segment-wise numbers for Primary Connectivity.

Unlock Full Data
2025 (USD Billion)
2035 (USD Billion)
Category A
Category B
Category C
Category D
Segment Item 2025 (USD Billion) 2035 (USD Billion) CAGR
Category A $10.0 USD Billion $40.0 USD Billion 13.0%
Category B $17.1 USD Billion $51.1 USD Billion 19.0%
Category C $24.2 USD Billion $62.2 USD Billion 9.0%
Category D $31.3 USD Billion $73.3 USD Billion 27.0%

Segment-wise data is locked

Unlock complete segment-wise numbers for Primary Technology.

Unlock Full Data
2025 (USD Billion)
2035 (USD Billion)
Category A
Category B
Category C
Category D
Segment Item 2025 (USD Billion) 2035 (USD Billion) CAGR
Category A $10.0 USD Billion $40.0 USD Billion 25.0%
Category B $17.1 USD Billion $51.1 USD Billion 19.0%
Category C $24.2 USD Billion $62.2 USD Billion 25.0%
Category D $31.3 USD Billion $73.3 USD Billion 19.0%

Segment-wise data is locked

Unlock complete segment-wise numbers for Distribution Channel.

Unlock Full Data

Growth Opportunities

We observed that three whitespace opportunities offer the clearest route to value creation as adoption widens beyond early adopters.

How Can Connected Appliance Data Create Recurring Value Pools?

Connected refrigerators and ovens generate usage and fault data that supports diagnostics, feature updates, and maintenance alerts. The United Nations Conference on Trade and Development reports that digitally deliverable services were 56% of worldwide services exports in 2025, confirming demand for software led models. Brands that bundle service plans and predictive maintenance with hardware lift lifetime value, benefiting Smart Refrigeration and Smart Cooking segments first within the smart kitchen appliances market.

Can Food Waste Reduction Open New Smart Refrigeration Applications?

The United Nations Environment Programme estimated 1.05 billion tonnes of food waste in 2022, with households generating about 60% of the total. Inventory tracking, expiry alerts, and camera based food recognition inside connected refrigerators address this loss directly. Residential buyers gain measurable grocery savings, and manufacturers gain a differentiated feature tied to sustainability goals, strengthening the premium refrigerator category.

Will Commercial Kitchens Become the Next Growth Frontier?

Hospitality, foodservice, and healthcare operators face labor constraints and food safety obligations that connected appliances can ease. Remote monitoring, recipe standardization, and energy reporting allow multi site operators to manage fleets centrally. Suppliers offering service contracts and software dashboards capture recurring revenue, making Commercial applications, growing at 18.32% CAGR from 2026 to 2035, the fastest-expanding beneficiary segment.

Regional Outlook

2025 (USD Billion)
2035 (USD Billion)
North Americ
Europe
Asia-Pacific
Middle East
Latin Americ
Region 2025 (USD Billion) 2035 (USD Billion) CAGR (%)
North America $10.0 USD Billion $40.0 USD Billion 9.0%
Europe $17.1 USD Billion $51.1 USD Billion 27.0%
Asia-Pacific $24.2 USD Billion $62.2 USD Billion 25.0%
Middle East & Africa $31.3 USD Billion $73.3 USD Billion 23.0%
Latin America $38.4 USD Billion $84.4 USD Billion 12.0%

Regional data is locked

Unlock complete regional numbers for this market.

Unlock Full Data

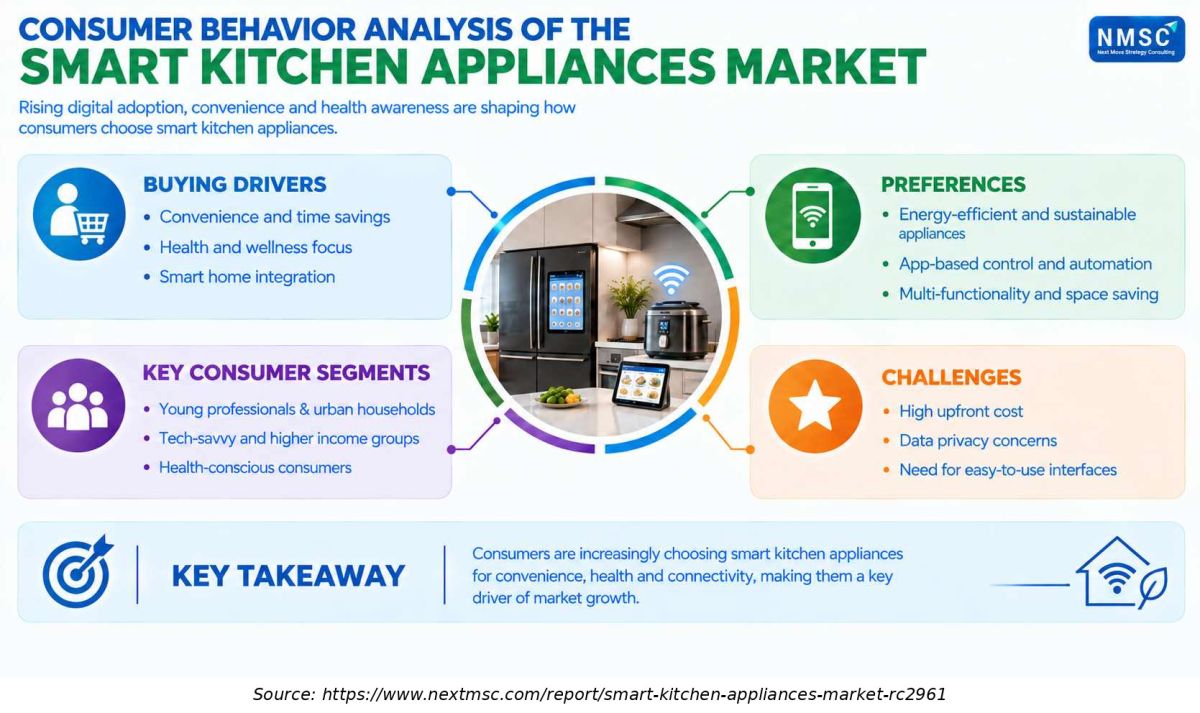
Consumer Behavior Analysis of the Smart Kitchen Appliances Market

Consumer behavior in the smart kitchen appliances market is increasingly influenced by convenience, health awareness, connectivity, and energy efficiency. Young professionals, urban households, and tech-savvy consumers demonstrate growing interest in app-enabled automation and multifunctional products. Purchase decisions also reflect ease of use, sustainability, and smart-home compatibility, while upfront costs and privacy concerns can affect adoption.

Competitive Landscape

Our findings suggest that competition in the industry is defined by ecosystem breadth, AI capability, and service depth rather than hardware specifications alone.

Dimension Description
Aspect Key Takeaways
Market Structure Moderately consolidated, with global appliance groups and regional specialists competing across multi brand portfolios.
Innovation Focus AI vision, voice interfaces, energy management, interoperability, and remote diagnostics across connected product lines.
Consolidation and Portfolio Strategy Portfolio integration and premium brand additions are favored over large transformative transactions.

How Do Companies Compete in the Smart Kitchen Appliances Market?

Competition in the smart kitchen appliances market centers on breadth of connected portfolio, platform quality, and channel reach. We observed that Samsung links Bespoke AI products through SmartThings and the Dacor premium built-in brand, while Haier Smart Home operates Haier, Casarte, Leader, GE Appliances, Candy, Fisher & Paykel, and AQUA. Pricing strategies rely on tiered feature ranges, from entry models with basic app control to premium models with cameras and AI assistants.

Which Company Archetypes Dominate the Smart Kitchen Appliances Industry?

Three archetypes dominate the smart kitchen appliances market. Global full line groups such as Samsung, LG, Haier, Midea, and Whirlpool differentiate through ecosystem scale and supply chains. Premium European specialists such as BSH, Miele, and Electrolux differentiate through engineering, durability, and design. Category specialists such as SharkNinja, De'Longhi, Breville, and Groupe SEB differentiate through focused countertop innovation. Next Move Strategy Consulting's analysis indicates that ecosystem integration, AI features, and energy performance explain most share gains.

What Innovation and Differentiation Strategies Are Shaping the Industry?

Innovation in the smart kitchen appliances market is converging on AI vision, contextual voice interaction, and efficiency. Samsung's Bespoke AI lineup uses cameras, screens, and Bixby voice recognition, and its European dishwasher adapts cycles to each load. Interoperability also matters, since Matter 1.5 from the Connectivity Standards Alliance broadens shared energy management features. During our market evaluation, we noticed that firms investing in software support and cybersecurity readiness gain an advantage as regulation tightens.

How Active Is M&A and Geographic Expansion in the Industry?

Consolidation in the smart kitchen appliances market is occurring mainly through portfolio integration. Haier Smart Home in July 2026 combined refrigeration, laundry, and kitchen appliances into one unit, and its emerging markets revenue, covering Southeast Asia, South Asia, and the Middle East and Africa, grew more than 24% in 2025. Based on research conducted by Next Move Strategy Consulting, we found that premium brand additions and regional manufacturing localization are favored over large transformative deals.

Key Market Players

Our assessment indicates that the following twenty companies shape competition through connected portfolios, ecosystem platforms, and global distribution.

Midea Group Co., Ltd. Haier Smart Home Co., Ltd. Samsung Electronics Co., Ltd. LG Electronics Inc. Whirlpool Corporation BSH Hausgeräte GmbH AB Electrolux (publ) Arçelik A.Ş. Hisense Home Appliances Group Co., Ltd. Groupe SEB S.A. Miele & Cie. KG SharkNinja, Inc. De'Longhi S.p.A. Panasonic Corporation Xiaomi Corporation Vorwerk SE & Co. KG Guangdong Galanz Enterprises Co., Ltd. Hangzhou Robam Appliances Co., Ltd. Joyoung Co., Ltd. Breville Group Limited

Latest Developments

We found that 2025–2026 activity is concentrated on AI enabled product launches, interoperability standards, and security regulation.

Date Event
September 2026 Samsung launched its 2026 Bespoke AI appliance lineup in India, including a Family Hub refrigerator with AI Vision built with Google Gemini. The refrigerator combines food recognition, recipe support, use-by-date management and SmartThings connectivity, strengthening Samsung’s connected-kitchen ecosystem and AI-enabled appliance proposition.
September 2026 Midea showcased SMART MASTER, an AI-powered home ecosystem integrating appliance-native voice interaction across refrigerators and built-in ovens. Its Health Agent can scan refrigerator ingredients, recommend recipes and coordinate cooking appliances, while Smart AI Vision monitors cooking and supports voice-based oven control.
July 2026 SharkNinja introduced the Ninja Crispi Microwave, its first countertop microwave, combining conventional microwave functions with air-frying and crisping capabilities. Built around Ninja’s glass cooking platform, the appliance targets faster preparation and multifunctionality, expanding the company’s cooking portfolio across microwave, air-fryer and countertop appliance categories.
April 2026 Miele introduced CulinaryCoach, an AI-based feature within the Miele App that helps consumers identify appropriate cooking settings and transfer programmes directly to connected ovens. Initially available in Germany and Austria from Q2 2026, the assistant extends Miele’s connected-cooking strategy through personalized, app-based appliance guidance.

Investment Opportunities

Where Is Capital Flowing in the Smart Kitchen Appliances Industry?

Capital in the smart kitchen appliances market is flowing toward AI software, connected platforms, and local manufacturing. Haier Smart Home reports continued investment in digital transformation, AI driven product innovation, and supply chain localization, while premium built-in brands and ecosystem platforms attract strategic spending from global groups. Eurostat reports that 52.7% of EU enterprises used paid cloud services in 2025, indicating established infrastructure for cloud computing based appliance services that investors can build upon.

Which Infrastructure Investments Will Support Market Expansion?

Infrastructure that enables the smart kitchen appliances market includes broadband, home networking, and cloud services. The International Telecommunication Union reports that 74% of the world's population used the Internet in 2025, and advances such as Wi-Fi 7 improve reliability for device dense homes. Investment in over the air update systems, cybersecurity tooling, and remote service networks provides a durable platform for recurring appliance services.

How Do ESG Considerations Influence Investment in the Smart Kitchen Appliances Market?

ESG factors increasingly guide capital allocation across the smart kitchen appliances market. Energy efficiency rules such as EU ecodesign requirements reward efficient appliances, and the United Nations Environment Programme links household food waste to sustainability goals that connected refrigeration can address. Governance matters as well, since the Cyber Resilience Act introduces fines up to EUR 15 million or 2.5% of worldwide turnover for certain breaches, making security practices a material investor consideration.

Key Benefits for Stakeholders

How Does This Report Benefit Enterprise and Industry Leaders?

Executives gain a segmented forecast from USD 28.08 billion in 2025 to USD 146.35 billion in 2035, with product type, application, technology, and regional detail that supports portfolio decisions. The competitive landscape, company benchmarking, and trend analysis help leaders prioritize AI enabled features, interoperability, and service models, and identify markets such as India and Asia-Pacific where growth outpaces the smart kitchen appliances market.

How Does This Report Benefit Investors and Financial Analysts?

Investors receive an absolute dollar opportunity of USD 106.44 billion between 2026 and 2035, country level CAGRs, and a risk matrix that quantifies drivers and restraints. The analysis identifies where returns are likely to concentrate, including AI enabled appliances, commercial deployments, and online channels, and highlights regulatory and affordability risks that influence valuation and timing across the forecast period for the smart kitchen appliances market.

How Does This Report Benefit Technology Vendors and Product Teams?

Vendors and product teams gain insight into connectivity, sensing, and AI technology adoption, including segment level growth for voice activated systems, Internet of Things platforms, and AI enabled appliances. The report maps interoperability standards, cybersecurity obligations, and energy efficiency requirements that shape design roadmaps, helping teams time feature launches, choose certification priorities, and align software support commitments with buyer expectations.

Key Market Segments Evaluated

By Product Type

  • Smart Refrigeration Appliances 
    • Refrigerators
    • Freezers
    • Wine and Beverage Refrigerators
    • Other Refrigeration Appliances
  • Smart Cooking Appliances 
    • Ovens
    • Ranges
      • Gas Ranges
      • Radiant Electric Ranges
      • Induction Ranges
      • Dual Fuel Ranges
      • Other Ranges
    • Cooktops and Hobs
    • Microwave Ovens
  • Smart Dishwashing Appliances 
    • Built-In and Integrated Dishwashers
    • Freestanding Dishwashers
    • Other Dishwashers
  • Smart Beverage Appliances 
    • Coffee Machines
    • Kettles
    • Other Beverage Appliances
  • Smart Food Preparation Appliances 
    • Air Fryers
    • Smart Electric Cookers
    • Food Preparation Machines
      • Blenders
      • Food Processors
      • Juicers
      • Kitchen Machines
      • Other Food Preparation Machines
    • Countertop Cooking Appliances
      • Toasters
      • Indoor Grills
      • Waffle Makers
      • Sandwich Makers
      • Other Countertop Cooking Appliances
    • Other Food Preparation Appliances
  • Smart Kitchen Ventilation Appliances 
    • Wall-Mounted Range Hoods
    • Island Range Hoods
    • Under-Cabinet and Integrated Hoods
    • Other Ventilation Systems
  • Residential
  • Commercial 
    • Hospitality
    • Foodservice
    • Healthcare and Education
    • Corporate and Industrial
    • Government
    • Other Commercial
  • Bluetooth
  • Wi-Fi
  • Near Field Communication
  • Internet of Things
  • Voice-Activated Systems
  • Other Connectivity
  • AI Enabled Appliances
  • Sensor and Touch Controls
  • Energy-Efficient Technology
  • Remote Control and Monitoring
  • Other Smart Technology
  • Online 
    • Brand Owned E-Commerce
    • E-Commerce Marketplaces
  • Offline 
    • Brand Owned Stores
    • Specialty Stores
    • Consumer Electronics Stores
    • Hypermarkets and Supermarkets
    • Distributors and Dealers
    • Other Offline Channels

By Region

  • North America 
    • U.S.
    • Canada
    • Mexico.
  • Europe 
    • UK
    • Germany
    • France
    • Italy
    • Spain
    • Sweden
    • Denmark
    • Finland
    • Netherlands
    • Rest of Europe.
  • Asia-Pacific 
    • China
    • India
    • Japan
    • South Korea
    • Taiwan
    • Indonesia
    • Vietnam
    • Australia
    • Philippines
    • Malaysia
    • Rest of APAC.
  • Middle East & Africa 
    • Saudi Arabia
    • UAE
    • Egypt
    • Israel
    • Turkey
    • Nigeria
    • South Africa
    • Rest of MEA.
  • Latin America 
    • Brazil
    • Argentina
    • Chile
    • Colombia
    • Rest of LATAM.

Conclusion & Recommendations

Long-Term Outlook

Our assessment indicates that the smart kitchen appliances market will expand from USD 39.91 billion in 2026 to USD 146.35 billion in 2035 at a 15.53% CAGR, adding USD 106.44 billion in absolute value. Growth is supported by household connectivity, efficiency regulation, and AI capability, and Asia-Pacific, at 19.16% CAGR, is forecast to become the largest region by the end of the period.

Strategic Positioning Recommendations

Manufacturers in the smart kitchen appliances market should prioritize AI enabled features that deliver measurable household value, certify to shared interoperability standards, and commit to long software support periods. Regional strategies should pair premium positioning in North America and Europe with tiered ranges in Asia-Pacific, Latin America, and Middle East & Africa. Commercial kitchens and online channels, growing at 18.32% and 18.47% CAGR respectively, merit dedicated offerings.

Investment Attractiveness

We found that investment attractiveness is highest in AI enabled appliances at 21.57% CAGR, Smart Food Preparation Appliances at 17.96%, and India at 23.16%. Recurring service revenues and commercial contracts improve earnings quality, while the U.S. and Germany provide scale and stability. Investors should weigh USD 106.44 billion of incremental opportunity against affordability and compliance risks.

Market Shifts and Key Risks

Key shifts in the smart kitchen appliances market include movement from single devices to ecosystems, from preset programs to AI guidance, and from one time sales to services. Risks include affordability limits, long replacement cycles, and cybersecurity obligations under the EU Cyber Resilience Act, which applies reporting duties from 11 September 2026 and fuller requirements from 11 December 2027. Our analysis shows that firms with strong security and software practices will be best placed.

Growth Pathways

Growth pathways in the smart kitchen appliances market include connected refrigeration tied to food waste reduction, AI cooking assistance, subscription and diagnostic services, and commercial kitchen fleets. Emerging markets in South Asia, Southeast Asia, and the Middle East offer expansion as incomes and broadband access improve. Based on research conducted by Next Move Strategy Consulting, we found that companies combining efficient hardware, open standards, and dependable software support will capture the largest share of growth.

Delivered Customizations

We have successfully delivered the following deep-dive customizations:

Client Request Customization Delivered Value Adds
Historical Shipment and Revenue Analysis
  • Historical shipment, unit sales and revenue analysis of smart kitchen appliances across major product types, 2019 to 2025.
  • Identifies fastest-growing appliance categories and sets a verified baseline for the 2026-2035 forecast.
Company-Level Product Category Share Analysis
  • Company-level revenue and unit share by smart product type, such as cooking, refrigeration, dishwashing and food preparation.
  • Reveals where leading brands are concentrated and where competitive white space exists for portfolio decisions.
Trade Flow Assessment for Smart Kitchen Appliances
  • Country-wise import and export analysis of smart kitchen appliances and key components under relevant HS codes.
  • Pinpoints manufacturing hubs and import-dependent markets to guide sourcing, tariff planning and localization choices.
Connectivity and Control Technology Adoption Mapping
  • Adoption mapping of smart kitchen appliances by primary connectivity (Wi-Fi, Bluetooth, Matter/Thread, Zigbee) and primary control technology across product types.
  • Shows which connectivity standards are gaining share, supporting interoperability and ecosystem partnership priorities.
Residential and Commercial Application Demand Mapping
  • Demand sizing of smart kitchen appliances by residential, commercial foodservice and institutional applications, linked to product type.
  • Separates household replacement demand from foodservice investment cycles to prioritize target customer segments.
Online Versus Offline Channel Mix Analysis
  • Distribution channel mix analysis of smart kitchen appliances across online, specialty retail, mass retail and direct-to-consumer channels by product type.
  • Guides channel investment and pricing strategy by showing where each product category sells and how channel share is shifting.

FAQs

Sources & References

1.

Eurostat — Internet of Things: Use by Individuals

ec.europa.eu
2.

International Energy Agency — Household Appliances Database

iea.org
3.

International Telecommunication Union — ITU DataHub

datahub.itu.int/data
4.

European Commission — Domestic Ovens Ecodesign and Energy Labelling

energy-efficient-products.ec.europa.eu
5.

APPLiA — Home Appliance Monitor 2026

applia-europe.eu
6.

U.S. Energy Information Administration — Electricity Data

eia.gov/electricity
7.

Organisation for Economic Co-operation and Development — Household Income Indicators

oecd.org
8.

Eurostat — Comparative Price Levels of Final Consumption

ec.europa.eu/eurostat
9.

Statistics Canada — Consumer Price Index

statcan.gc.ca
10.

United Nations Conference on Trade and Development — UNCTAD Statistics

unctad.org
11.

Eurostat — Cloud Computing Use by Enterprises

ec.europa.eu
12.

United Nations Environment Programme — Food Waste Index Report 2024

unep.org
13.

Connectivity Standards Alliance — Matter 1.5 Announcement

csa-iot.org
14.

EUR-Lex — Regulation (EU) 2024/2847 (Cyber Resilience Act)

eur-lex.europa.eu
15.

UK Legislation — Product Security and Telecommunications Infrastructure Act 2022

legislation.gov.uk
16.

U.S. Federal Communications Commission — U.S. Cyber Trust Mark

fcc.gov/CyberTrustMark
17.

ENERGY STAR — U.S. Environmental Protection Agency and Department of Energy

energystar.gov
18.

Bureau of Energy Efficiency, India — Standards and Labeling

beeindia.gov.in
19.

Ministry of Economy, Trade and Industry, Japan — Top Runner Program

meti.go.jp/english
20.

Australian Government — Energy Rating

energyrating.gov.au
21.

Saudi Standards, Metrology and Quality Organization

saso.gov.sa
22.

Procel — Brazilian National Electricity Conservation Program

gov.br/mme/pt-br
23.

Samsung Newsroom — Home Companion: Samsung Bespoke AI in 2026

news.samsung.com
24.

Samsung Newsroom — New Bespoke AI Appliances at KBIS 2026

news.samsung.com
25.

Samsung Newsroom — Bespoke AI and Dacor at KBIS 2026

news.samsung.com
26.

Samsung Newsroom — Bespoke AI Kitchen and Living Appliances for 2026 (Europe)

news.samsung.com
27.

Haier Smart Home — 2025 Annual Results Press Release

haier.com
28.

Haier Smart Home — 2026 Interim Results Press Release

haier.com
29.

HKEXnews — Haier Smart Home Interim Results Announcement, Six Months Ended 30 June 2026

www1.hkexnews.hk
30.

United Nations Department of Economic and Social Affairs — World Urbanization Prospects

population.un.org/wup

About the Author

Mihul Sharma

Mihul Sharma

Mihul Sharma is Research Associate at Next Move Strategy Consulting, where he has covered technology, industrial, and healthcare markets for 3 years. His work applies structured business research, market analysis, and secondary-source review to assess market trends, competitive developments, and growth opportunities. He supports report development by fully synthesizing industry data, company information, and market signals into concise findings for strategy and investment-focused research teams.

About the Reviewer

Supradip Baul

Supradip Baul

Supradip Baul is an accomplished business consultant and strategist with over a decade of rich experience in market intelligence, strategy, technology, and business transformation. His work has included rigorous qualitative and quantitative analysis across multiple industries, helping clients shape investment decisions and long-term roadmaps. Earlier in his career, he was associated with Gartner, where he contributed to industry-leading reports and market share analyses. He has worked with leading global companies and holds an MBA with a dual specialization in Marketing and Finance.

Download Free Sample

Nishant Awate

NISHANT AWATE

Business Development Global Sales

Zehnder Group Deutschland GmbH

Our experience working with Next Move Strategy Consulting was positive. The team was responsive, professional, and open to incorporating our specific requirements throughout the project. The India AHU market study was comprehensive and well structured, covering market value and volume forecasts, product and application segments, and key industry trends. The inclusion of both AHU and residential MVHR market insights made the study particularly relevant for our strategic market assessment. Overall, the report provides a solid foundation for evaluating market potential, identifying priority segments, and supporting business-development decisions in India.

Mohit Agarwal

MOHIT AGARWAL

Chief Manager

DryChem India Pvt. Ltd.

Next Move Strategy Consulting is an amazing team of consultants. We required a market study report for our investors on top priority and the team went above and beyond our expectations to deliver the same with ample supporting data within a short time span enabling us to secure the investments and keep our project timeline maintained. Their professionalism, attention to detail, and timely delivery of actionable recommendations have left a lasting impression on our organization.

Kevin Coker

KEVIN COKER

Founder, CEO and Board Diector

Proxima Clinical Research

I have been using Next MSC reports for product positioning in a new geography for a long time. They have by far the best reports I have found and the price is reasonable too!

Melanie Samko

MELANIE SAMKO

Director of Marketing

TOSOH BIOSCIENCE, INC.

The information provided by NMSC is incredibly valuable, thank you so much for such a excellent work. I really appreciate it. I will make sure to reference all of it, in my summary document.

Pratyush Kumar Das

PRATYUSH KUMAR DAS

Assistant Manager

Polycab India Limited

We would like to express our appreciation for the data and insights provided by nextmsc. We are very pleased with the quality and depth of the information, which has proven to be highly valuable and beneficial for our business decision-making.

Custom Market Research Services

We will customize the research for you if the listed report does not fully match your requirements.

Get 30% Free Customization

Select License

This website uses cookies to ensure you get the best experience on our website. Learn more

✖