South Korea Smart Display Market by Technology (LCD, OLED, E-Paper, MicroLED, and Other Display Technologies), by Form Factor (Standalone Device and Embedded Module), by Display Size (Below 10 Inch, 10 Inch to 24 Inch, 24 Inch to 55 Inch, and Above 55 Inch), by Resolution (Below HD, HD, Full HD, QHD & 2K, 4K UHD, and 8K & Above), by Application (Consumer, Automotive, Commercial, Healthcare, Industrial, and Other Applications) – Global Opportunity Analysis and Industry Forecast, 2023–2030
Industry: Semiconductor & Electronics | Lastest Edition: June 5, 2026 | No of Pages: 169 | No. of Tables: 59 | No. of Figures: 54 | Format: PDF | Report Code : SE1035
Market Definition
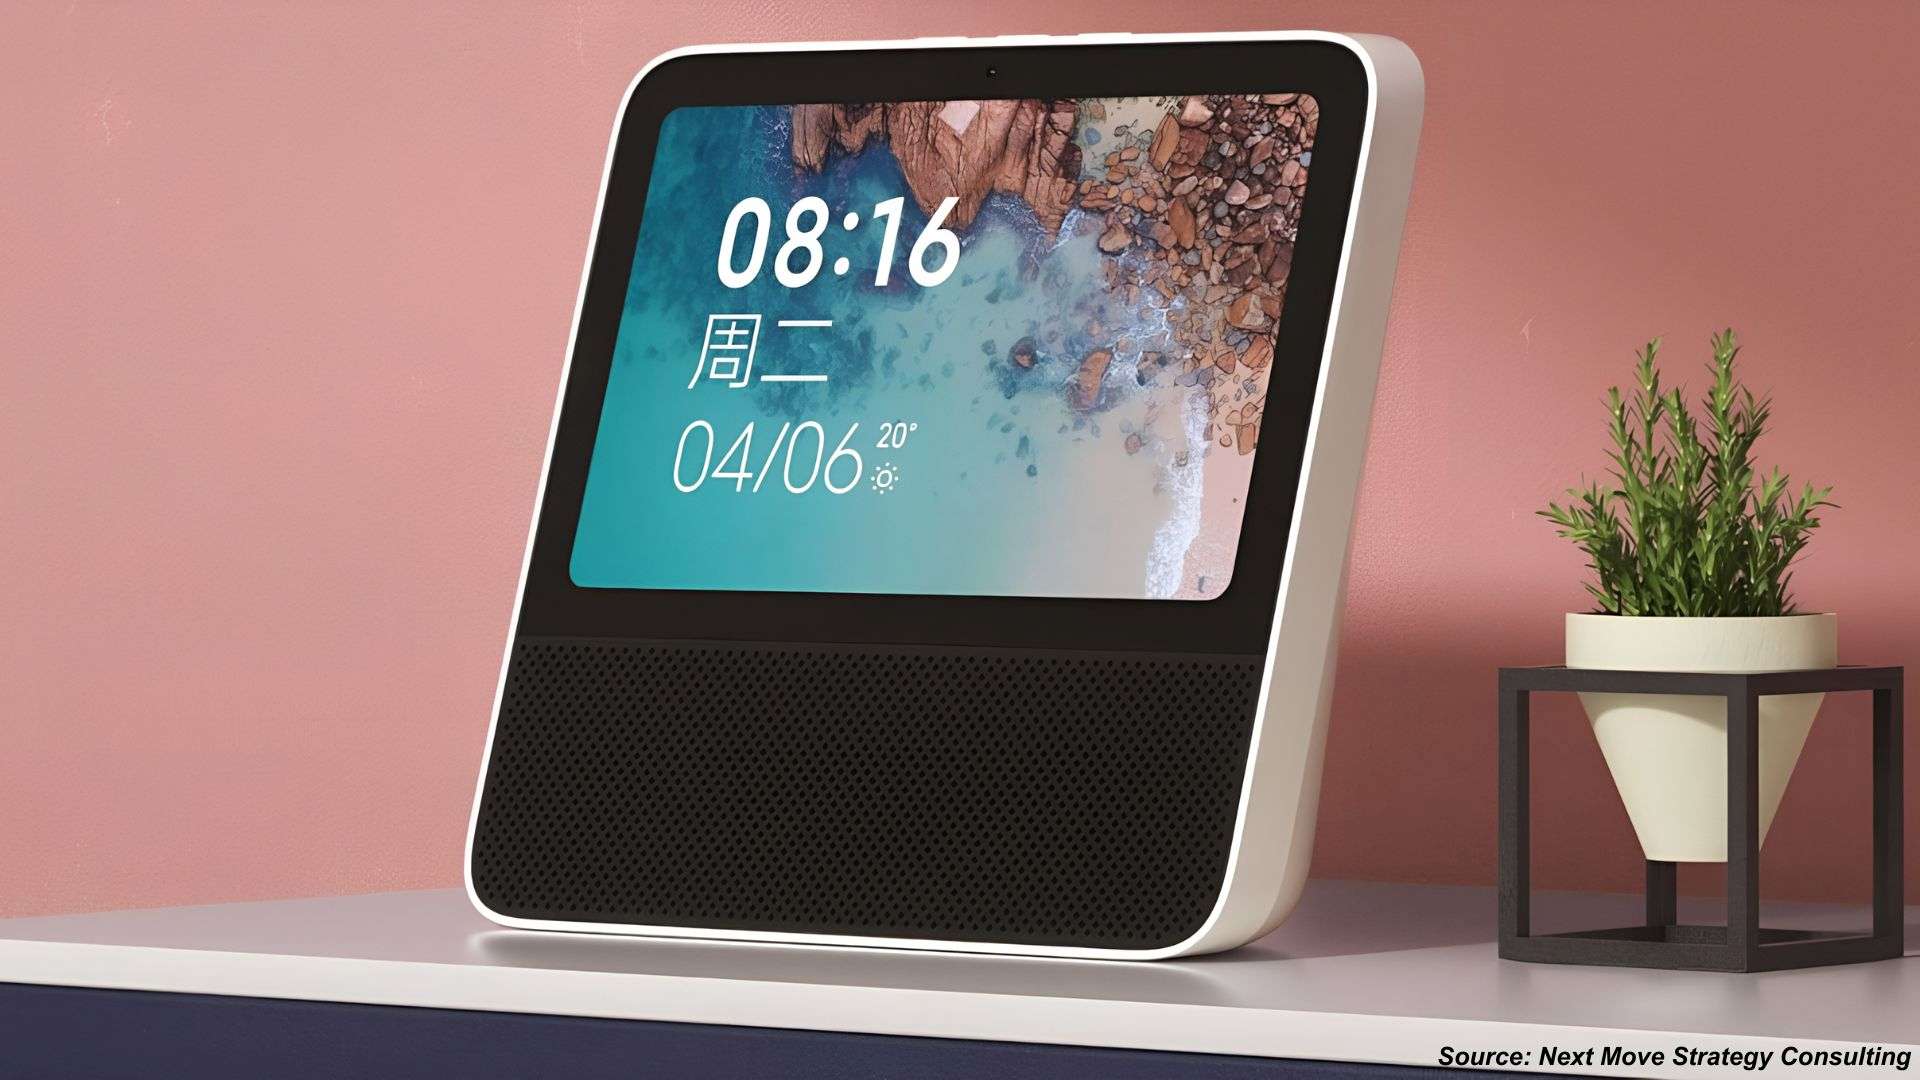
South Korea Smart Display Market was valued at USD 869.54 million in 2022, and is predicted to reach USD 3824.6 million by 2030, with a CAGR of 18.7% from 2023 to 2030. A smart display is a sophisticated device featuring a touchscreen or interactive visual interface, coupled with voice recognition and artificial intelligence capabilities.
Functioning as versatile information hubs, these displays can execute diverse tasks, including presenting information and managing smart home devices. They offer visual responses to voice commands, facilitating video calls and serving as interactive tools for scheduling, weather updates, and entertainment purposes.
Smart displays are meticulously crafted to elevate convenience, accessibility, and user engagement across various settings, such as homes, offices, and public spaces. Their applications span residential homes, offices, healthcare facilities, retail, education, and beyond.
Innovative Solutions for Health: Korean Startups Drive Surge in Smart Display Demand in Healthcare
The Korean-based startup companies are dedicatedly focusing on the development of the devices embedded with smart display specifically for the healthcare sector. This in turn, thrives the demand for the smart display market. Korean startup ICON.AI introduced the world's first 2-in-1 Smart Healthcare Device at CES 2021. It combines an Alexa Built-in Smart Display Speaker with a detachable health tracker, providing rapid assessment of vital health metrics in under a minute.
The device includes an LCD touchscreen, a 5W speaker, Bluetooth, and WiFi. The detachable health tracker monitors six critical health readings and can send reports directly to smartphones or tablets. This user-friendly technology has the potential to revolutionize personal health tracking.
Driving into the Future: South Korea's Automotive Revolution with Cutting-Edge Smart Displays
The integration of smart displays by leading automotive companies in South Korea is reshaping the market. These advanced displays offer enhanced connectivity and entertainment options, revolutionizing the driving experience. This surge in demand for vehicles with these displays is a key driver for the South Korean smart display market. Recently, Hyundai Mobis has pioneered the world's inaugural rollable automotive display.
This innovative screen can be rolled up and down to showcase driving information such as navigation, optimizing interior design by conserving space. Available in QHD resolution or higher, it enables the creation of large screens, exceeding 30 inches. This breakthrough promises to revolutionize automotive displays.
Security Vulnerabilities in Smart Home Displays Restrain Market Growth
Security vulnerabilities in smart display technology represent a significant restraining factor for the smart display market. The potential for security breaches in smart displays poses a substantial risk to users. Insufficient security measures, such as weak passwords and inadequate encryption, could lead to the exposure of sensitive data. Therefore, it is imperative for manufacturers to prioritize robust security features within smart displays, including strong authentication methods and prompt vulnerability patching through regular updates.
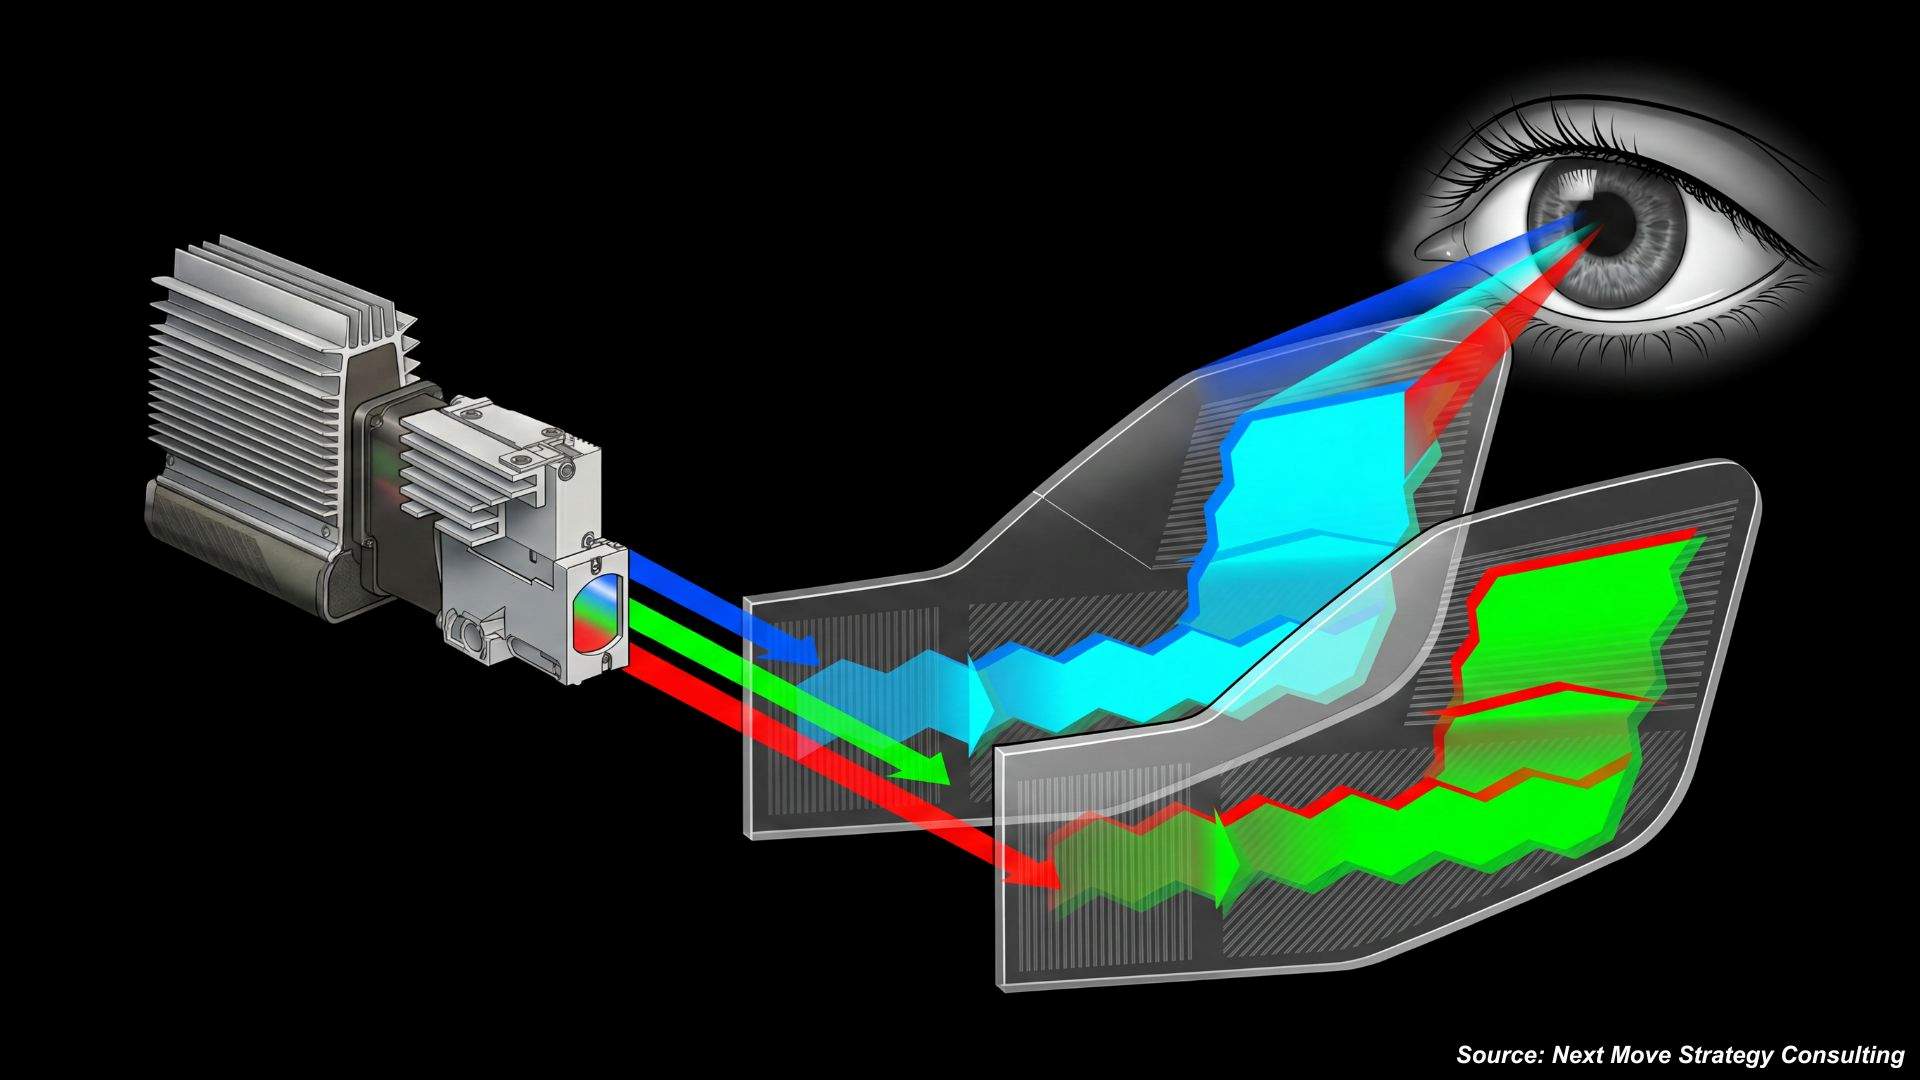
Introduction of Laser-Based Display Technology
Laser-based display technology is presenting substantial opportunities within the smart display market. Its exceptional brightness, color accuracy, long-lasting durability, and energy efficiency position it as a prime choice for diverse applications, spanning from home theaters to outdoor signage and augmented reality experiences. The extended lifespan and reliability of laser-based displays result in reduced maintenance costs and align with sustainability objectives.
As this technology becomes increasingly accessible and cost-effective, it is instigating innovation in the realm of smart displays, particularly in sectors where top-tier visual quality and energy conservation are paramount, thus broadening the market's potential for expansion.
Competitive Landscape
The South Korea smart display industry includes several market players such as Samsung Electronics, Qisda Corporation (BenQ), LG Corporation, Sharp Corporation, Lenovo Group Limited, Alps Alpine Co., Ltd, Sony Corporation, Google, LLC., Leyard Optoelectronic Co., and Amazon.com, Inc.
Key Benefits
-
The South Korea smart display market report provides a quantitative analysis of the current market and estimations through 2023-2030 that assists in identifying the prevailing market opportunities to capitalize on.
-
The study comprises a deep dive analysis of the market trend including the current and future trends for depicting the prevalent investment pockets in the market.
-
The information related to key drivers, restraints, and opportunities and their impact on the market is provided in the report.
-
The competitive analysis of the market players along with their market share in the South Korea smart display market.
-
The SWOT analysis and Porter’s Five Forces model are elaborated in the study.
-
Value chain analysis in the market study provides a clear picture of the stakeholders’ roles.
South Korea Smart Display Market Key Segments
By Technology
-
LCD
-
OLED
-
E-Paper
-
MicroLED
-
Others Display
By Form Factor
-
Standalone Device
-
Embedded Module
By Size
-
Below 10 inch
-
10 to 24 inch
-
24 to 55 inch
-
Above 55 inch
By Resolution
-
Below HD (<1280×720)
-
HD (1280×720)
-
Full HD (1920×1080)
-
QHD and 2K (2560×1440, 2048×1080)
-
4K UHD (3840×2160)
-
8K and Above
By Application
-
Consumer
-
Assistant Display
-
Smart Appliance
-
Smart Mirror
-
-
Automotive
-
Infotainment
-
Instrument Cluster
-
Rear Seat Display
-
Mirror Display
-
-
Commercial
-
Retail
-
Hospitality
-
Office
-
Education
-
Transportation
-
Public Information
-
-
Healthcare
-
Patient Monitoring
-
Telehealth
-
Imaging
-
Clinical Collaboration
-
-
Industrial
-
HMI
-
Automation Panels
-
Control Room
-
-
Other Applications
Key Players
-
Samsung Electronics
-
Qisda Corporation (BenQ)
-
LG Corporation
-
Sharp Corporation
-
Lenovo Group Limited
-
Alps Alpine Co., LTD
-
Sony Corporation
-
Google, LLC.
-
Leyard Optoelectronic Co
-
Amazon.com, Inc.
Report Scope And Segmentation:
|
Parameters |
Details |
|
Market Size in 2022 |
USD 869.54 Million |
|
Revenue Forecast in 2030 |
USD 3824.6 Million |
|
Growth Rate |
CAGR of 18.7% from 2023 to 2030 |
|
Analysis Period |
2022–2030 |
|
Base Year Considered |
2022 |
|
Forecast Period |
2023–2030 |
|
Market Size Estimation |
Million (USD) |
|
Growth Factors |
|
|
Companies Profiled |
10 |
|
Market Share |
Available for 10 companies |
|
Customization Scope |
Free customization (equivalent up to 80 working hours of analysts) after purchase. Addition or alteration to country, regional, and segment scope. |
|
Pricing and Purchase Options |
Avail customized purchase options to meet your exact research needs. |
")

About the Author
 Sikha Haritwal is an assistant manager with strong expertise in market research, data analysis, and cross-functional coordination. She plays a key role in leading complex research initiatives, strengthening analytical rigor, and enabling data-driven decision-making across teams. Known for her leadership mindset and structured problem-solving approach, she supports process improvement, enhances operational efficiency, and contributes to building scalable frameworks that drive long-term strategic outcomes and organizational effectiveness.
About the Reviewer
 Supradip Baul is an accomplished business consultant and strategist with over a decade of rich experience in market intelligence, strategy, technology, and business transformation. His work has included rigorous qualitative and quantitative analysis across multiple industries, helping clients shape investment decisions and long-term roadmaps. Earlier in his career, he was associated with Gartner, where he contributed to industry-leading reports and market share analyses. He has worked with leading global companies and holds an MBA with a dual specialization in Marketing and Finance.
At Next Move Strategy Consulting, we understand that insightful market research is the cornerstone of successful business decisions. That's why we employ a robust and multifaceted approach, combining various methodologies to deliver the most accurate and actionable data for our clients.

Research Landscape
We navigate the world of research with two primary approaches:
Qualitative Approach
Our qualitative research methodologies involve immersive techniques such as in-depth interviews, focus groups, and observational studies. By engaging directly with individuals and stakeholders, we uncover valuable insights that quantitative data alone may overlook.

Quantitative Research
In tandem with qualitative methodologies, NMSC leverages the power of Quantitative Research to provide a robust foundation of numerical insights. Through systematic data collection and analysis, we quantify patterns, preferences, and market trends, offering a comprehensive view of the business landscape.
Our quantitative research approach employs diverse tools, including surveys, experiments, and statistical modelling. These methodologies enable us to gather data from a large and representative sample, ensuring the statistical significance of our findings. By employing structured questionnaires and standardized data collection methods, we guarantee the reliability and validity of the information we present to our clients.
Quantitative research is particularly effective in measuring the prevalence of trends, assessing market size, and gauging the impact of various factors on consumer behavior. The numerical precision attained through this approach equips our clients with actionable insights, facilitating data-driven decision-making and strategy formulation.


Our Specialized Toolbox for Industry-Specific Market Research
We deploy a specialized arsenal of techniques tailored to meet your unique requirements. Here's a glimpse into our comprehensive toolbox:

Information Procurement
The stage entails acquiring market data or relevant information through various sources and methodologies.


Market Research Approach
We utilize both top-down and bottom-up approaches in market research analysis to achieve a comprehensive understanding of the market dynamics, leveraging the broad perspective of industry trends and macroeconomic factors alongside detailed insights from specific segments and individual companies.

Porters Five Forces Analysis
We conduct Porter's Five Forces analysis to evaluate the competitive landscape of an industry, providing us with insights into factors that affect profitability and strategic positioning.

SWOT Analysis

Forecasting
We utilize a forecasting model to predict future consumption by considering parameters like population, economics, regulations, market competition, drivers, constraints, technology, and pricing. We also employ statistical techniques such as multilinear regression, exponential smoothing, moving average, ARIMA, and Monte Carlo simulations for accurate predictions. In econometric forecasting, we analyzed short-term and long-term event impacts, attributing values based on regulatory frameworks, economic factors, and market events.


 Speak to Our Analyst