Spain Early Toxicity Testing Market by Technique (In Vivo, In Vitro and In Silico), by Toxicity Endpoint (Genotoxicity, Dermal Toxicity, Skin Toxicity, Ocular Toxicity, Phototoxicity, and Others), and by End-User (Pharmaceutical Industry, Cosmetic Industry, Chemical Industry, Food Industry, and Others) – Opportunity Analysis and Industry Forecast, 2025–2030
Industry: Healthcare | Publish Date: 22-May-2025 | No of Pages: 147 | No. of Tables: 112 | No. of Figures: 57 | Format: PDF | Report Code : HC735
Spain Early Toxicity Testing Industry Overview
The Spain Early Toxicity Testing Market size was valued at USD 46.7 million in 2024, and is predicted to reach USD 98.7 million by 2030, at a CAGR of 13.3% from 2025 to 2030.
The early toxicity testing market in Spain is experiencing growth driven by increasing government initiatives and the rising incidence of cancer. However, rigorous testing protocols remain a significant challenge.
The introduction of new technologies, such as 3D cell culture in in-vitro testing, presents promising future opportunities to enhance the accuracy and reliability of toxicity testing, which is expected to propel the Spain early toxicity market demand in the coming years.
Major players such as Merck KGaA, Laboratory Corporation of America Holdings, Medpace, Thermo Fisher Scientific, Charles River Laboratories International, Inc., and others are actively participating in initiatives like product launches and collaborations across regions to strengthen their market positions. These strategies aim to speed up the identification of safety issues, ensuring quicker market adoption.
Additionally, advancements in 3D cell culture technologies are expected to reduce clinical trial risks, ensuring product safety and regulatory compliance while addressing concerns related to ethical testing.
Increasing Government Initiatives Fuel Market Growth
Government investments in healthcare systems are a key driver of the early toxicity testing market in Spain. The government is committed to funding research and development of new medications and technologies to improve citizens' health.
New drugs and treatments developed under these initiatives require advanced early testing methods to detect potential toxins. These testing procedures increase drug efficiency and safety while reducing both development time and costs. The government's increased focus on the medical sector helps accelerate the growth of the early toxicity testing market.
Rising Cancer Incidences Drive the Market Growth
The growing incidence of cancer in Spain is a significant driver of the Spain early toxicity testing market growth. As cancer rates increase, there is an intensified demand for safe and effective treatment options.
With the development of new cancer therapies, the need for early toxicity testing has grown, as ensuring the safety of these treatments for patients and meeting regulatory standards becomes a priority. As a result, the early toxicity testing market in Spain is expanding to support the growing focus on developing safer, more effective cancer treatments.
Rigorous Testing Protocols Restrain the Spain Early Toxicity Testing Market Expansion
While the early toxicity testing market is growing, the presence of stringent and rigorous testing protocols imposed by regulatory bodies like the European Medicines Agency (EMA) remains a challenge. These protocols require extensive preclinical and clinical evaluations, resulting in prolonged approval timelines for new drugs and therapies.
The delays caused by these lengthy processes can hinder the introduction of innovative therapies to the market, ultimately reducing demand for early toxicity testing solutions and slowing market expansion.
Advent of New Technologies Creates Growth Opportunities
The adoption of new technologies, particularly 3D cell culture in in-vitro modeling, is expected to provide significant growth opportunities for the early toxicity testing market. These advanced models closely replicate human tissue complexity, allowing for more accurate predictions of toxicity and drug safety. By reducing reliance on animal testing, 3D cell cultures enhance the precision and reliability of toxicity testing, accelerating early-stage drug development and enabling quicker identification of potential safety concerns. This technological advancement is expected to drive further growth in the early toxicity testing market in Spain.
Competitive Landscape
The promising players operating in the Spain early toxicity testing industry includes Merck KGaA, Laboratory Corporation of America Holdings, Medpace, Thermo Fisher Scientific, Charles River Laboratories International, Inc., Eurofins Scientific, PerkinElmer, Inc., Bio-Rad Laboratories, Inc., Agilent Technologies, Inc., Bruker Corporation, ICON plc, Premier Research, Hangzhou Singclean Medical Products Co., Ltd., ReadyCell, S.L., Linical Co. Meditrial, and others.
Spain Early Toxicity Testing Market Key Segments
By Technique
-
In Vivo
-
In Vitro
-
Cell Culture
-
PCR
-
ELISA
-
Western Blotting
-
Protein Binding Assays
-
-
In Silico
By Toxicity Endpoint
-
Genotoxicity
-
Dermal Toxicity
-
Skin Toxicity
-
Ocular Toxicity
-
Phototoxicity
-
Others
By End-User
-
Pharmaceutical Industry
-
Cosmetic Industry
-
Chemical Industry
-
Food Industry
-
Others
Key Players
-
Merck KGaA
-
Laboratory Corporation of America Holdings
-
Medpace
-
Thermo Fisher Scientific
-
Charles River Laboratories International, Inc.
-
Eurofins Scientific
-
PerkinElmer, Inc.
-
Bio-Rad Laboratories, Inc.
-
Agilent Technologies, Inc.
-
Bruker Corporation
-
ICON plc
-
Premier Research
-
Hangzhou Singclean Medical Products Co., Ltd.
-
ReadyCell, S.L.
-
Linical Co. Meditrial
REPORT SCOPE AND SEGMENTATION:
|
Parameters |
Details |
|
Market Size Value in 2024 |
USD 46.7 million |
|
Revenue Forecast in 2030 |
USD 98.7 million |
|
Value Growth Rate |
CAGR of 13.3% from 2025 to 2030 |
|
Analysis Period |
2024–2030 |
|
Base Year Considered |
2024 |
|
Forecast Period |
2025–2030 |
|
Market Size Estimation |
Million (USD) |
|
Growth Factors |
|
|
Companies Profiled |
15 |
|
Market Share |
Available for 10 companies |
|
Customization Scope |
Free customization (equivalent up to 80 working hours of analysts) after purchase. Addition or alteration to country, regional, and segment scope. |
|
Pricing and Purchase Options |
Avail customized purchase options to meet your exact research needs. |
")


About the Author
 Sikha Haritwal is a researcher with more than 5 years of experience. She has been keeping a close eye on several industry verticals, including construction & manufacturing, personal care products, and consumer electronics. She has avid interest in writing news articles and hopes to use blog as a platform to share her knowledge with others.
About the Reviewer
 Supradip Baul is an accomplished business consultant and strategist with over a decade of rich experience in market intelligence, strategy, technology and business transformation. His work has included rigorous qualitative and quantitative analysis across multiple industries, helping clients shape investment decisions and long-term roadmaps. Earlier in his career, he was associated with Gartner, where he contributed to industry-leading reports and market share analyses. He has worked with leading global companies and holds an MBA with a dual specialization in Marketing and Finance.
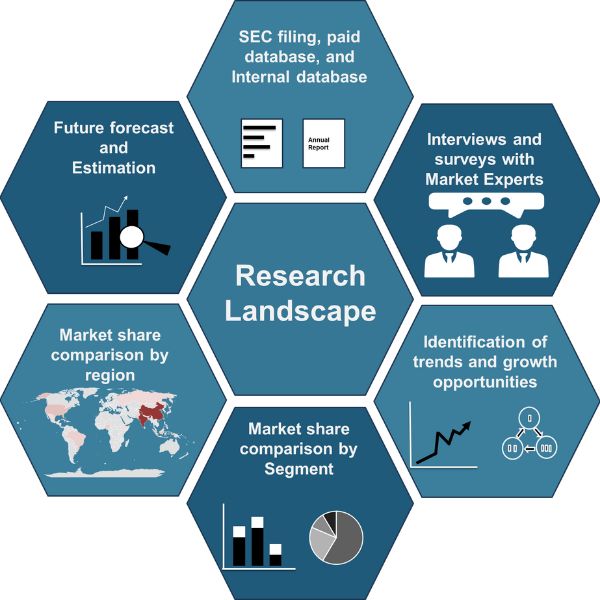
At Next Move Strategy Consulting, we understand that insightful market research is the cornerstone of successful business decisions. That's why we employ a robust and multifaceted approach, combining various methodologies to deliver the most accurate and actionable data for our clients.
Research Landscape
We navigate the world of research with two primary approaches:
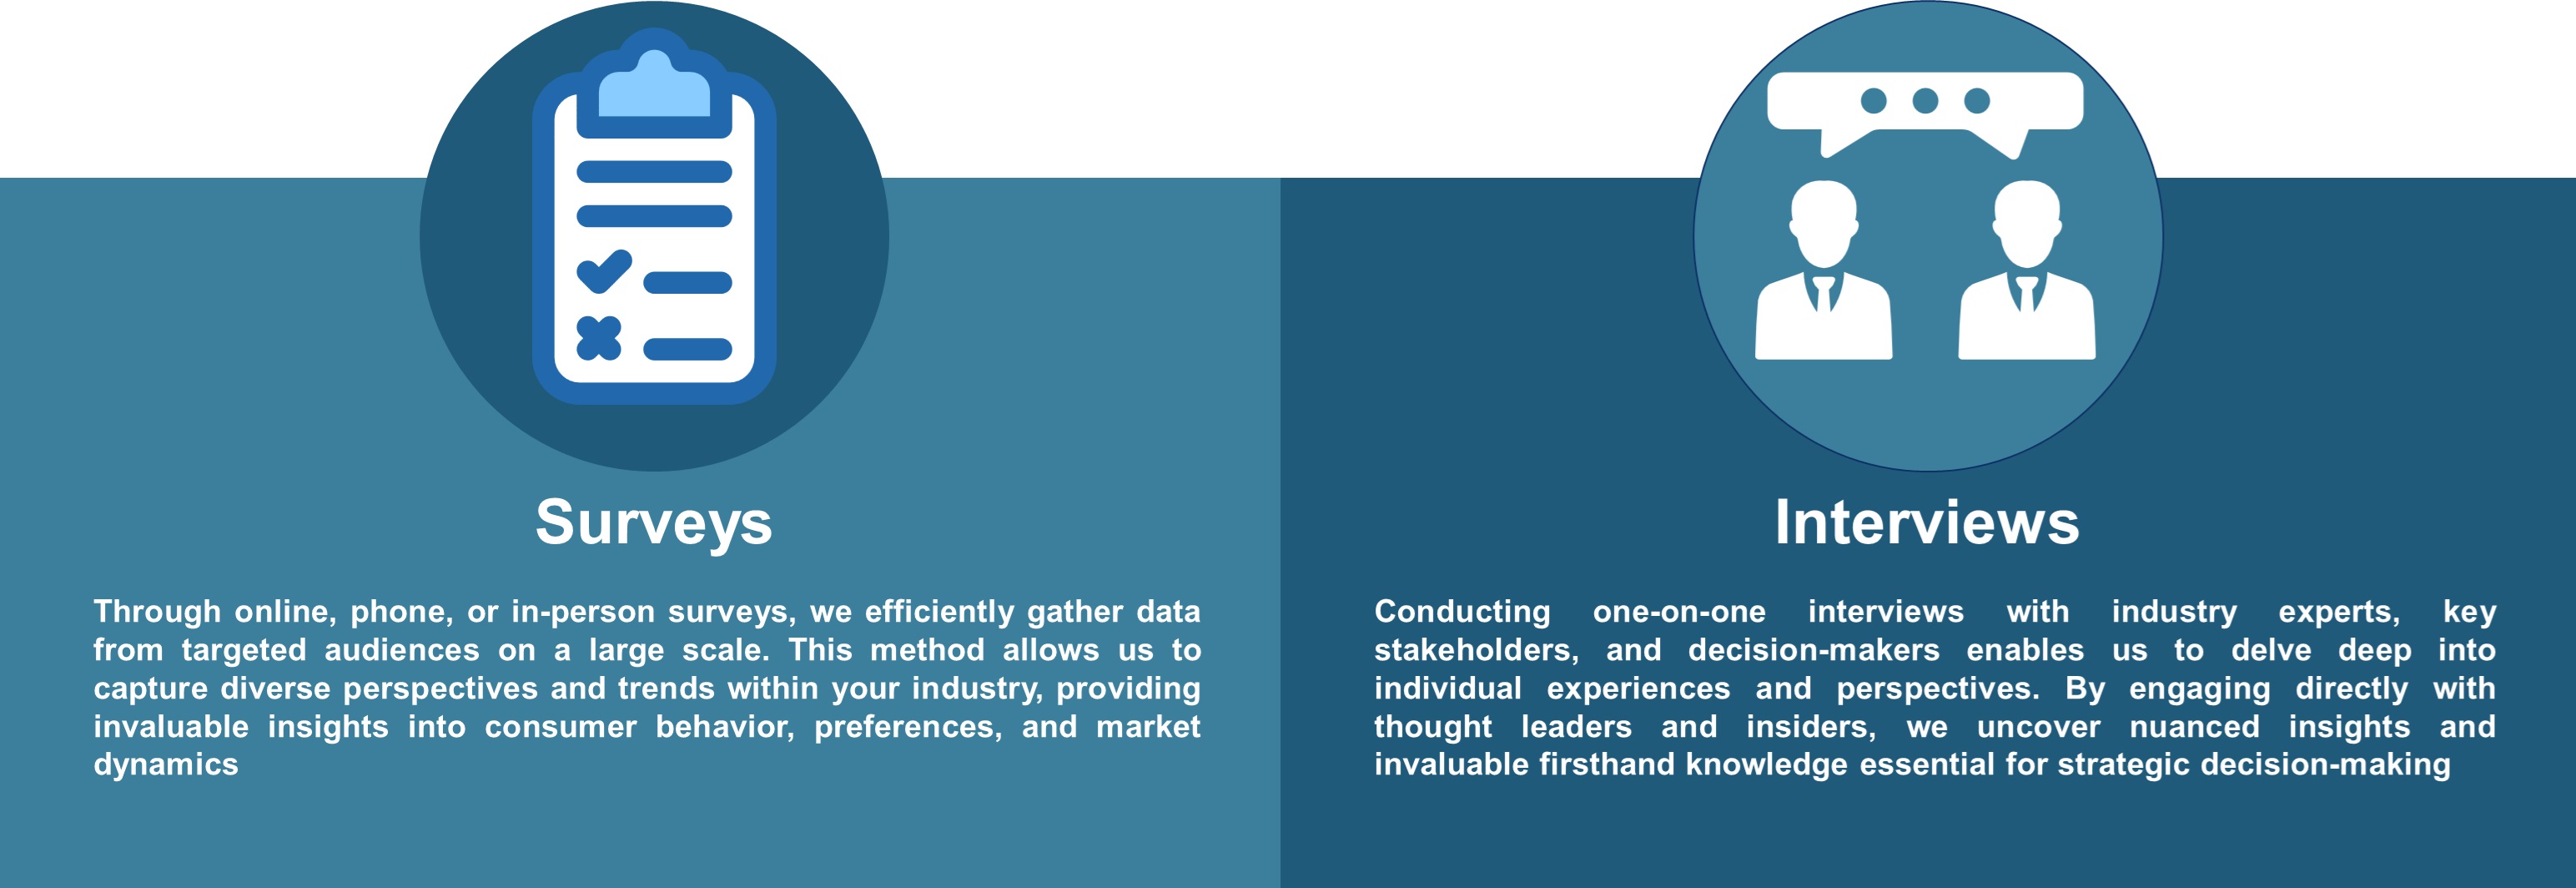
Qualitative Approach
Our qualitative research methodologies involve immersive techniques such as in-depth interviews, focus groups, and observational studies. By engaging directly with individuals and stakeholders, we uncover valuable insights that quantitative data alone may overlook.
Quantitative Research
In tandem with qualitative methodologies, NMSC leverages the power of Quantitative Research to provide a robust foundation of numerical insights. Through systematic data collection and analysis, we quantify patterns, preferences, and market trends, offering a comprehensive view of the business landscape.
Our quantitative research approach employs diverse tools, including surveys, experiments, and statistical modelling. These methodologies enable us to gather data from a large and representative sample, ensuring the statistical significance of our findings. By employing structured questionnaires and standardized data collection methods, we guarantee the reliability and validity of the information we present to our clients.
Quantitative research is particularly effective in measuring the prevalence of trends, assessing market size, and gauging the impact of various factors on consumer behavior. The numerical precision attained through this approach equips our clients with actionable insights, facilitating data-driven decision-making and strategy formulation.
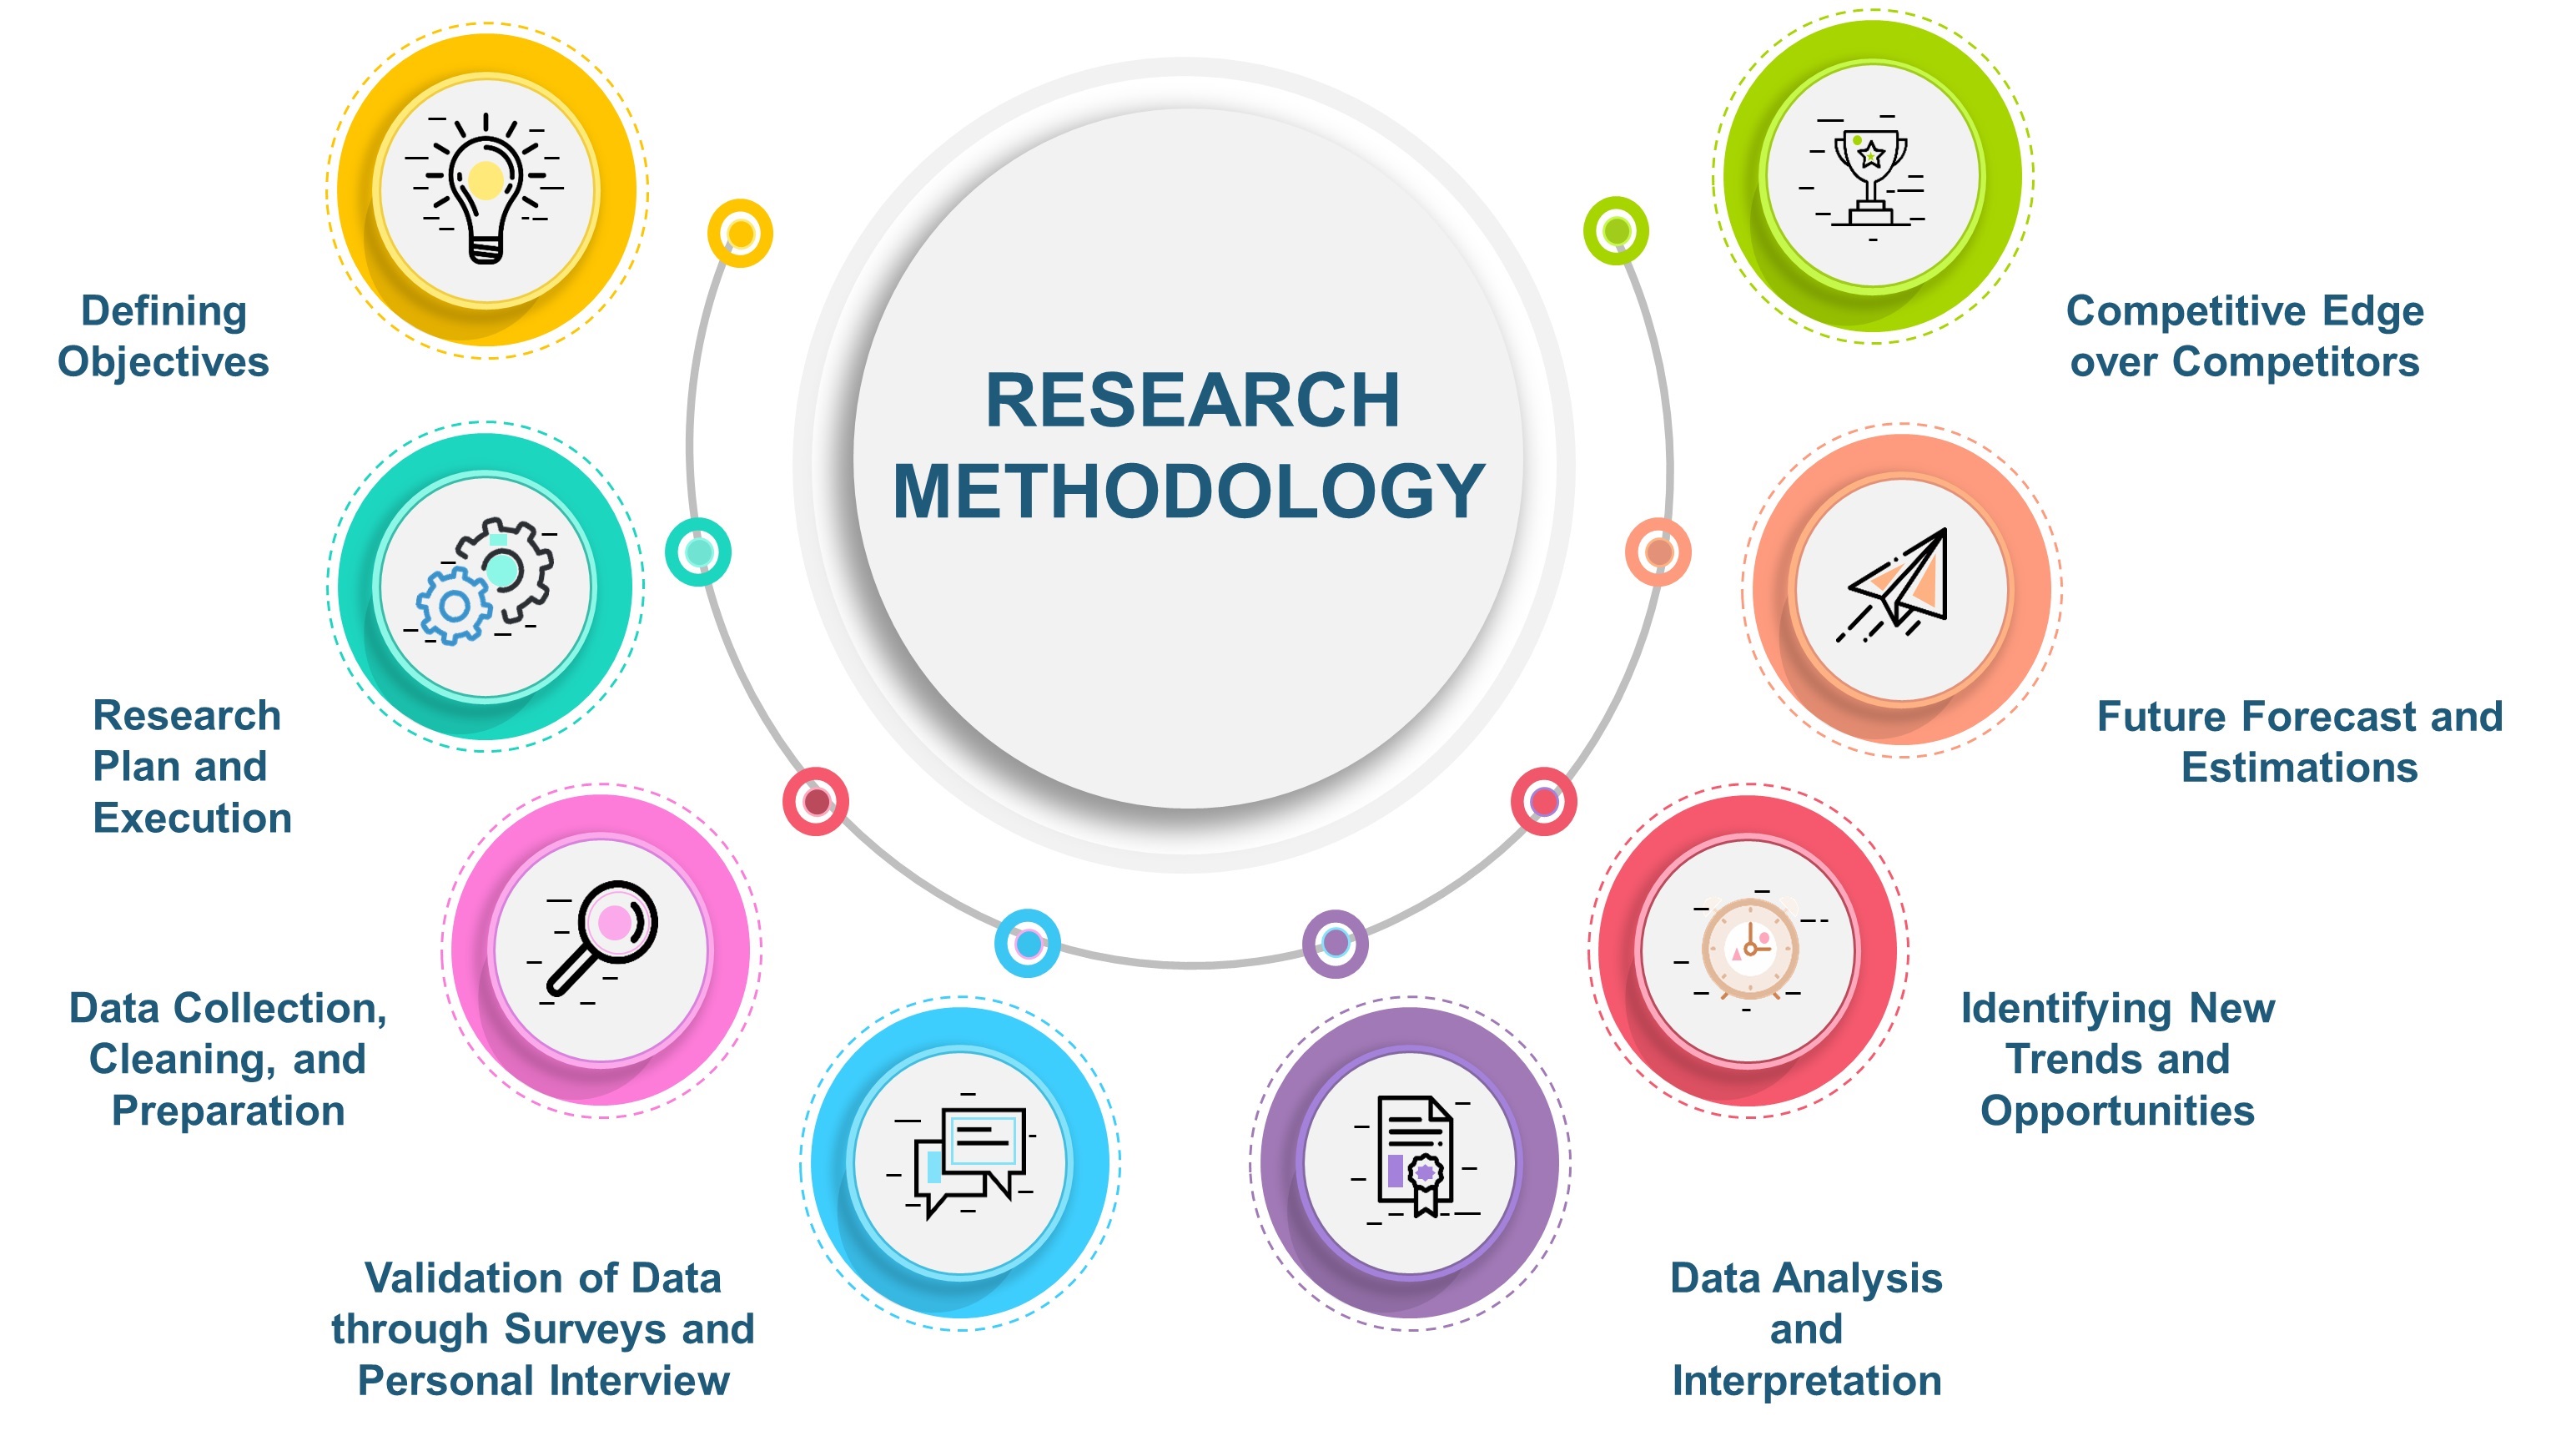
Our Specialized Toolbox for Industry-Specific Market Research
We deploy a specialized arsenal of techniques tailored to meet your unique requirements. Here's a glimpse into our comprehensive toolbox:
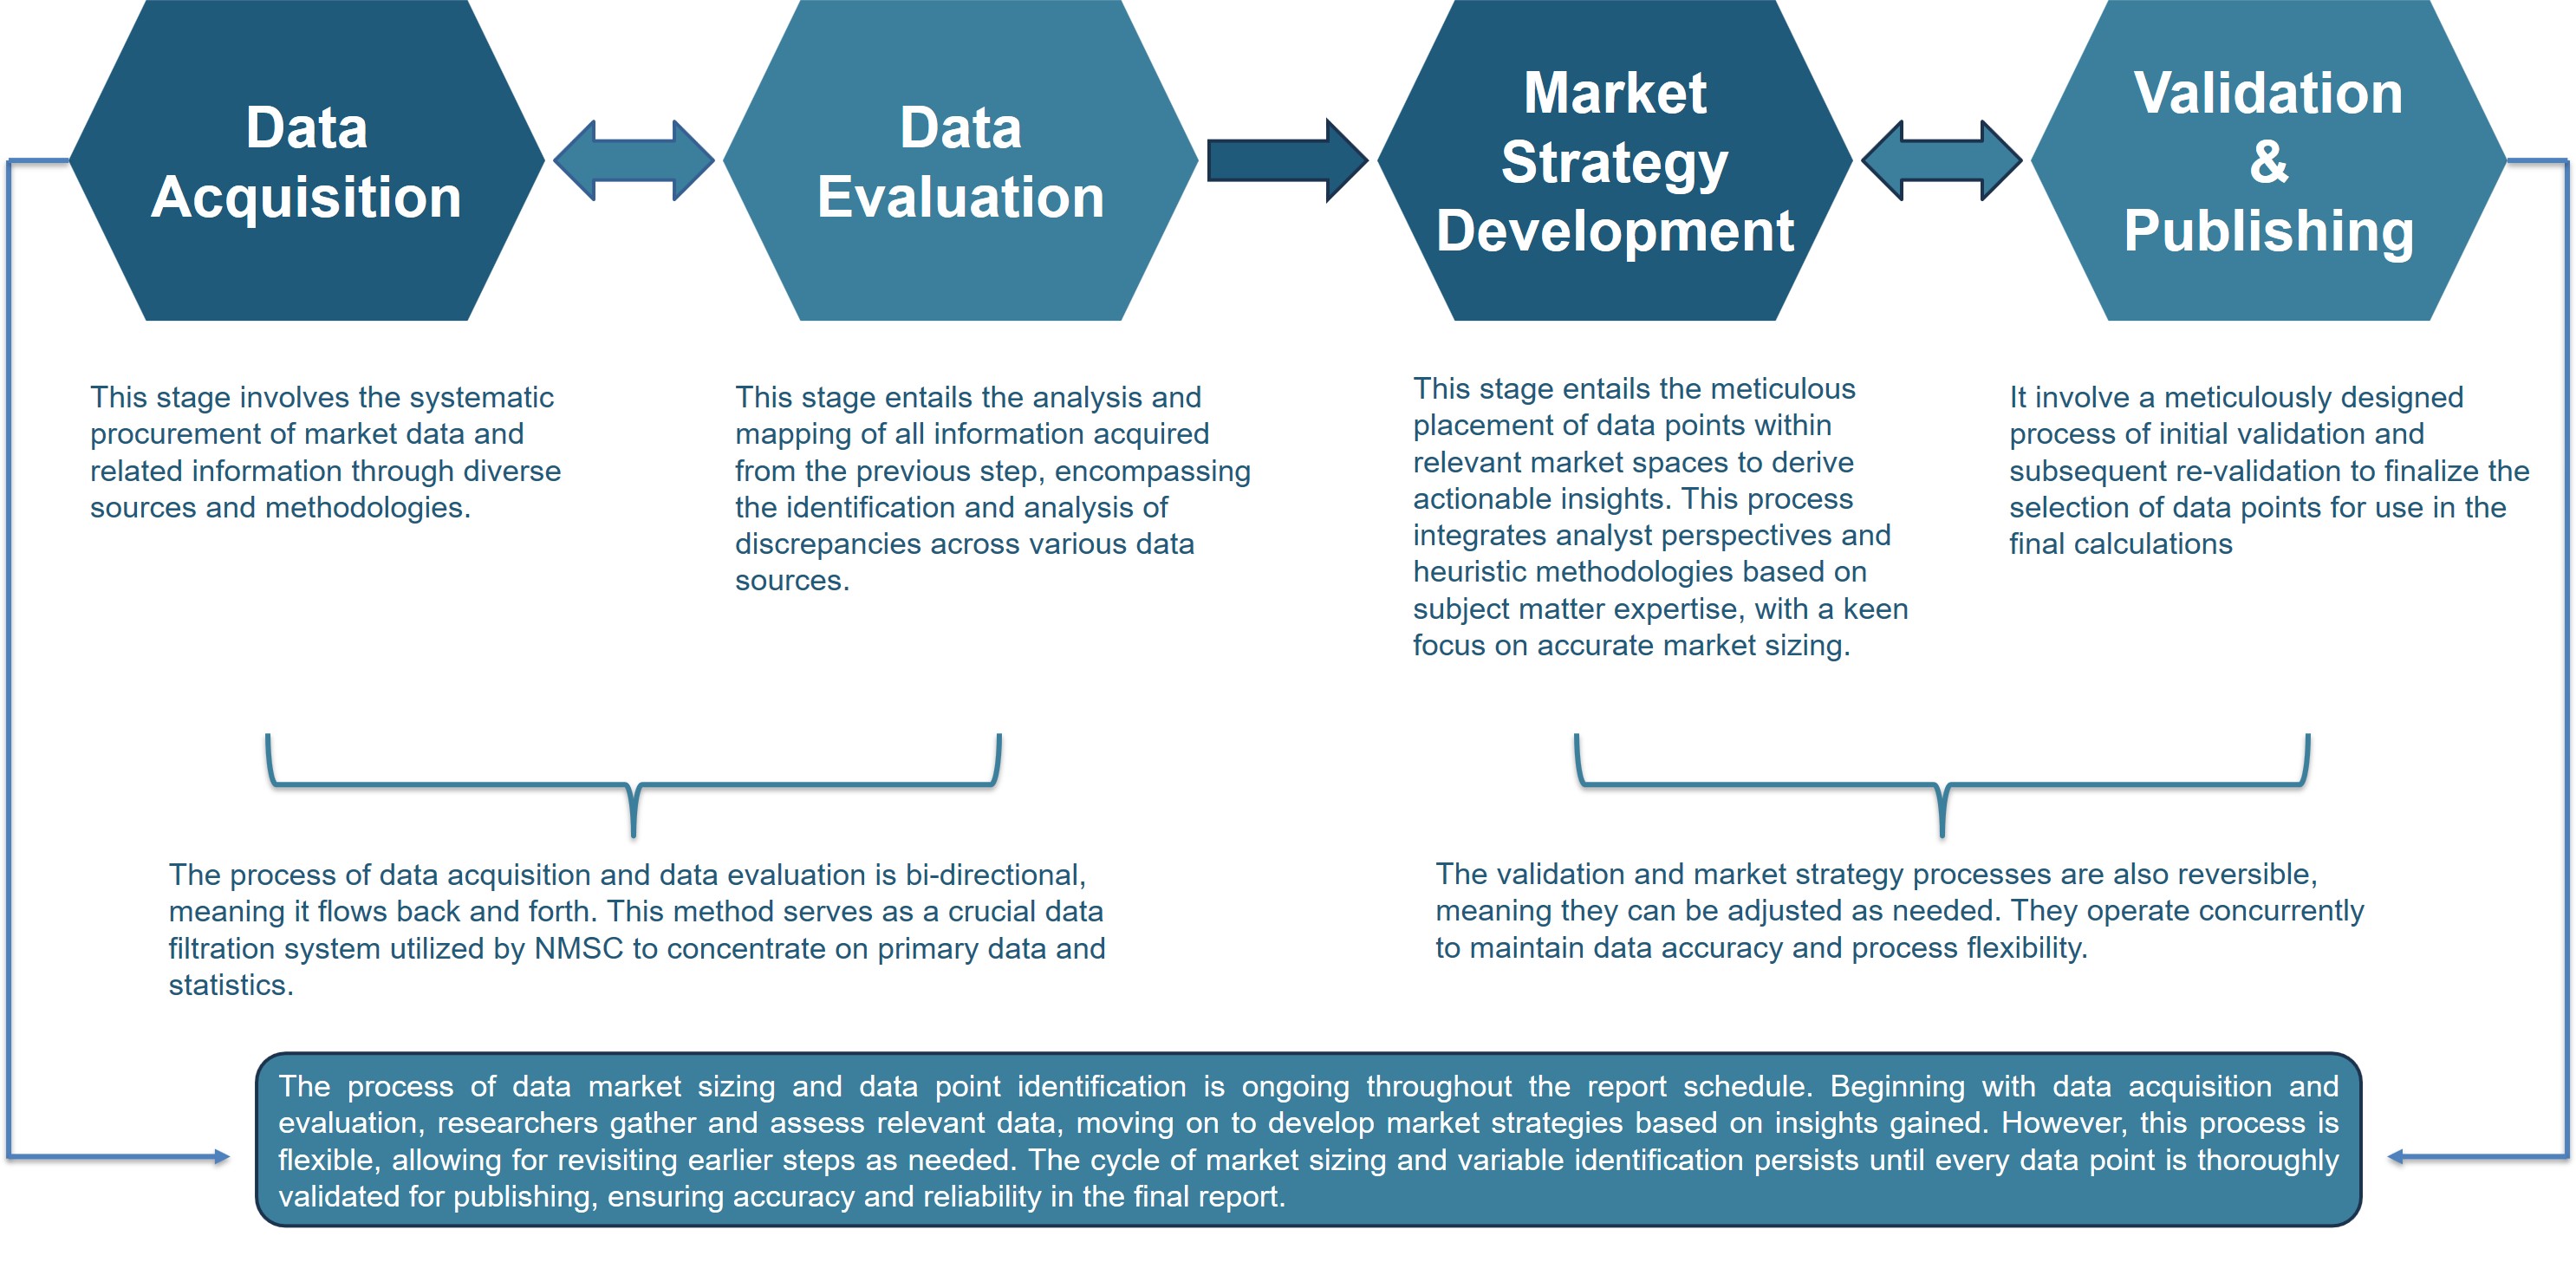
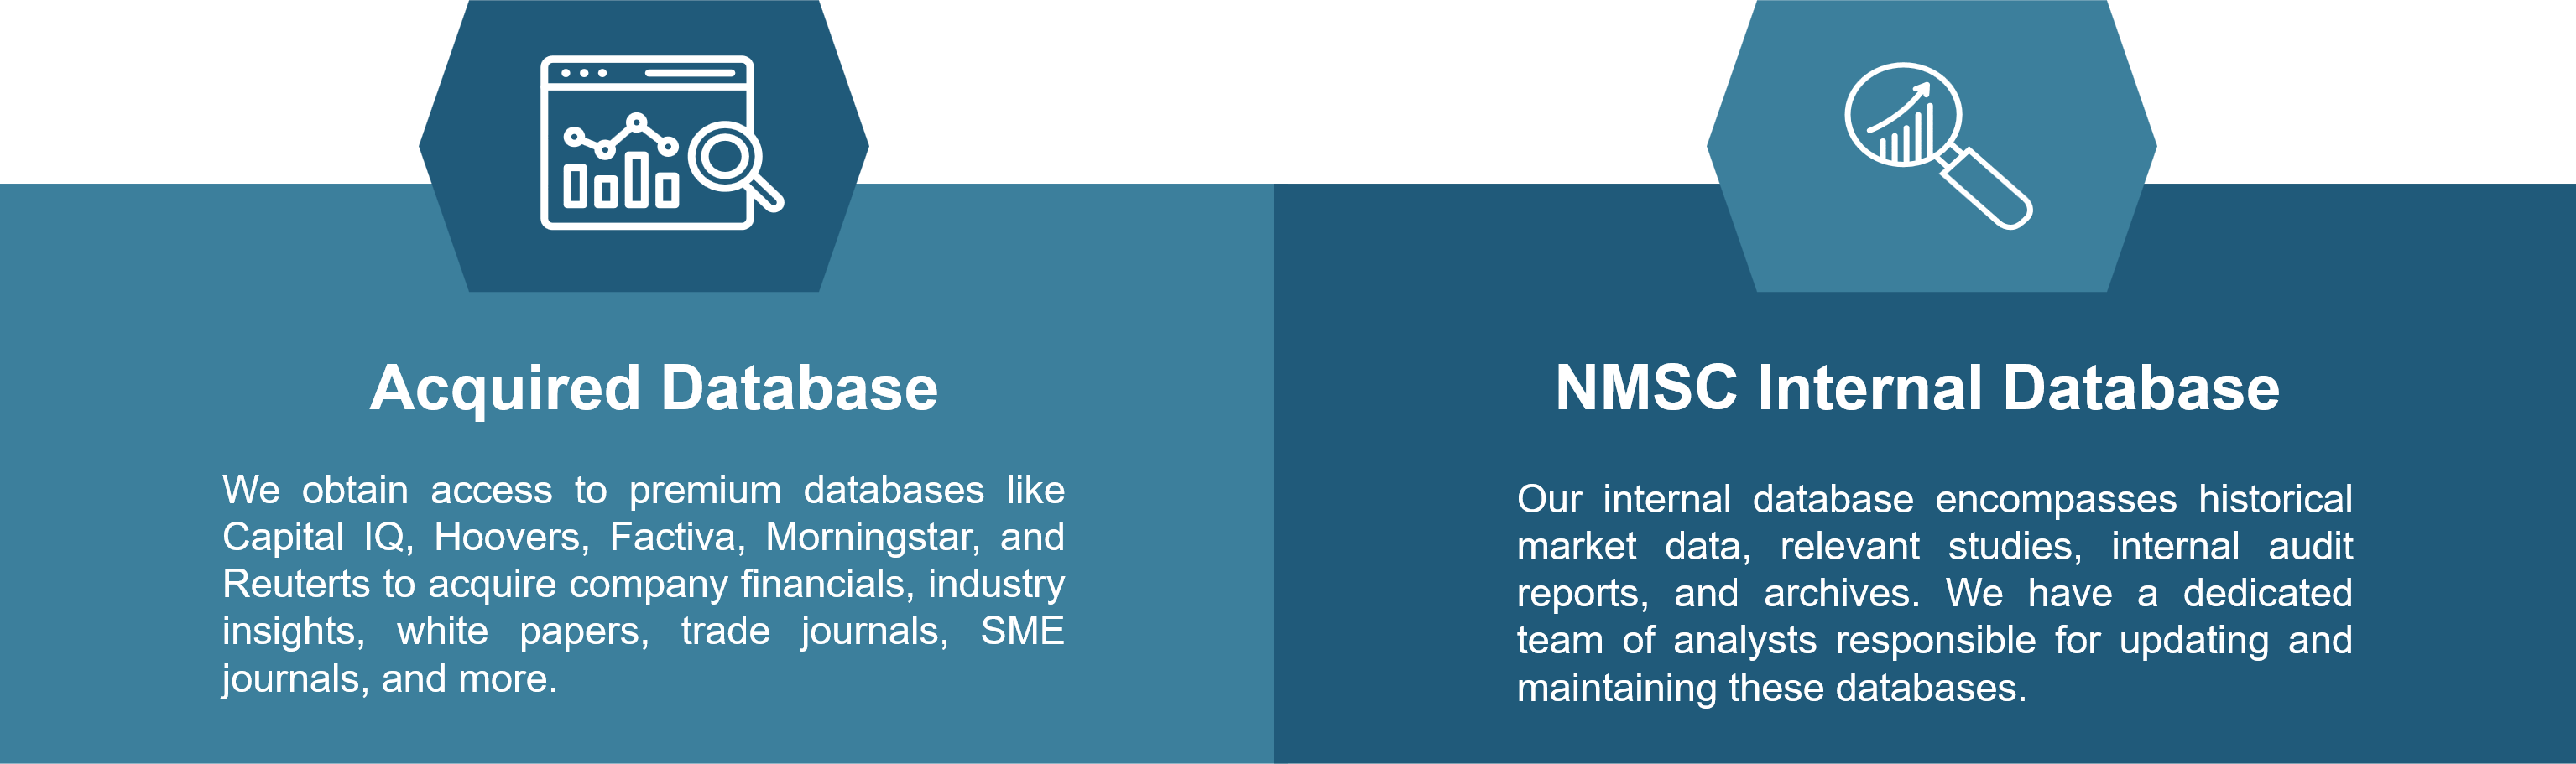
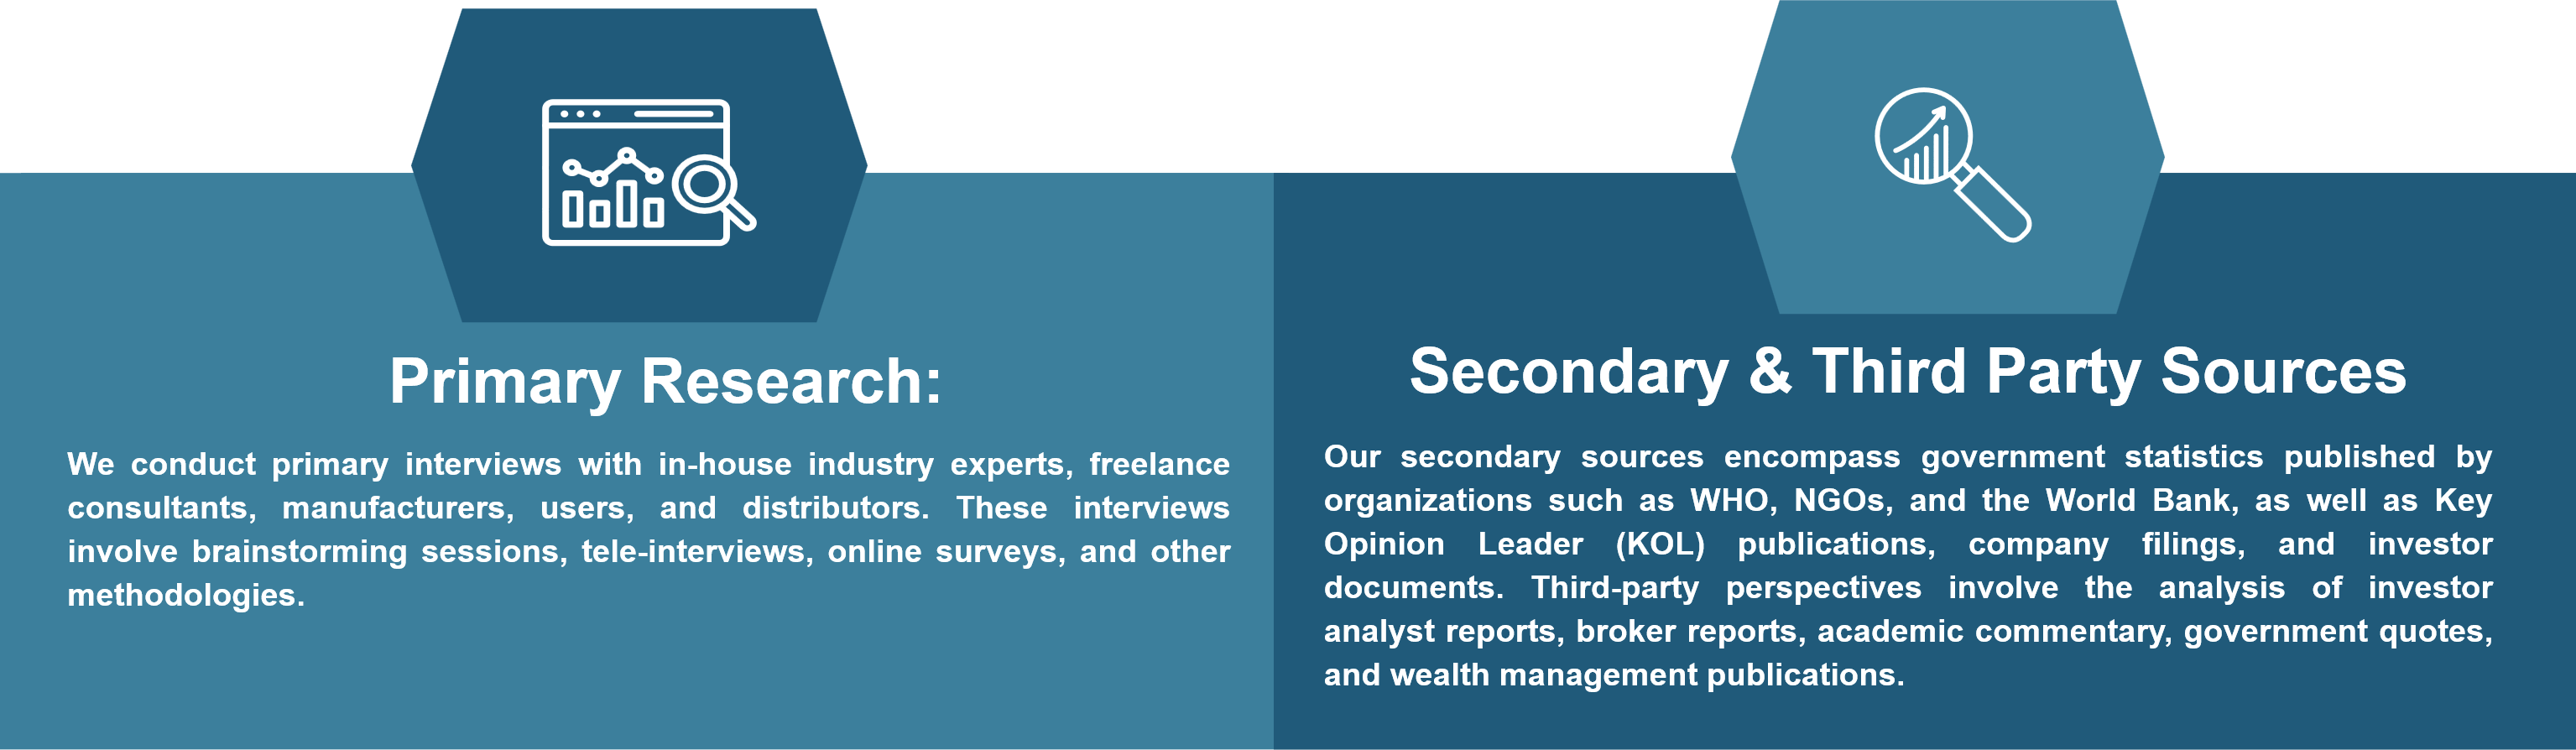
Information Procurement
The stage entails acquiring market data or relevant information through various sources and methodologies.
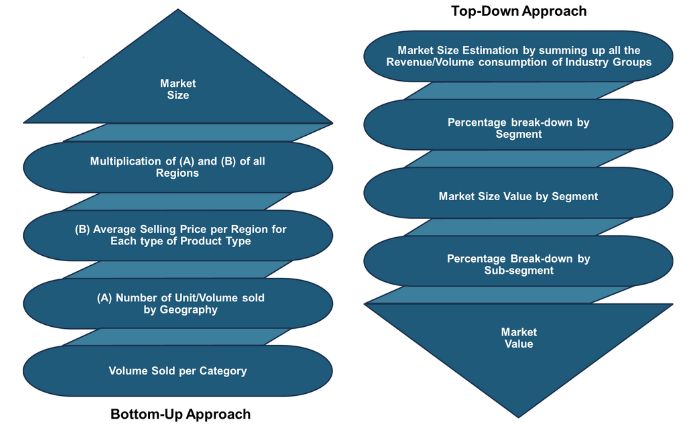
Market Research Approach
We utilize both top-down and bottom-up approaches in market research analysis to achieve a comprehensive understanding of the market dynamics, leveraging the broad perspective of industry trends and macroeconomic factors alongside detailed insights from specific segments and individual companies.
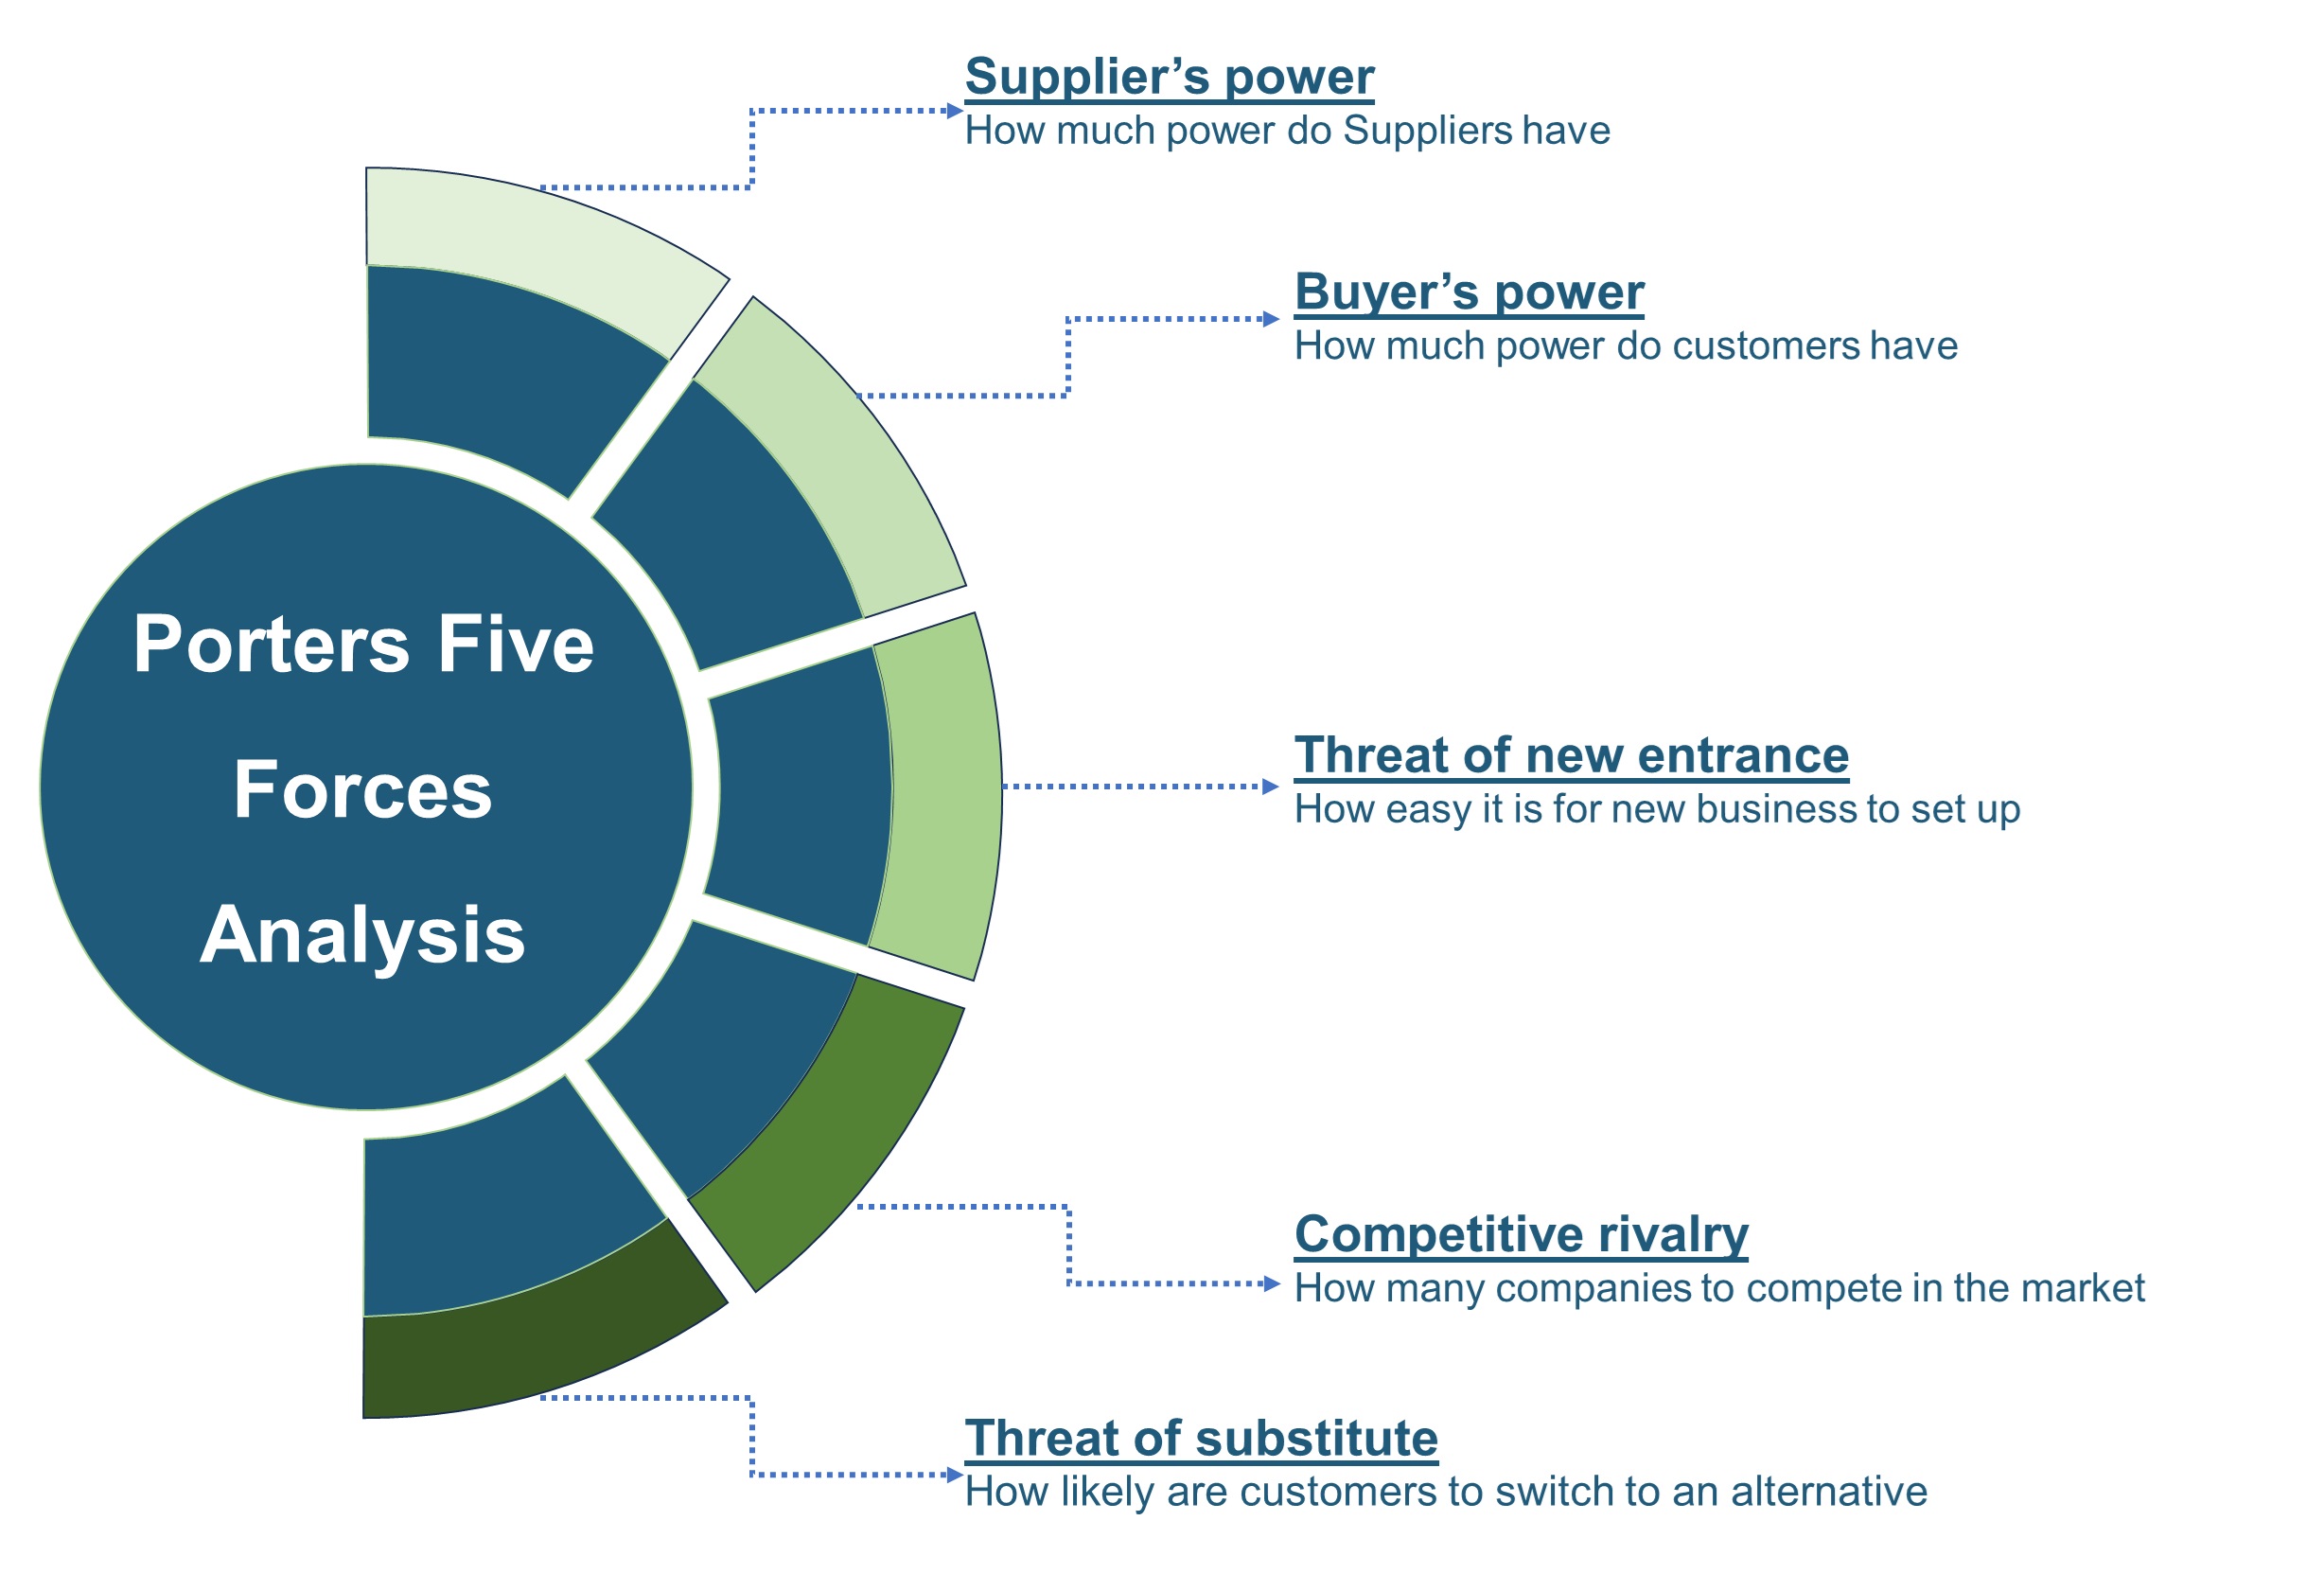
Porters Five Forces Analysis
We conduct Porter's Five Forces analysis to evaluate the competitive landscape of an industry, providing us with insights into factors that affect profitability and strategic positioning.
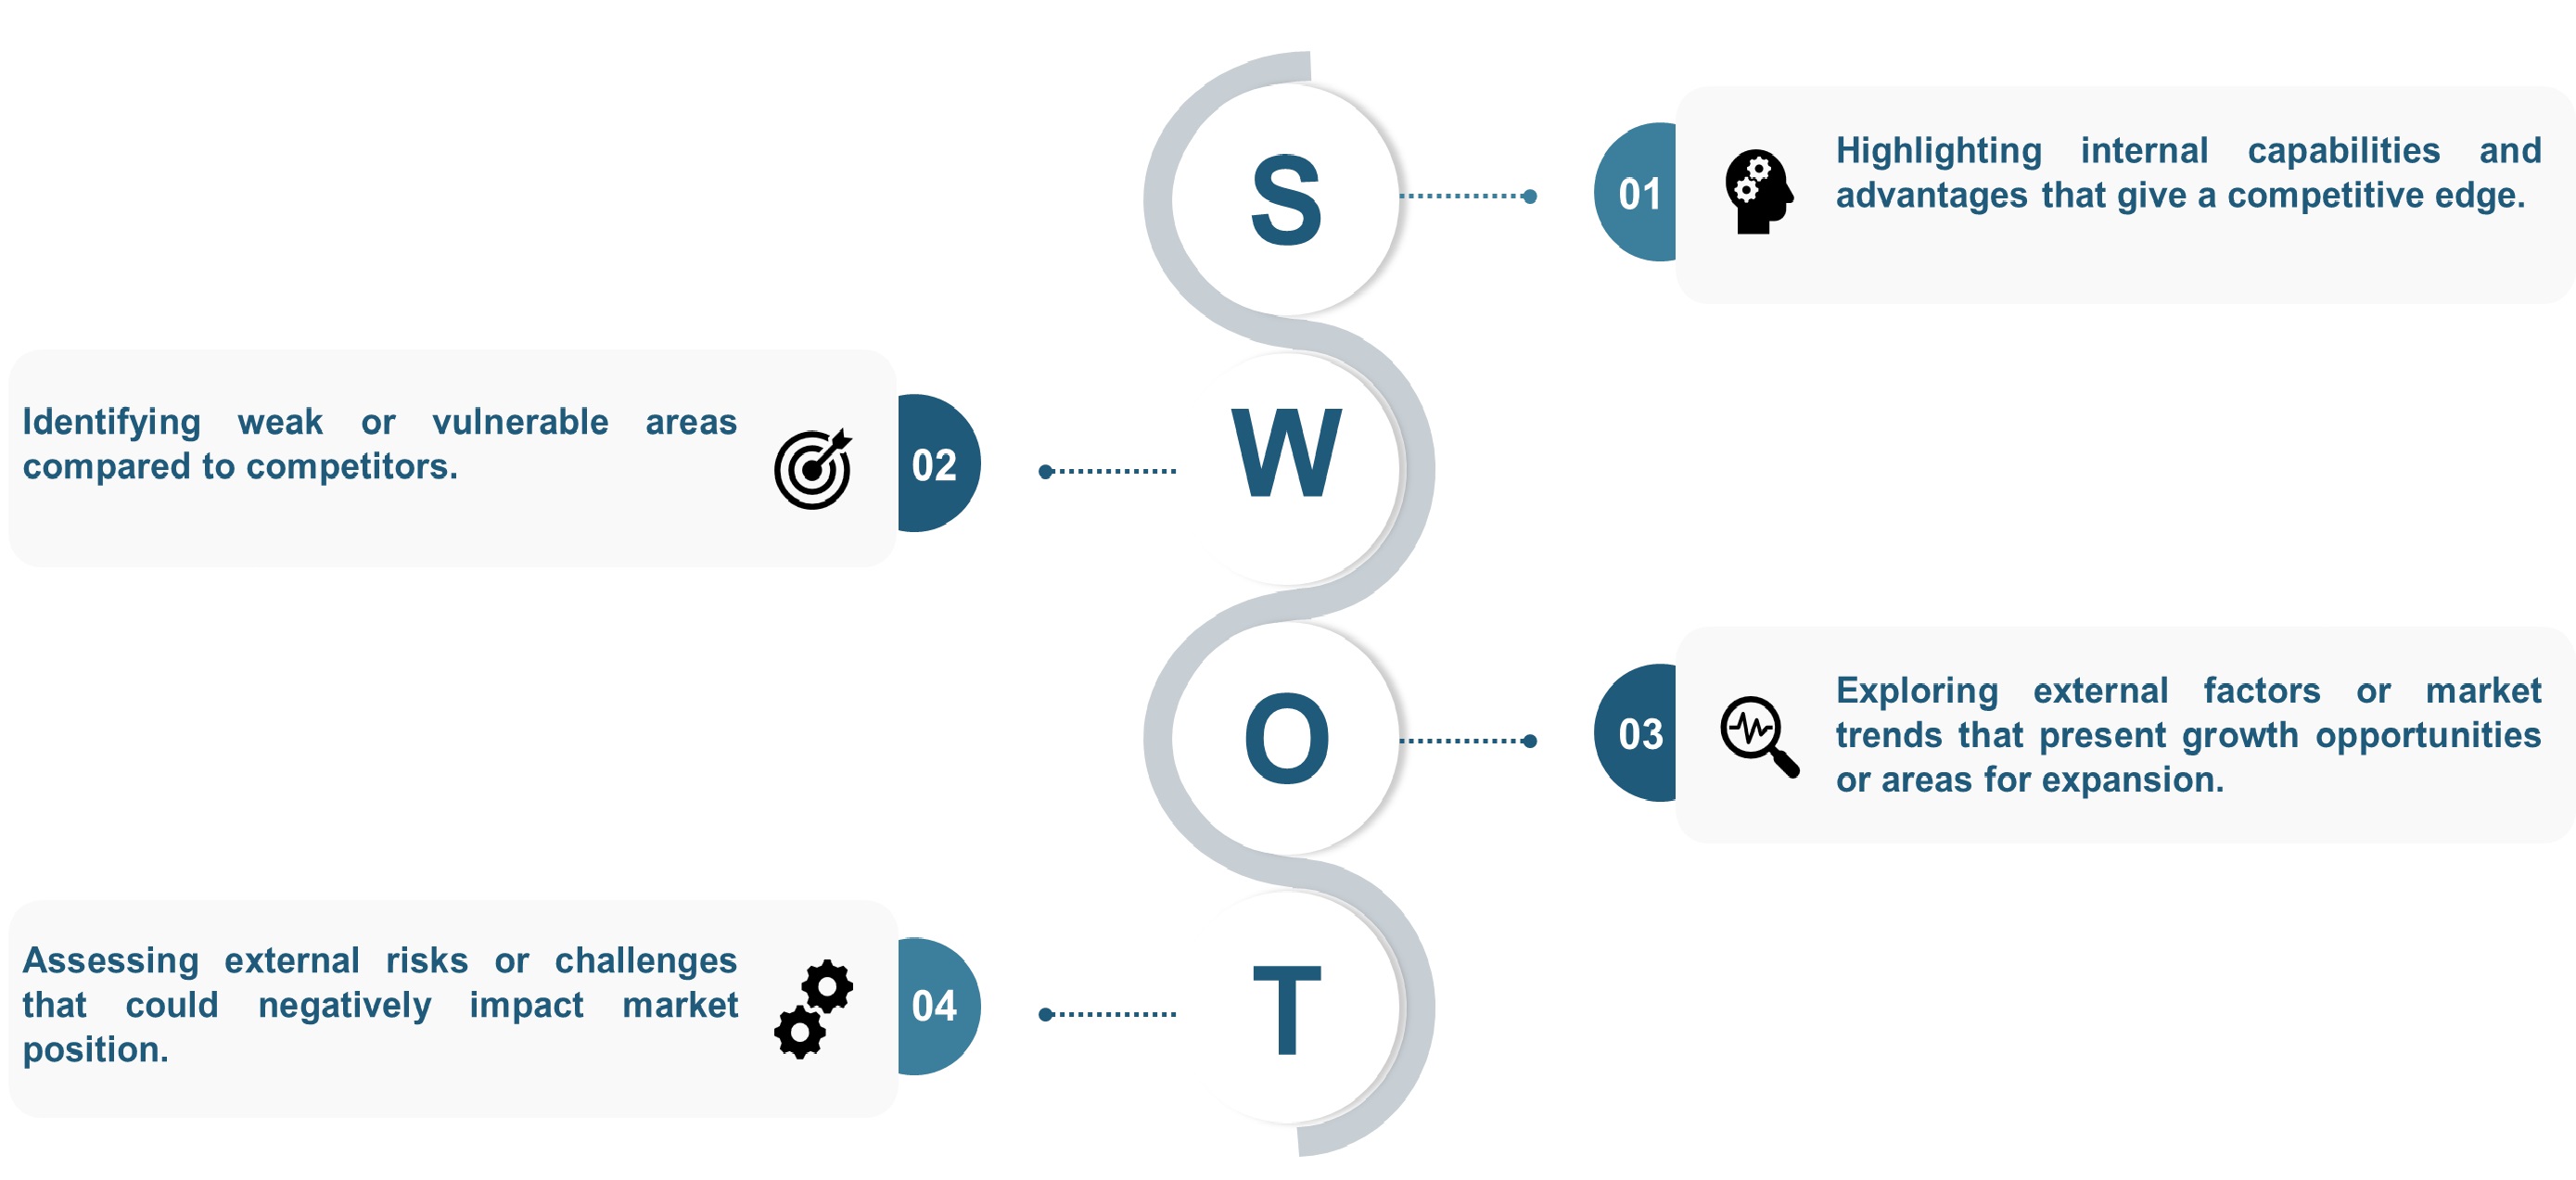
SWOT Analysis
We conduct SWOT analysis to understand market trends, identify potential threats, capitalize on opportunities, and assess our strengths and weaknesses.
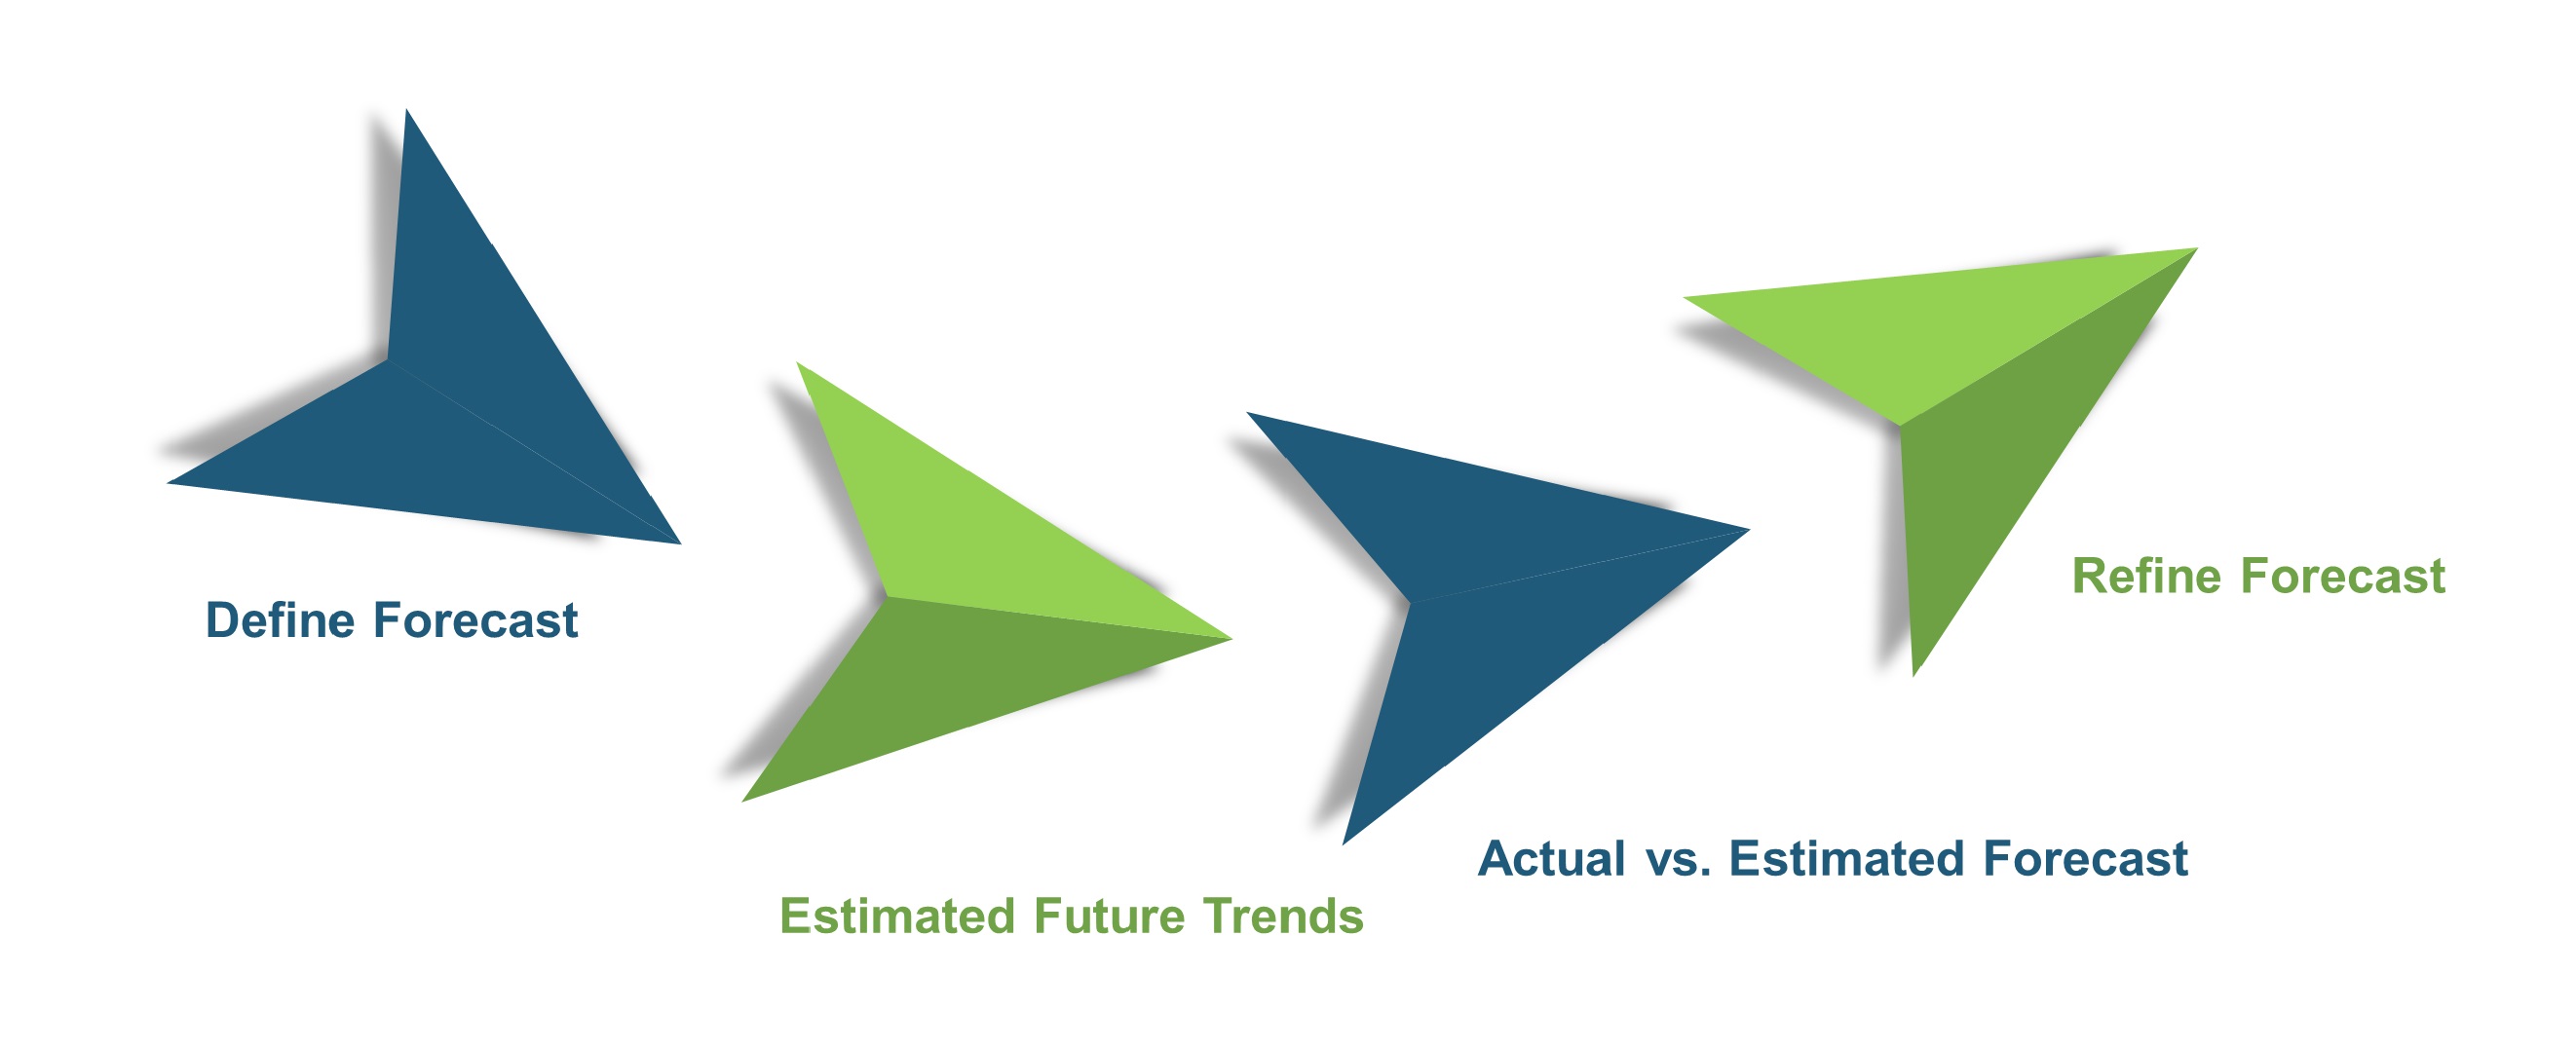
Forecasting
We utilize a forecasting model to predict future consumption by considering parameters like population, economics, regulations, market competition, drivers, constraints, technology, and pricing. We also employ statistical techniques such as multilinear regression, exponential smoothing, moving average, ARIMA, and Monte Carlo simulations for accurate predictions. In econometric forecasting, we analyzed short-term and long-term event impacts, attributing values based on regulatory frameworks, economic factors, and market events.


 Speak to Our Analyst