Market")
The U.S. Air Handling Unit (AHU) Market by Component (Coils, Filters, Blowers/Fans, and Humidifiers), by Product Type (Packaged AHUs, Modular AHUs, and Custom AHUs), by Installation (Rooftop, and Indoor), by Capacity (≤ 5,000 m³/h, 5,001–15,000 m³/h, 15,001–30,000 m³/h, 30,001–50,000 m³/h and ≥ 50,001 m³/h), by Technology (Single Flux, Double Flux, and Smart AHUs), by Application (Residential, Commercial, and Industrial)- Opportunity Analysis and Industry Forecast, 2024– 2030.
Industry: Construction & Manufacturing | Publish Date: 21-Aug-2025 | No of Pages: 110 | No. of Tables: 77 | No. of Figures: 42 | Format: PDF | Report Code : CM1608
Market Definition
The U.S. Air Handling Unit (AHU) Market size was valued at USD 3.12 billion in 2023, and is predicted to reach USD 4.40 billion by 2030, at a CAGR of 4.5% from 2024 to 2030.
The air handling unit (AHU), also known as air handler, is a fundamental component in heating, ventilation, and air conditioning (HVAC) systems, facilitating efficient airflow regulation and indoor climate control across commercial, industrial, and residential sectors. It collects air from the outside and inside, removes dust and other particles from the collected air, adjusts temperature and humidity, and then supplies clean and conditioned air in the room through ducts.
Growing Adoption of Energy-efficient and Intelligent Hvac Systems Driving Ahu Demand
A significant driver shaping the U.S. AHU market is the increasing emphasis on energy-efficient and intelligent building solutions. With stricter energy codes, rising operational costs, and growing environmental concerns, there is a clear shift toward HVAC systems that deliver optimal performance while minimizing energy usage. Air handling units equipped with advanced features—such as energy recovery ventilators (ERVs), variable frequency drives (VFDs), and demand-controlled ventilation—are becoming the standard in both new construction and retrofit projects.
Additionally, the integration of smart technologies such as IoT sensors and building automation systems is transforming traditional AHUs into intelligent units capable of real-time monitoring, predictive maintenance, and adaptive control. This not only improves energy efficiency but also enhances occupant comfort and system longevity. As building owners and developers aim for certifications like LEED and ENERGY STAR, the demand for high-efficiency, data-driven AHU solutions continues to surge across commercial offices, healthcare facilities, educational campuses, and large residential complexes.
Accelerated Expansion of Data Center Infrastructure Fueling Specialized Ahu Deployment
The rapid growth of data-driven technologies—such as artificial intelligence, cloud computing, and edge networks—has led to a nationwide boom in data center construction and expansion. These facilities require precise, reliable, and uninterrupted environmental control to maintain server performance and prevent thermal failure. AHUs serve as a critical component in these HVAC ecosystems, ensuring optimal air temperature, humidity, and cleanliness in high-density computing environments.
Unlike conventional applications, data centers demand custom-engineered AHUs with features such as redundant cooling circuits, filtration for airborne contaminants, and real-time monitoring capabilities. As hyperscale and colocation data centers expand across major U.S. hubs, the need for scalable, efficient, and technically advanced AHUs continues to grow. This trend positions AHU manufacturers to benefit significantly from the digital infrastructure boom, with demand driven by both new builds and the upgrading of legacy cooling systems.
Supply Chain Disruptions and Volatile Raw Material Prices Impede Manufacturing Operations
One of the key restraints impacting the growth of the U.S. AHU market is the ongoing volatility in raw material prices and persistent supply chain disruptions. The manufacturing of air handling units depends heavily on materials such as galvanized steel, aluminum, copper, and insulation components, all of which have seen significant price fluctuations in recent years due to global economic instability, trade uncertainties, and climate-related disruptions.
Furthermore, logistical bottlenecks—including delays at ports, shortages in skilled labor, and inconsistent availability of critical components like electronic controls and fan motors—have disrupted production timelines and increased lead times for AHU deployment. These challenges not only escalate production costs but also create uncertainty for OEMs, contractors, and end-users. For large-scale projects, such delays can result in project overruns and compromised operational planning, making stakeholders more cautious about investments in complex HVAC systems.
As a result, even as demand rises, the AHU market faces significant pressure from unpredictable supply dynamics, making it harder for manufacturers to maintain pricing competitiveness and delivery reliability in a cost-sensitive market environment.
Emerging Demand for Modular and Retrofit-friendly Ahus in Aging Buildings
A key emerging opportunity in the U.S. AHU market is the rising demand for modular and retrofit-compatible units, especially in aging commercial and institutional buildings. Many facilities—such as schools, offices, and healthcare centers—require HVAC upgrades but face space limitations and budget constraints that make full system replacements impractical.
Modular AHUs offer flexible configurations, compact footprints, and easier installation in confined spaces. Retrofit-friendly designs enable seamless integration with existing infrastructure, reducing downtime and installation costs. As building owners seek efficient, low-disruption upgrades, demand for these tailored AHU solutions is accelerating, opening new growth avenues for manufacturers focused on retrofit applications
Competitive Landscape
The market players operating in the U.S. Air Handling Unit (AHU) market include Daikin Applied Americas, Inc., Carrier Global Corporation, Trane Technologies Plc, Johnson Controls International Plc, Lennox International Inc., AAON, Inc., Rheem Manufacturing Company, Nortek Global HVAC, Inc., Systemair AB, Munters Corporation, Modine Manufacturing Company, Vertiv Holdings Co., Air Innovations, Inc., ClimateCraft, Inc., Engineered Air Corporation, Safeaire, Inc., Haakon Industries, Inc.,Annexair Inc., Data Aire, Inc.,CaptiveAire Systems, Inc., and others.
The U.S. Air Handling Unit (AHU) Market Key Segments
By Component
-
Coils
-
Filters
-
Blowers / Fans
-
Humidifiers
By Product Type
-
Packaged AHUs
-
Modular AHUs
-
Custom AHUs
By Installation
-
Rooftop
-
Indoor
By Capacity
-
≤ 5,000 m³/h
-
5,001–15,000 m³/h
-
15,001–30,000 m³/h
-
30,001–50,000 m³/h
-
≥ 50,001 m³/h
By Technology
-
Single Flux (Single-Effect)
-
Double Flux (Energy Recovery)
-
Smart AHUs
By Application
-
Residential
-
Commercial
-
Offices
-
Malls
-
Hotels
-
Airports
-
Other Commercial
-
-
Industrial
-
Healthcare
-
Data Centers
-
Food & Beverage
-
Other Industrial
-
KEY PLAYERS
-
Daikin Applied Americas, Inc.
-
Carrier Global Corporation
-
Trane Technologies Plc
-
Johnson Controls International Plc
-
Lennox International Inc.
-
AAON, Inc.
-
Rheem Manufacturing Company
-
Nortek Global HVAC, Inc.
-
Systemair AB
-
Munters Corporation
-
Modine Manufacturing Company
-
Vertiv Holdings Co.
-
Air Innovations, Inc.
-
ClimateCraft, Inc.
-
Engineered Air Corporation
-
Safeaire, Inc.
-
Haakon Industries, Inc.
-
Annexair Inc.
-
Data Aire, Inc.
-
CaptiveAire Systems, Inc.
REPORT SCOPE AND SEGMENTATION:
|
Parameters |
Details |
|
Market Size in 2023 |
USD 3.12 Billion |
|
Revenue Forecast in 2030 |
USD 4.40 Billion |
|
Growth Rate |
CAGR of 4.5% from 2024 to 2030 |
|
Analysis Period |
2023–2030 |
|
Base Year Considered |
2023 |
|
Forecast Period |
2024–2030 |
|
Market Size Estimation |
Billion (USD) |
|
Growth Factors |
|
|
Companies Profiled |
20 |
|
Market Share |
Available for 10 companies |
|
Customization Scope |
Free customization (equivalent up to 80 working hours of analysts) after purchase. Addition or alteration to country, regional, and segment scope. |
|
Pricing and Purchase Options |
Avail customized purchase options to meet your exact research needs. |
 Market Revenue by 2030 (Billion USD)")
 Market Segmentation")
 Market Major Regions")
About the Author
 Jayanta Das is an industry analyst and writer with a keen focus on emerging technologies and sustainable business practices. With a background in engineering and market research, he brings analytical depth to topics like renewable energy, green manufacturing, and industrial transformation. Jayanta is passionate about translating complex data into actionable insights for businesses navigating the shift toward eco-conscious operations.
About the Reviewer
 Supradip Baul is an accomplished business consultant and strategist with over a decade of rich experience in market intelligence, strategy, technology and business transformation. His work has included rigorous qualitative and quantitative analysis across multiple industries, helping clients shape investment decisions and long-term roadmaps. Earlier in his career, he was associated with Gartner, where he contributed to industry-leading reports and market share analyses. He has worked with leading global companies and holds an MBA with a dual specialization in Marketing and Finance.
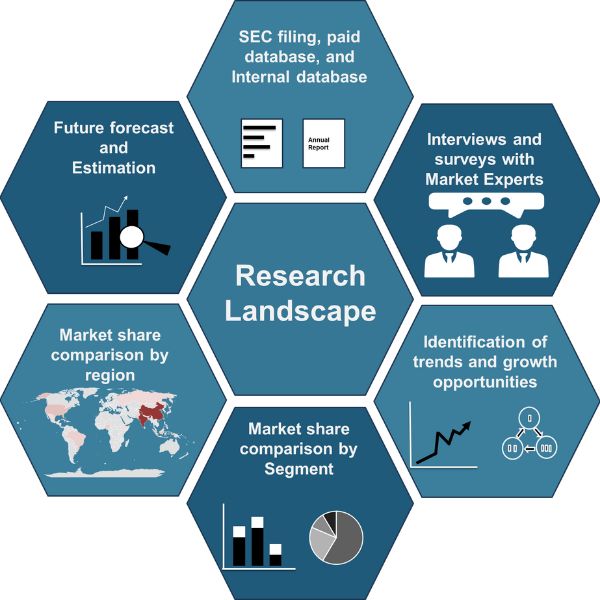
At Next Move Strategy Consulting, we understand that insightful market research is the cornerstone of successful business decisions. That's why we employ a robust and multifaceted approach, combining various methodologies to deliver the most accurate and actionable data for our clients.
Research Landscape
We navigate the world of research with two primary approaches:
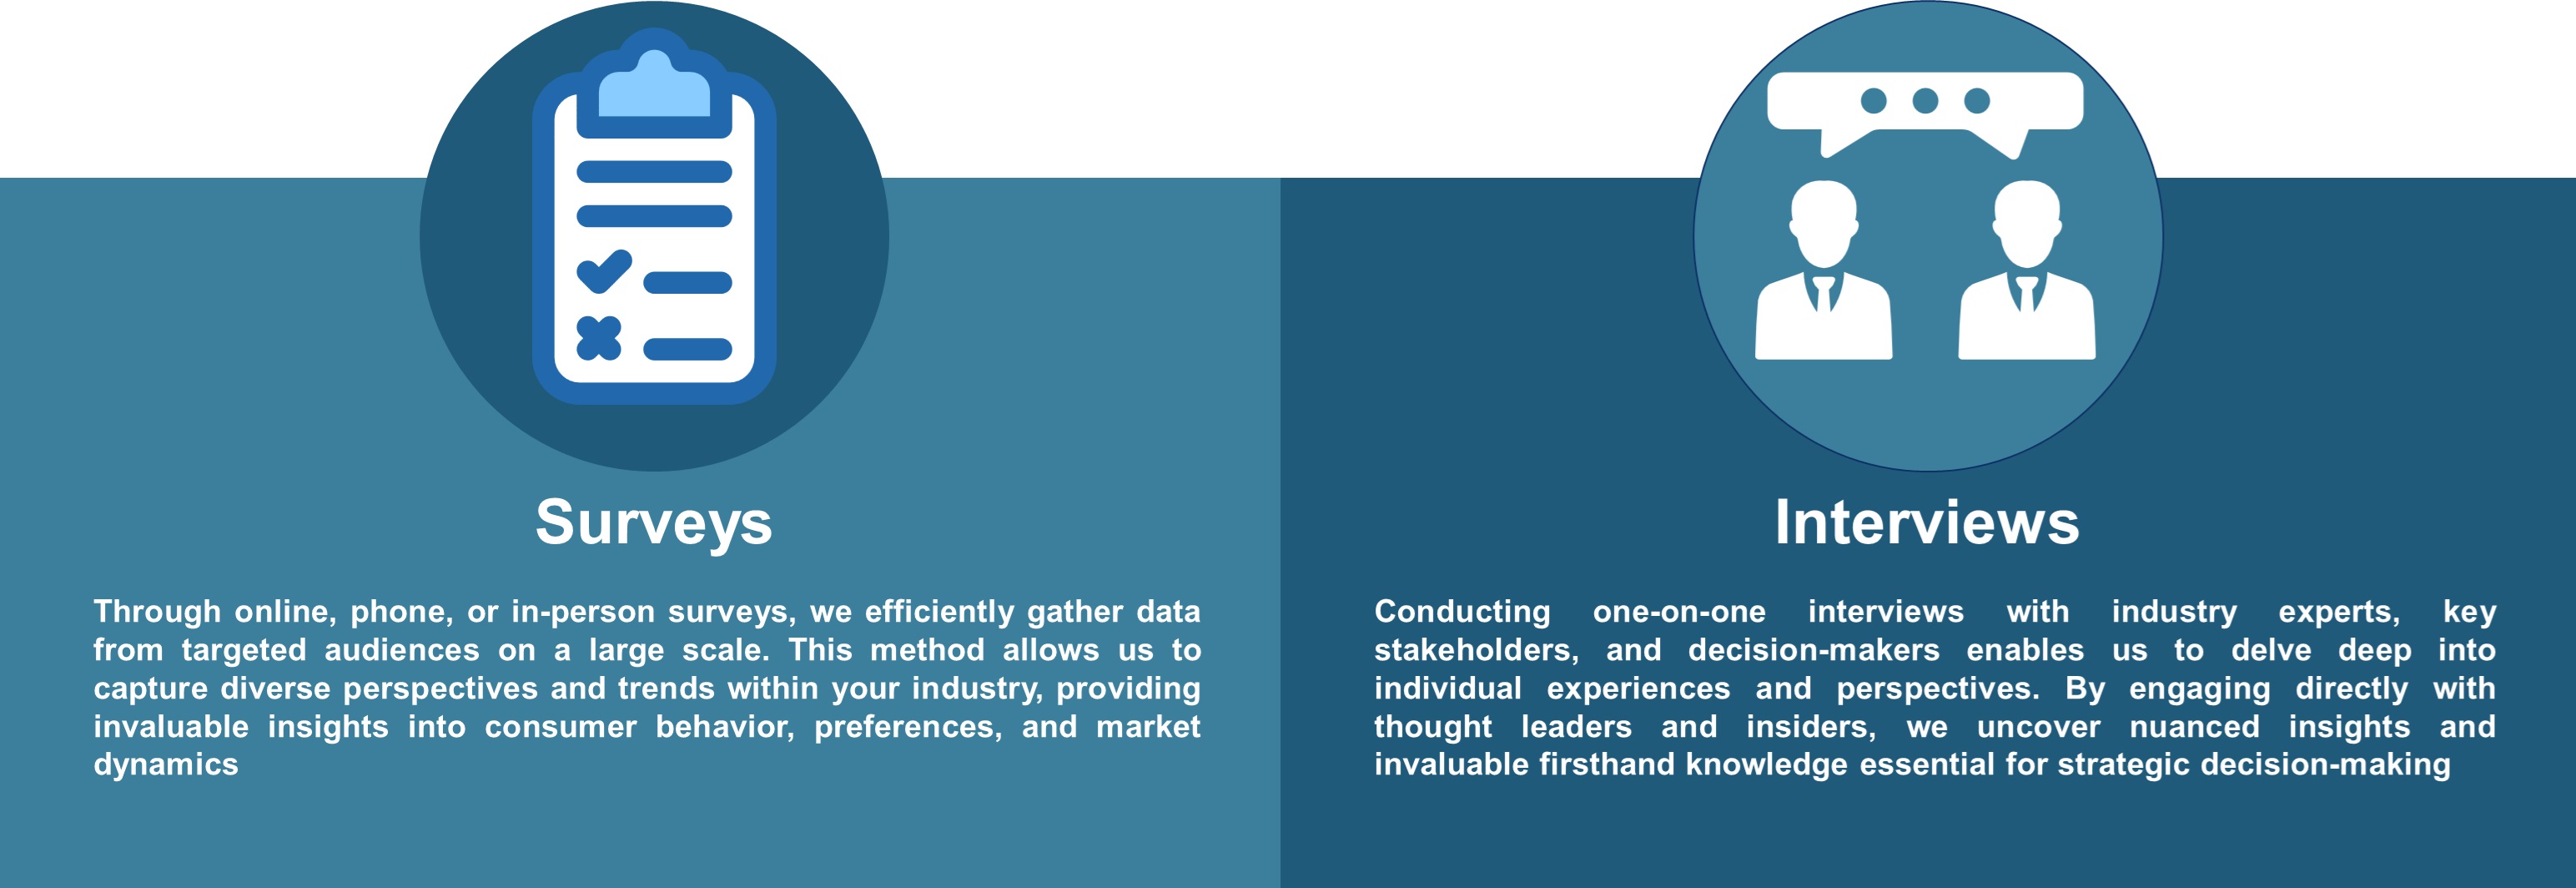
Qualitative Approach
Our qualitative research methodologies involve immersive techniques such as in-depth interviews, focus groups, and observational studies. By engaging directly with individuals and stakeholders, we uncover valuable insights that quantitative data alone may overlook.
Quantitative Research
In tandem with qualitative methodologies, NMSC leverages the power of Quantitative Research to provide a robust foundation of numerical insights. Through systematic data collection and analysis, we quantify patterns, preferences, and market trends, offering a comprehensive view of the business landscape.
Our quantitative research approach employs diverse tools, including surveys, experiments, and statistical modelling. These methodologies enable us to gather data from a large and representative sample, ensuring the statistical significance of our findings. By employing structured questionnaires and standardized data collection methods, we guarantee the reliability and validity of the information we present to our clients.
Quantitative research is particularly effective in measuring the prevalence of trends, assessing market size, and gauging the impact of various factors on consumer behavior. The numerical precision attained through this approach equips our clients with actionable insights, facilitating data-driven decision-making and strategy formulation.
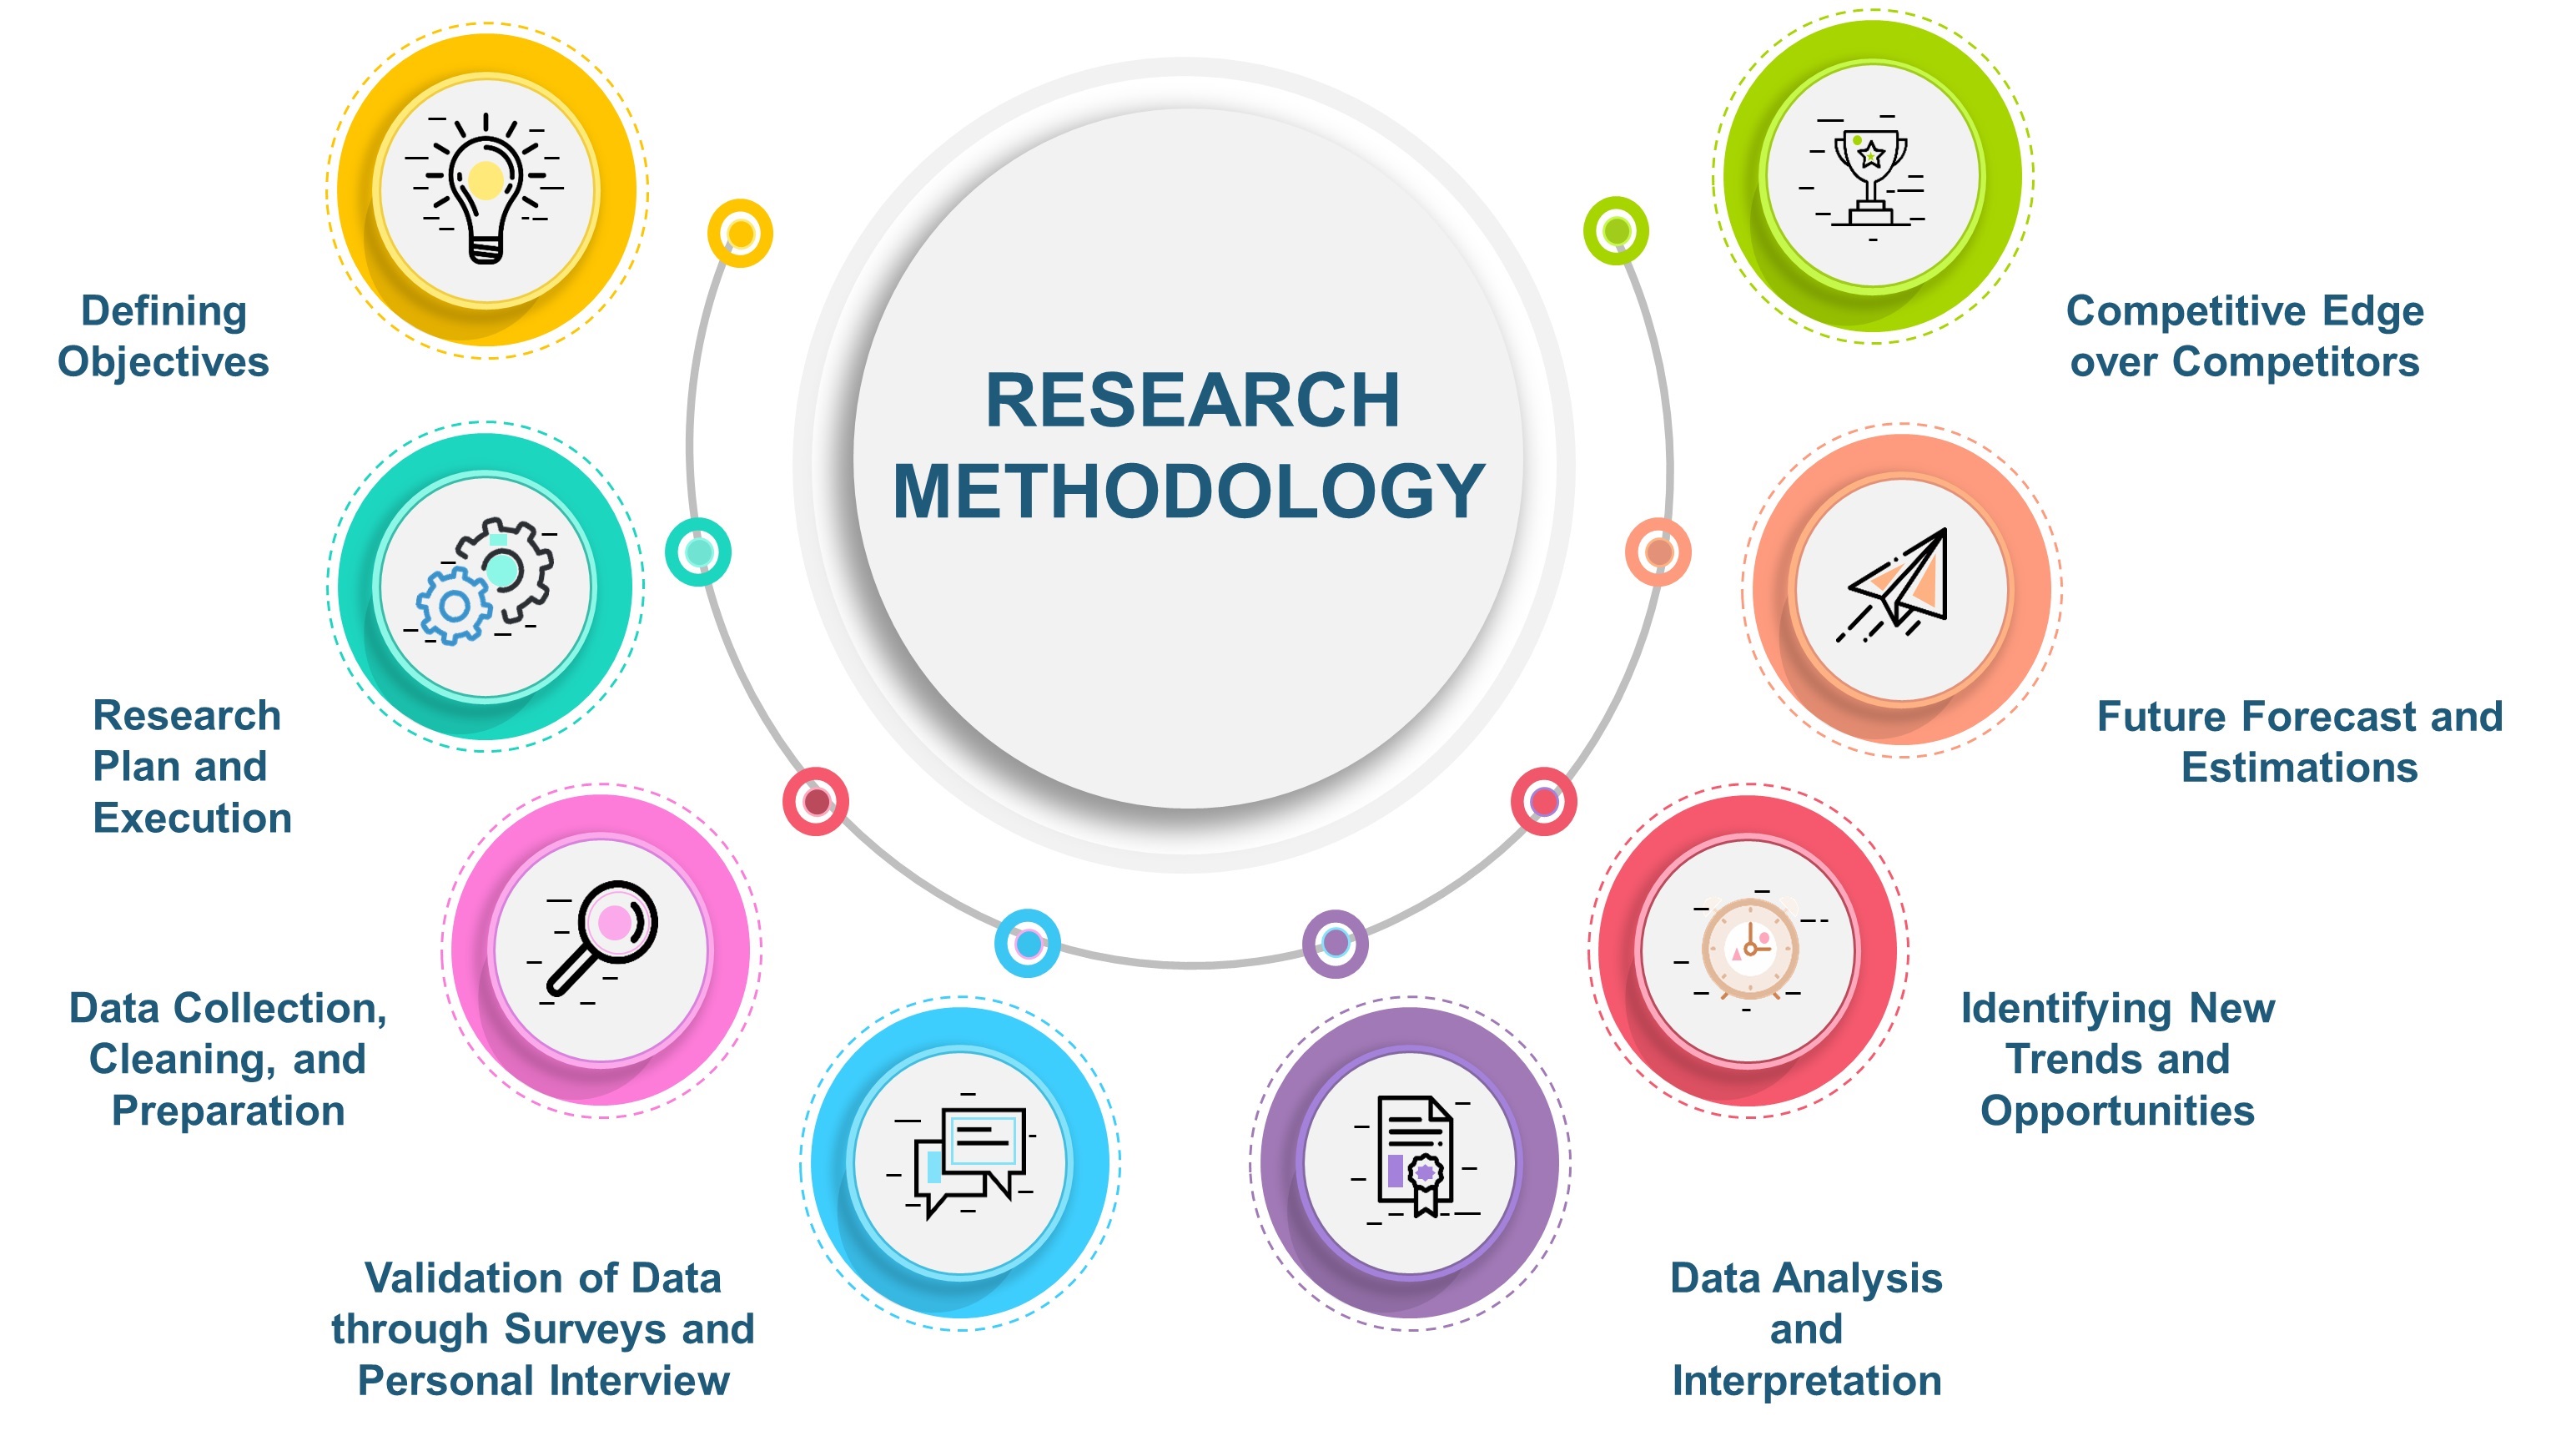
Our Specialized Toolbox for Industry-Specific Market Research
We deploy a specialized arsenal of techniques tailored to meet your unique requirements. Here's a glimpse into our comprehensive toolbox:
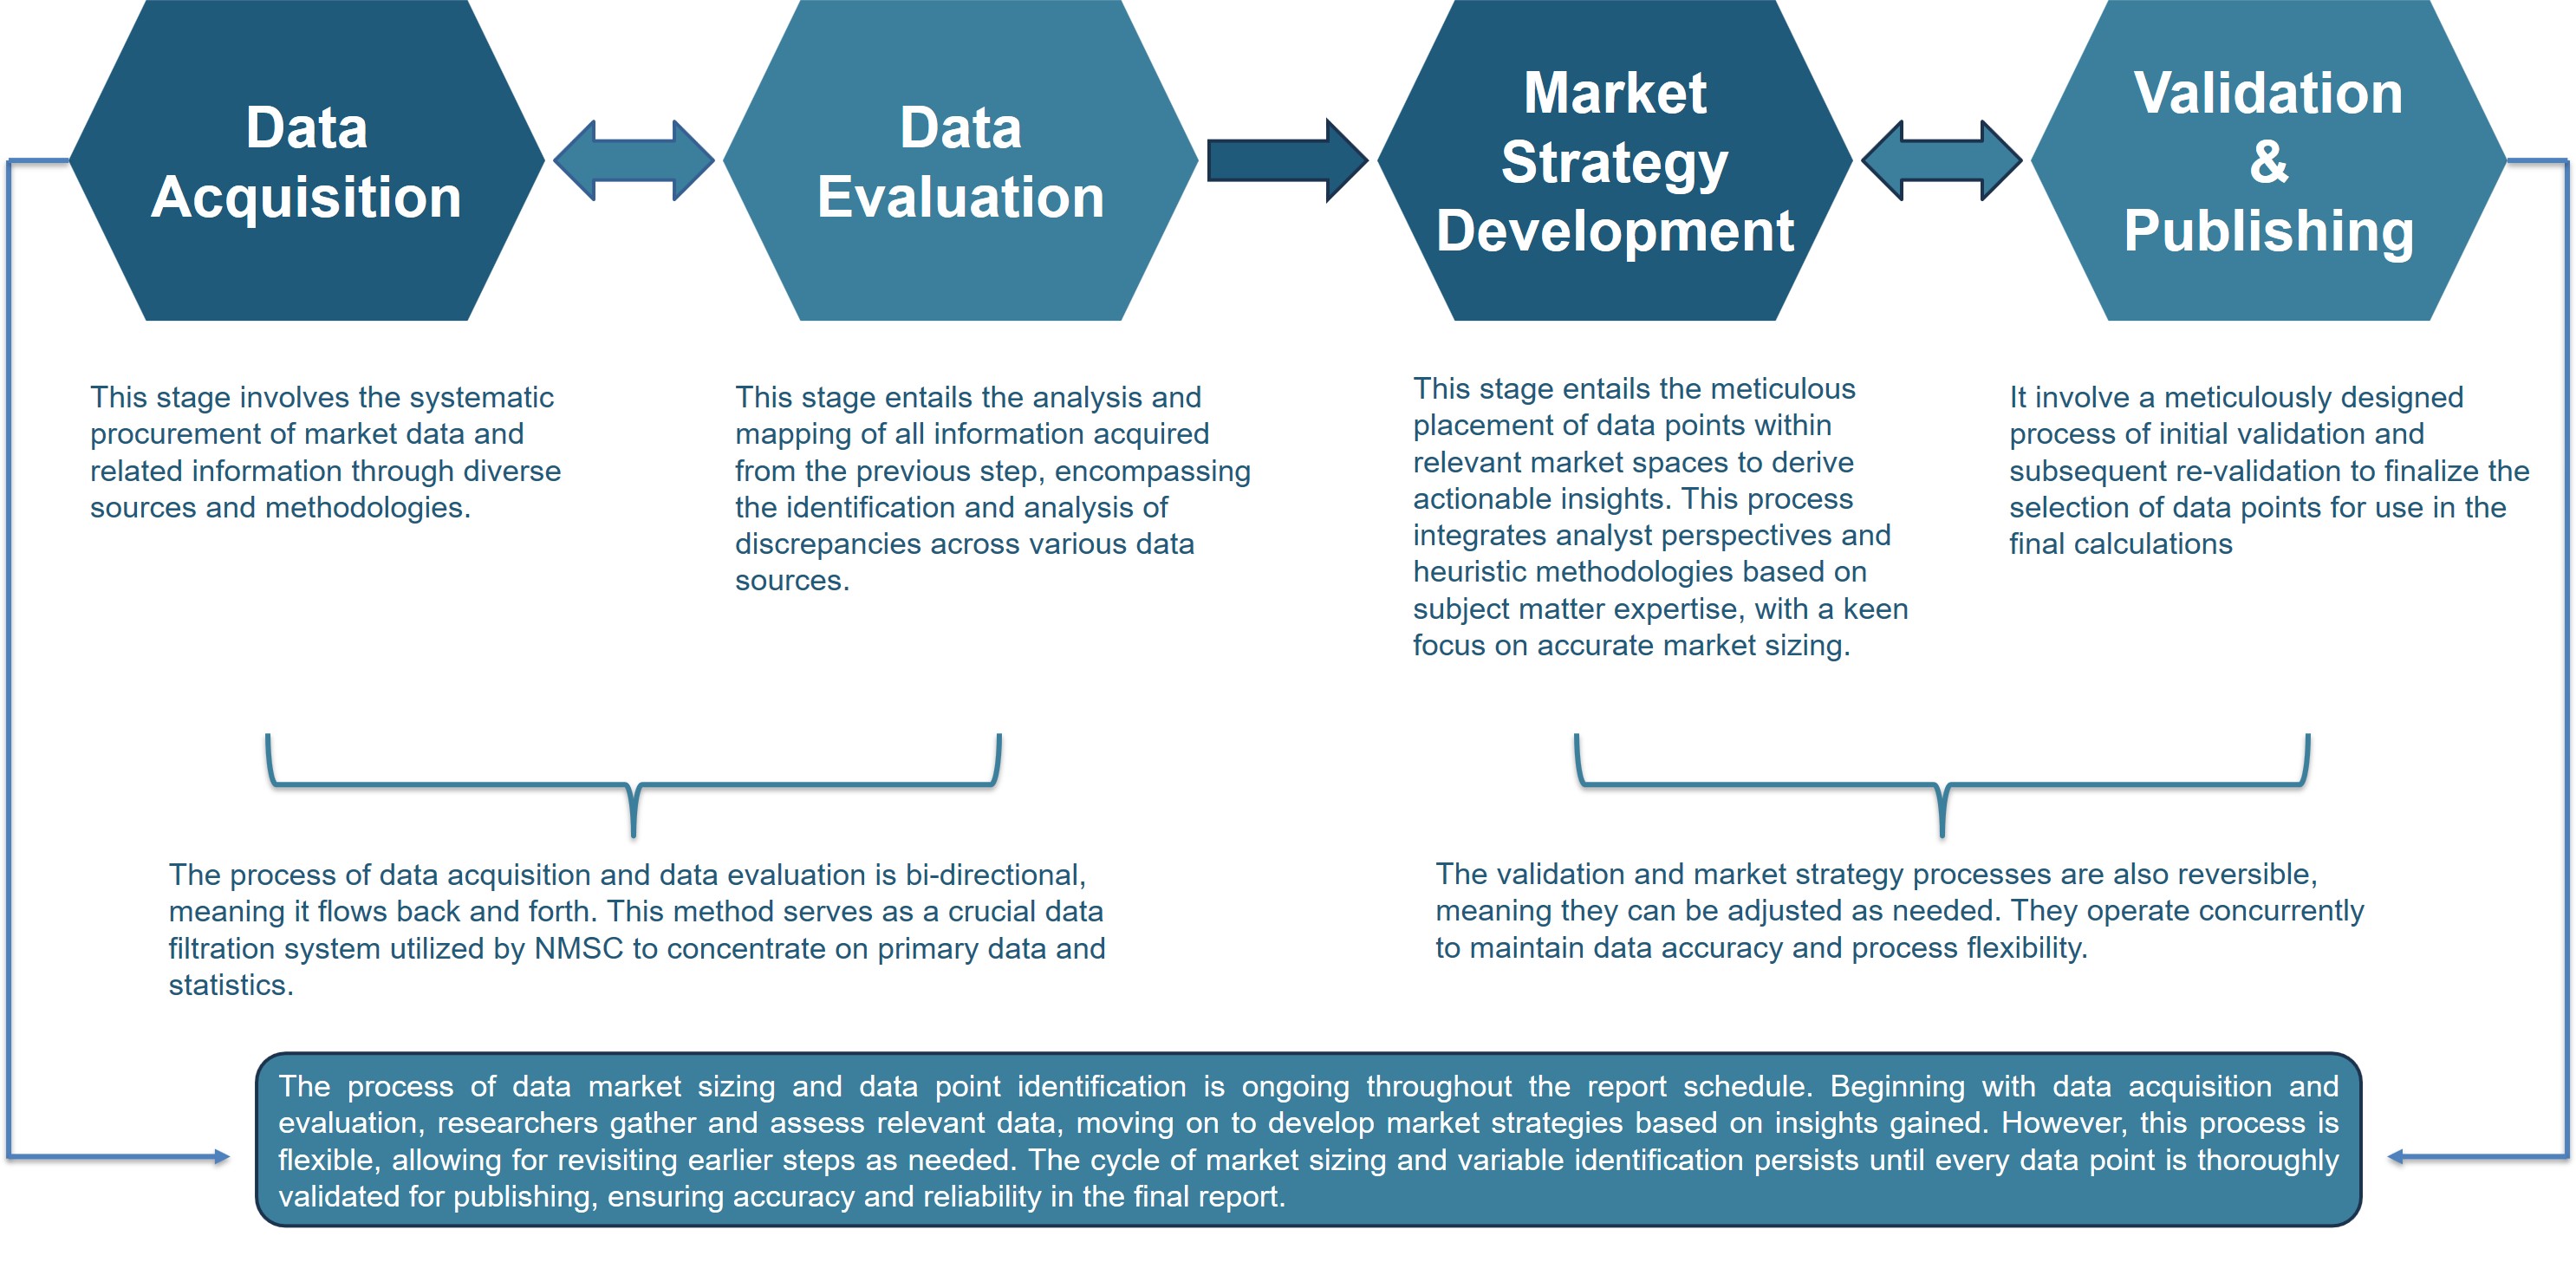
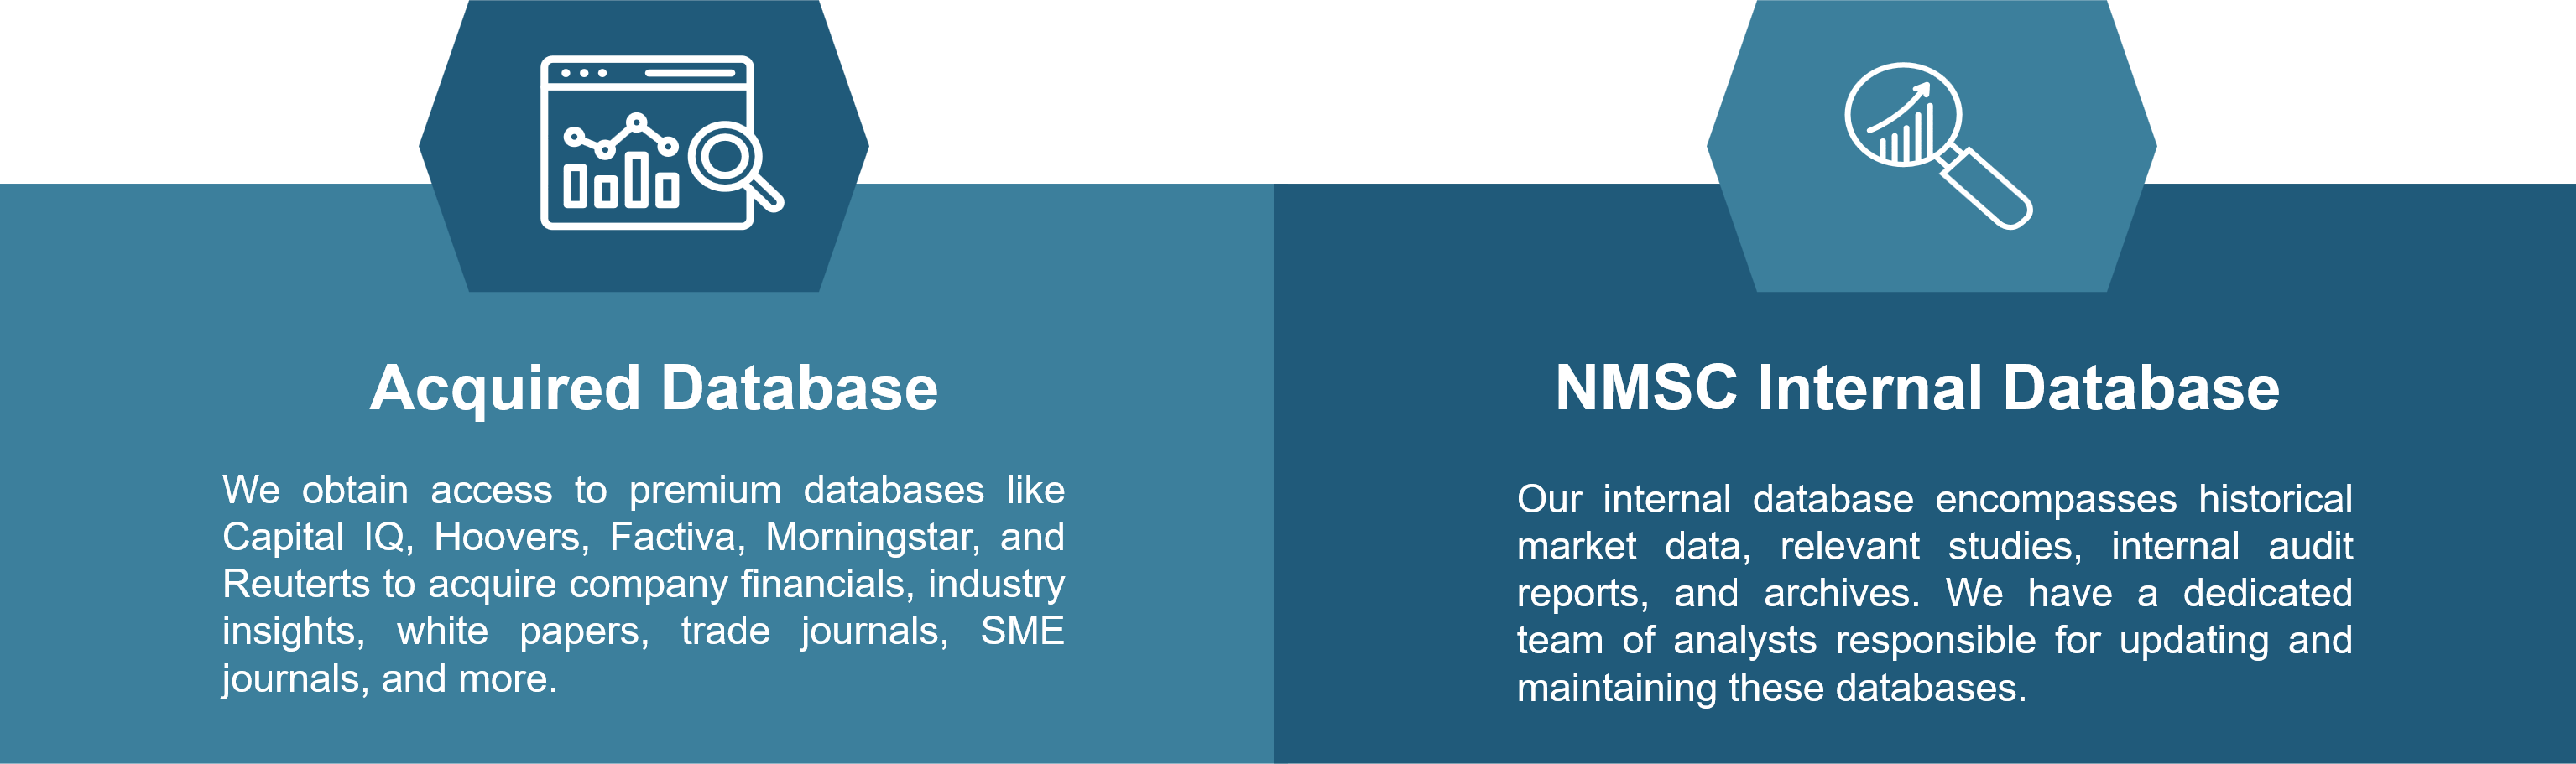
Information Procurement
The stage entails acquiring market data or relevant information through various sources and methodologies.

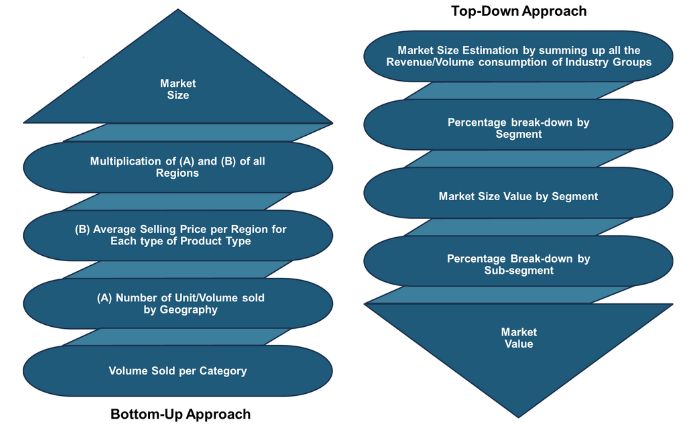
Market Research Approach
We utilize both top-down and bottom-up approaches in market research analysis to achieve a comprehensive understanding of the market dynamics, leveraging the broad perspective of industry trends and macroeconomic factors alongside detailed insights from specific segments and individual companies.
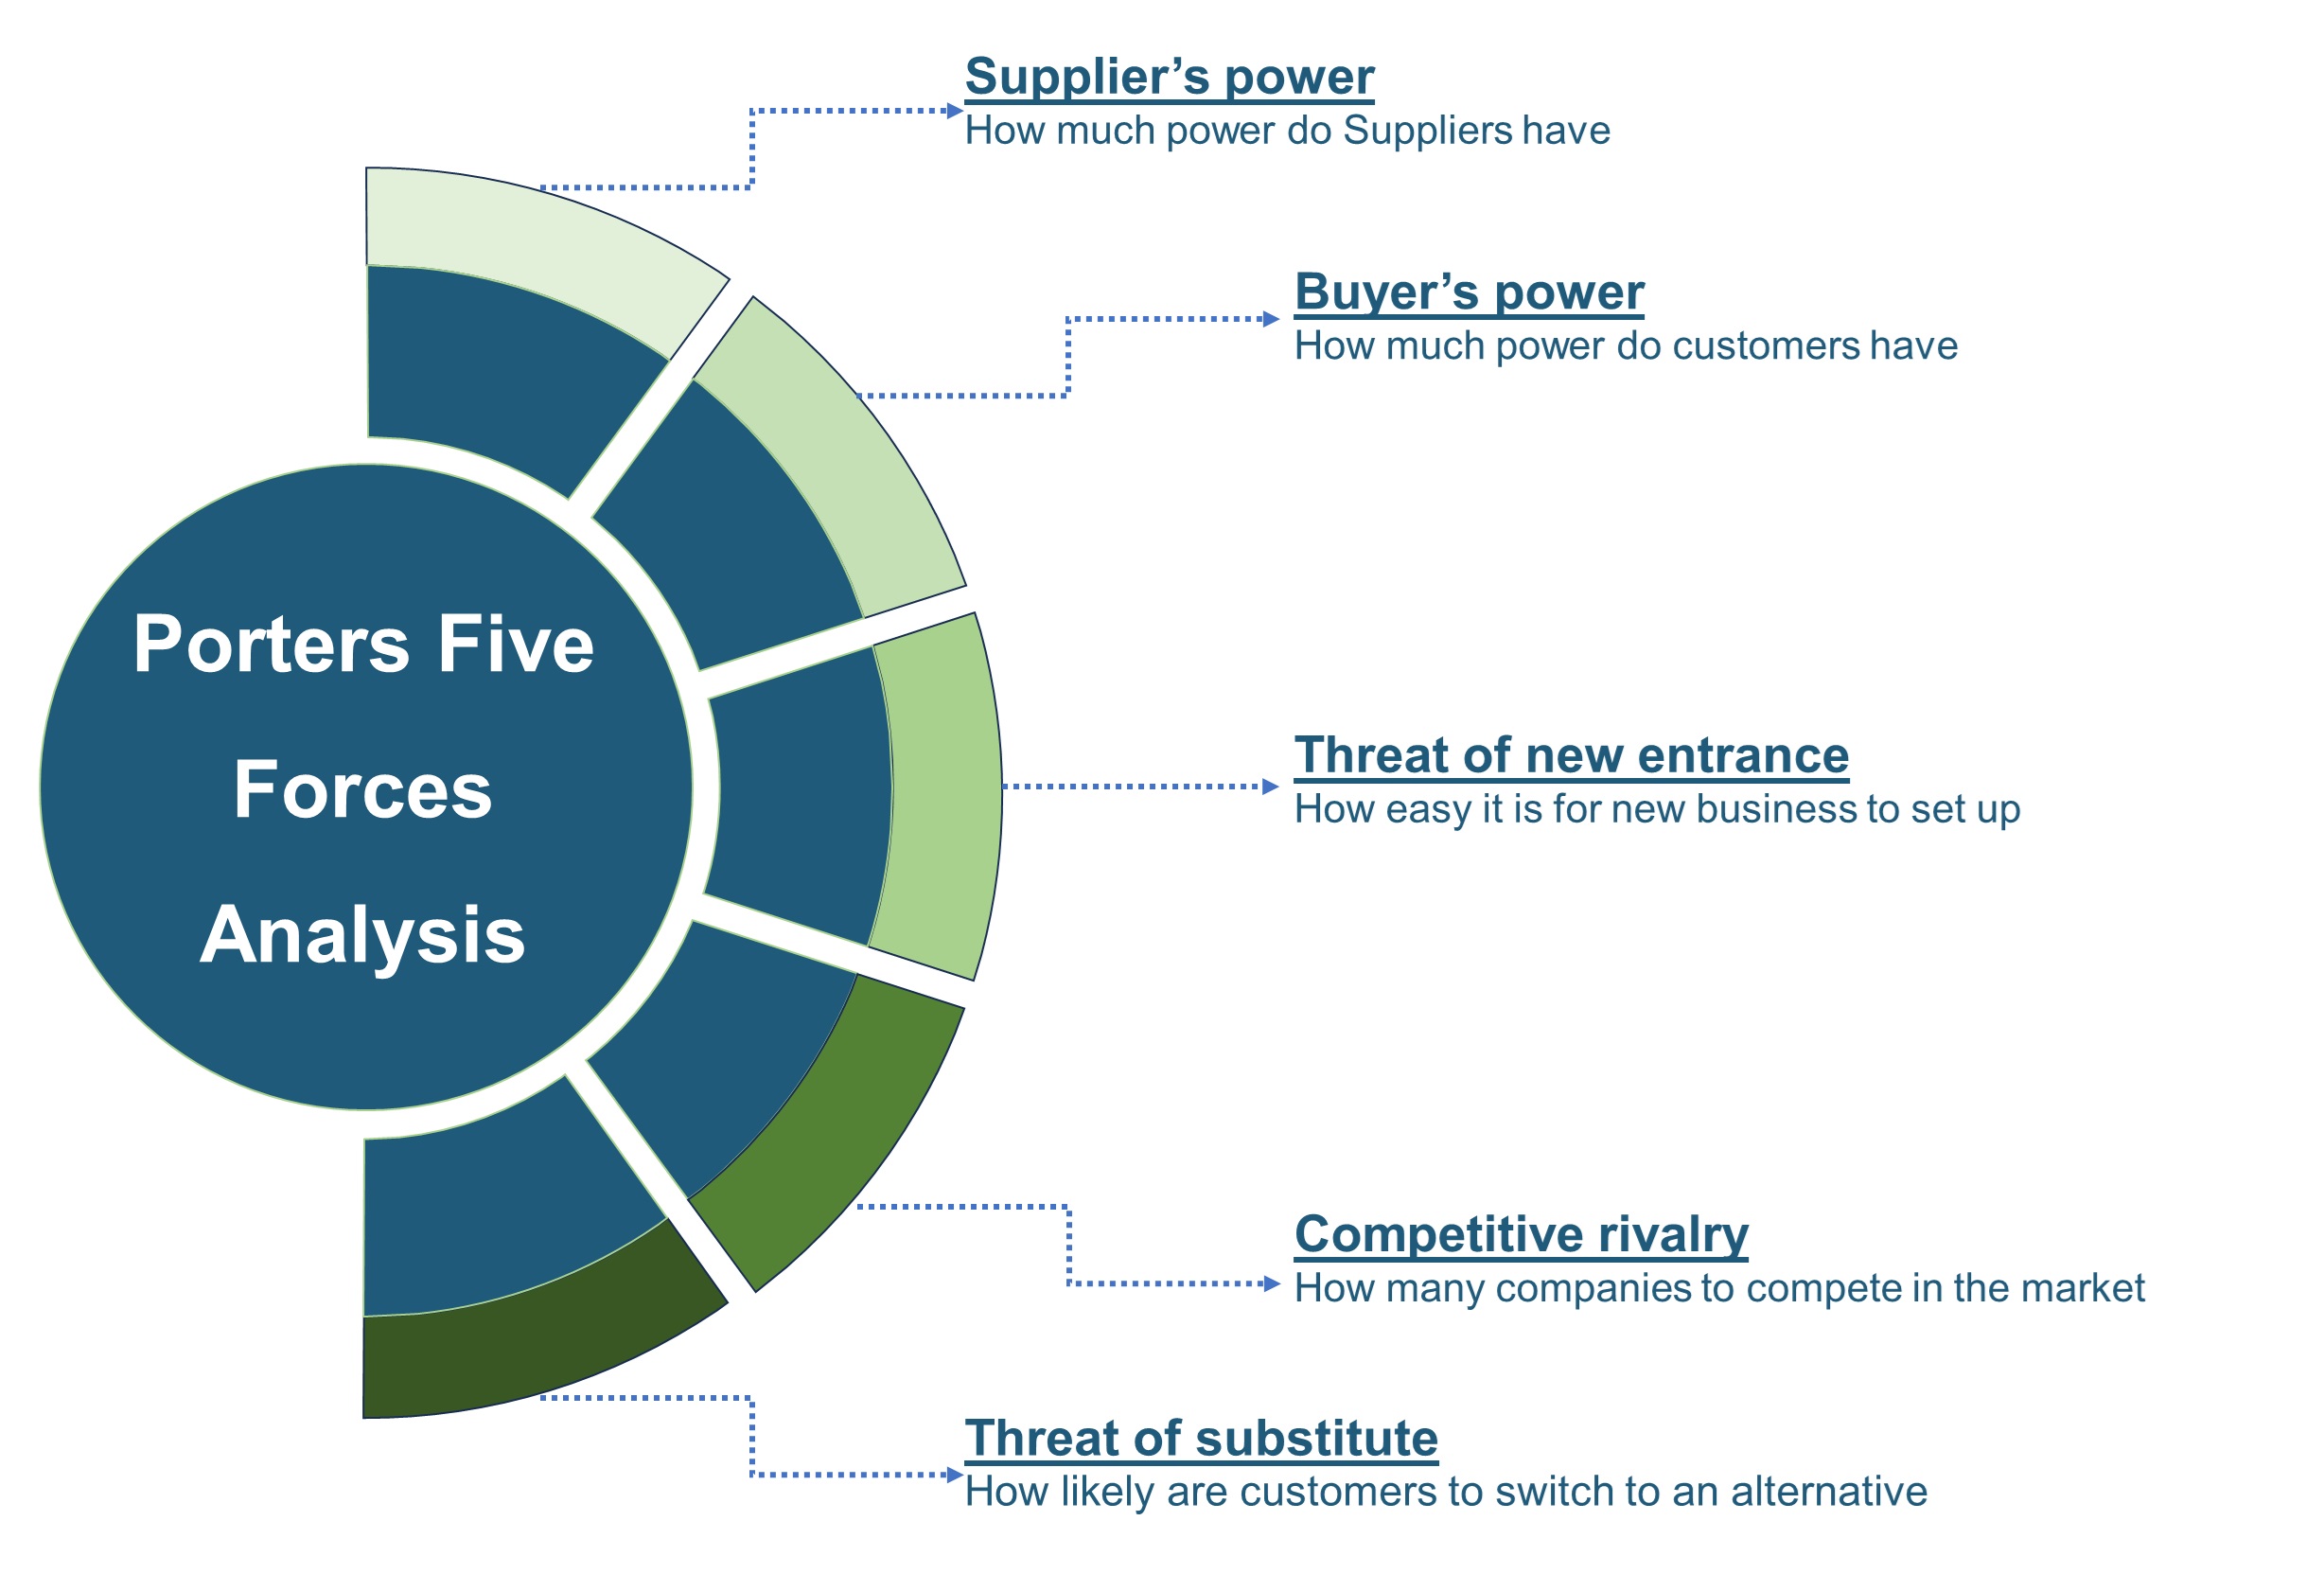
Porters Five Forces Analysis
We conduct Porter's Five Forces analysis to evaluate the competitive landscape of an industry, providing us with insights into factors that affect profitability and strategic positioning.
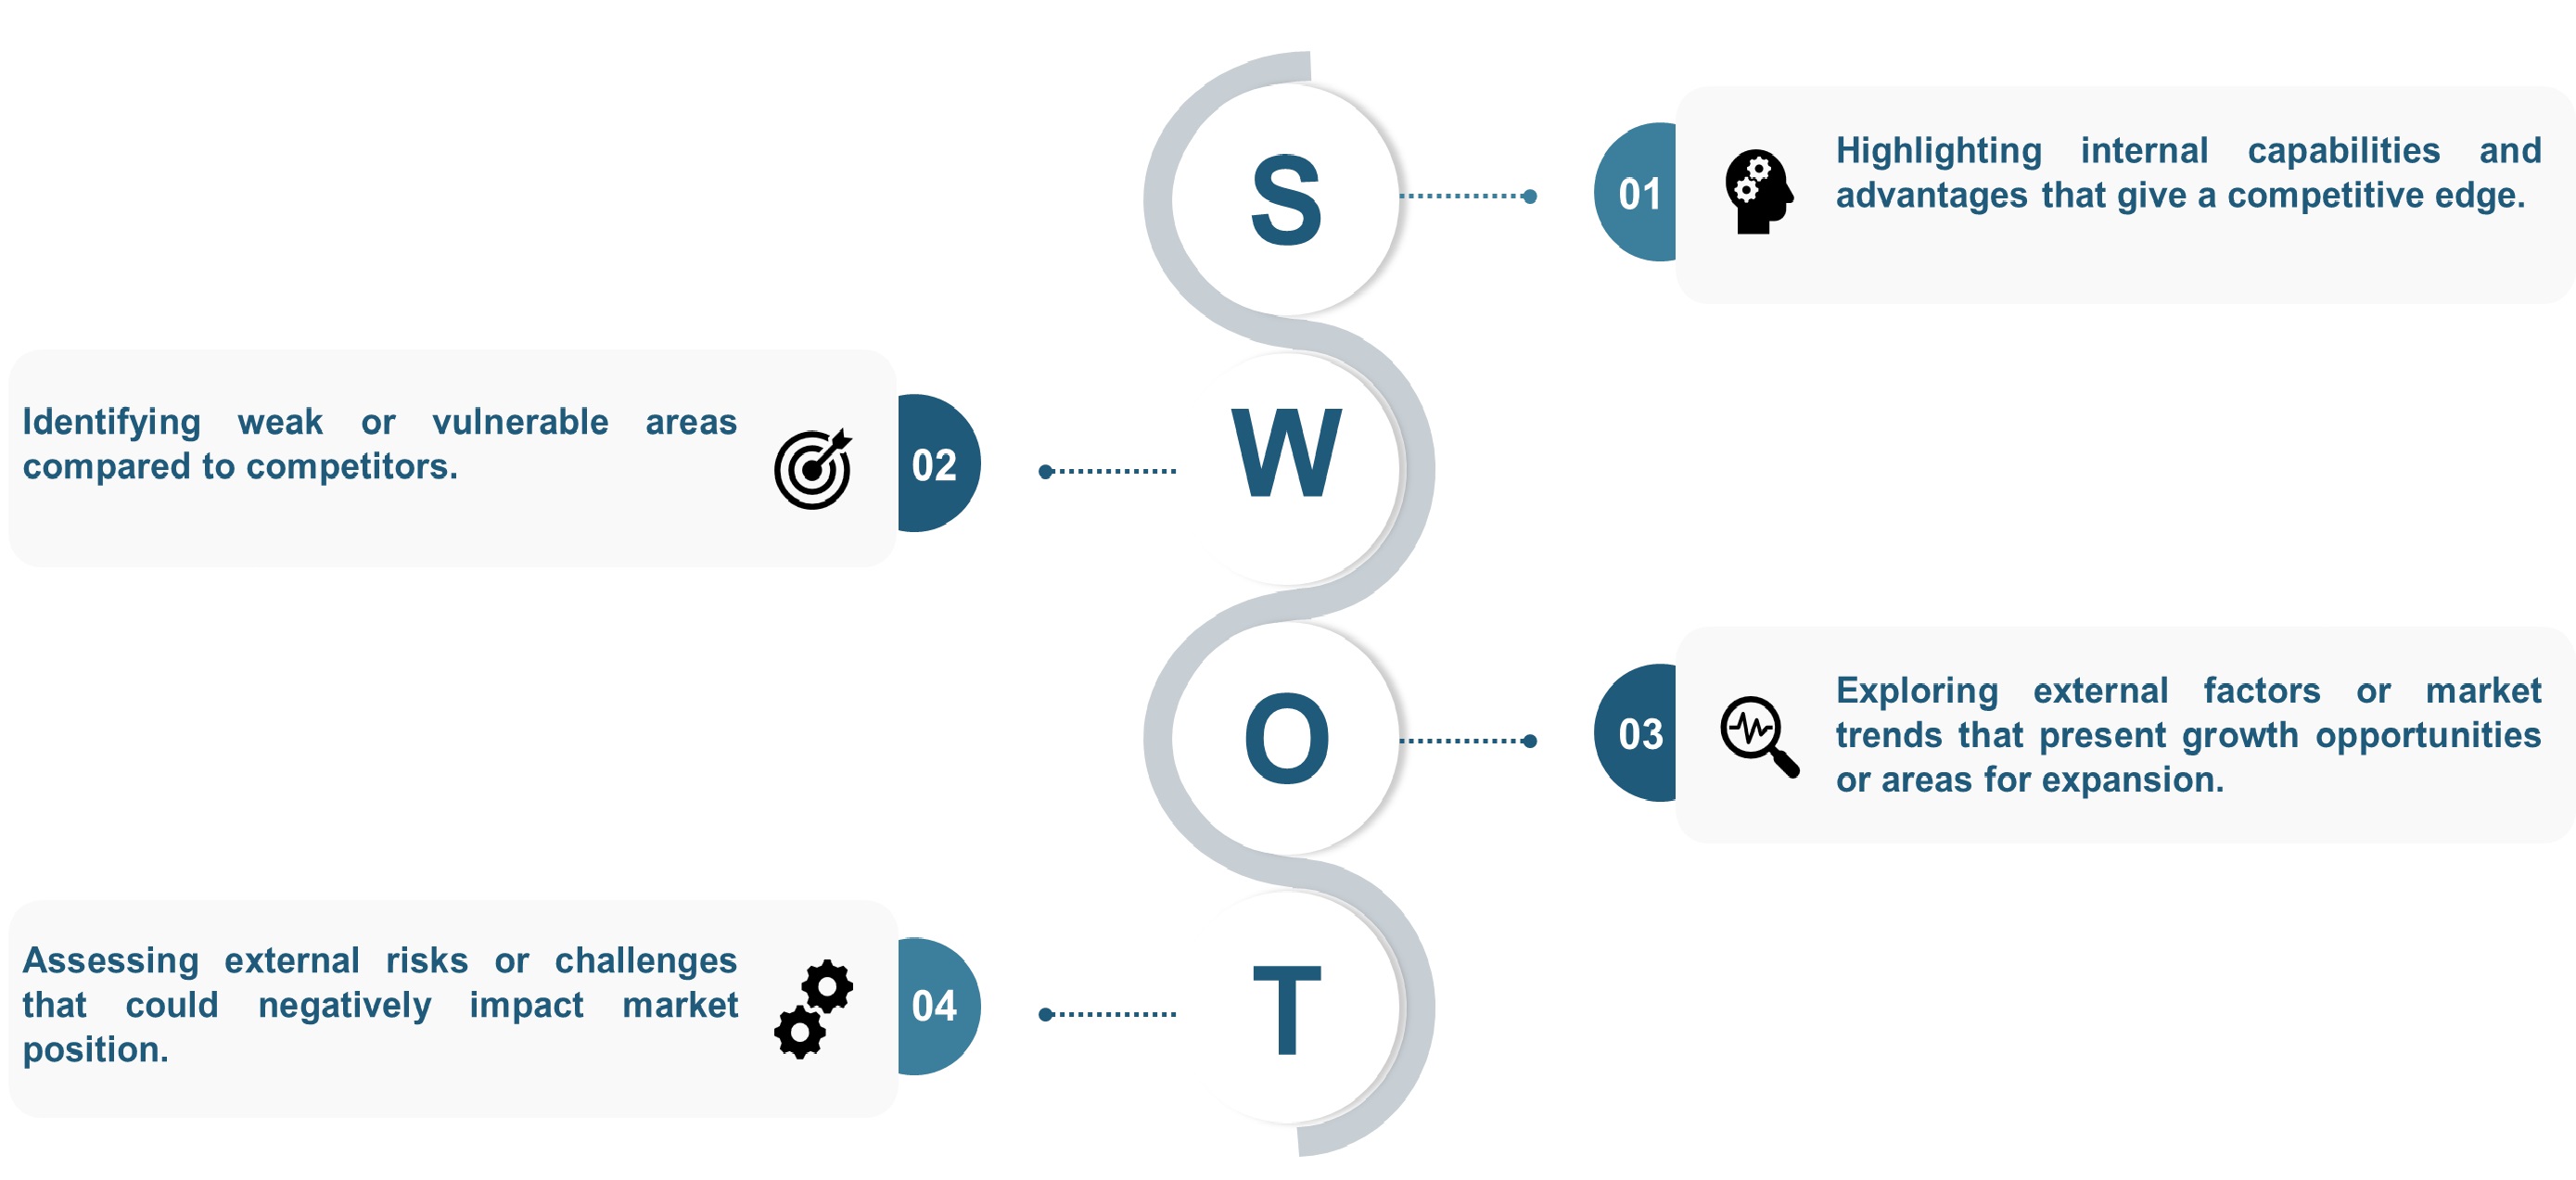
SWOT Analysis
We conduct SWOT analysis to understand market trends, identify potential threats, capitalize on opportunities, and assess our strengths and weaknesses.
Forecasting
We utilize a forecasting model to predict future consumption by considering parameters like population, economics, regulations, market competition, drivers, constraints, technology, and pricing. We also employ statistical techniques such as multilinear regression, exponential smoothing, moving average, ARIMA, and Monte Carlo simulations for accurate predictions. In econometric forecasting, we analyzed short-term and long-term event impacts, attributing values based on regulatory frameworks, economic factors, and market events.


 Speak to Our Analyst