Virtual Fitting Room Market Global Industry Analysis and Forecast (2026–2035)

The global Virtual Fitting Room Market is estimated at USD 1.78 billion in 2026 and is projected to reach USD 11.70 billion by 2035, growing at a CAGR of 23.3% from 2026 to 2035. Growth is driven by rising online return costs and advances in generative AI try-on technology.

Download Free Sample PDF
Base Year (2025)
$1.40 Billion
Forecast (2035)
$11.70 Billion
CAGR (2026-2035)
23.3%
Top Region
North America

What Is the Virtual Fitting Room Market Size?

The global Virtual Fitting Room Market reached USD 1.40 Billion in 2025 and is estimated at USD 1.78 Billion in 2026. It is forecast to reach USD 11.70 Billion by 2035, expanding at a 23.3% CAGR from 2026–2035. North America leads with roughly 37% share, while augmented reality try on holds about 42% of technology revenue.

We observed that a small number of segments and regions hold most of the value that vendors will contest through 2035.

Virtual Fitting Room Market Global Industry Analysis and Forecast (2026–2035) Revenue Forecast

Values in USD Billion

2025 $1.40 Billion
2025
2026 $1.78 Billion
2026
2027 $2.19 Billion
2027
2028 $2.71 Billion
2028
2029 $3.34 Billion
2029
2030 $4.11 Billion
2030
2031 $5.07 Billion
2031
2032 $6.25 Billion
2032
2033 $7.71 Billion
2033
2034 $9.51 Billion
2034
2035 $11.70 Billion
2035

Key Takeaways

By Technology: Augmented reality try on held the largest share, expanding from USD 0.64 Billion in 2025 to USD 2.90 Billion by 2035; Generative AI try on is the fastest growing at 28.1% CAGR from 2026–2035.

By Application: Apparel held the largest share, expanding from USD 0.82 Billion in 2025 to USD 6.60 Billion by 2035; Accessories is the fastest growing at 25.7% CAGR from 2026–2035.

By Channel: Online held the largest share, expanding from USD 1.20 Billion in 2025 to USD 9.45 Billion by 2035; In store is the fastest growing at 27.7% CAGR from 2026–2035.

Dominant Region: North America led in 2026 with USD 0.66 Billion, a 37% share of global revenue.

Fastest-Growing Region: Asia-Pacific is projected to expand at 25.9% CAGR from 2026–2035, reaching USD 4.30 Billion by 2035.

Dominant Country: The U.S. contributed about USD 0.56 Billion in 2026, the largest national revenue base.

Fastest-Growing Country: India is estimated to grow at 29.2% CAGR from 2026–2035.

[Source: www.nextmsc.com](

The market adds an absolute opportunity of approximately USD 9.92 Billion between 2026 and 2035, which frames capital placed in try on platforms and fit data as a multiyear investment theme.

According to NMSC analysis, returns pressure rather than novelty has become the main purchase trigger, because merchants now judge virtual fitting room results by avoided shipments instead of shopper engagement.

Ecosystem Analysis Impacting the Virtual Fitting Room Market

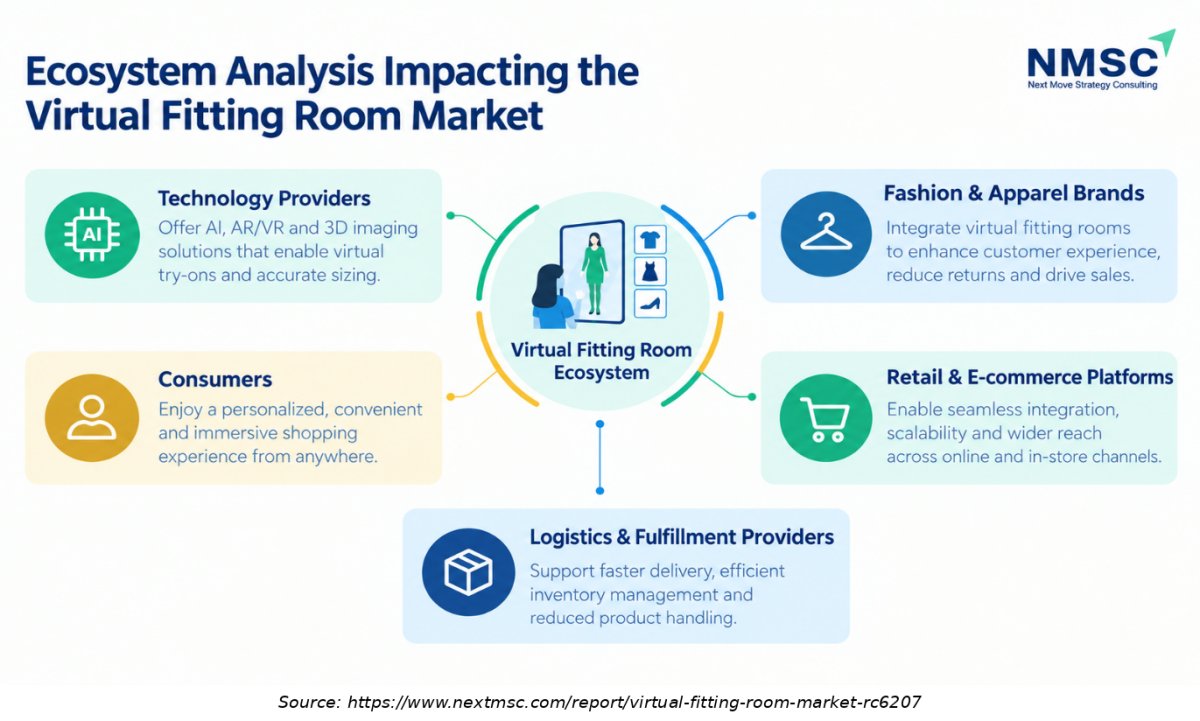
The Ecosystem Analysis infographic for the Virtual Fitting Room Market highlights the roles of technology providers, fashion brands, e-commerce platforms, consumers, and logistics providers. These stakeholders collaborate to deliver virtual try-on solutions, improve size and fit recommendations, personalize online shopping, and reduce product returns.

What Does the Virtual Fitting Room Market Encompass?

The Virtual Fitting Room Market covers software platforms, application programming interfaces and integration services that let shoppers preview apparel, footwear and accessories on their own image or on a digital body before purchase. This market report includes augmented reality try on, generative AI try on and 3D avatar and body scanning that return a size or fit signal. Beauty try on, smart mirror hardware and general ecommerce software sit outside the scope.

The category has moved from camera overlays toward generative image models that render fabric drape on a shopper photo. During our market evaluation, we noticed that regulation now shapes product design, because biometric privacy statutes and the European Union AI Act push vendors toward consent flows and data minimisation. Adoption is therefore fastest where retailers already hold standardised garment images.

Market Drivers & Dynamics

Interactive Dataset
Rising online apparel return costs driver +4.2% Global, led by North America and Europe 2026–2035
Generative AI image models lowering content costs driver +5.1% Global 2026–2032
Retailer investment in omnichannel experiences driver +2.6% North America, Europe, Asia-Pacific 2026–2030
Smartphone camera and mobile commerce penetration driver +3.0% Asia-Pacific, Latin America, Middle East & Africa 2026–2035
Biometric privacy and consent compliance burden restraint −2.8% North America, Europe 2026–2031
Fit accuracy gaps for complex garments restraint −2.2% Global 2026–2030
Fragmented 3D garment digitization workflows restraint −1.9% Global 2026–2029
Source: Next Move Strategy Consulting

Growth Drivers

What Is the Primary Growth Driver in the Virtual Fitting Room Industry?

Return costs are the primary driver of the Virtual Fitting Room Market. The National Retail Federation and Happy Returns project total U.S. retail returns of USD 849.9 billion in 2025 and estimate that 19.3% of online sales are returned. Apparel and footwear carry fit related returns that merchants can influence directly, so each avoided return converts into saved freight, handling and markdown cost. We found that this arithmetic explains why finance leaders now sponsor try on pilots.

How Is Generative AI Driving Market Growth?

Generative AI is lowering the cost of producing realistic try on images, which widens the range of retailers that can afford the technology. Google's Try On feature draws on the billions of apparel items listed in its Shopping Graph and reached shoppers in the U.S., Canada and Australia during 2025. Demand therefore shifts from custom 3D builds to scalable image services. Our findings suggest that mid-sized retailers benefit most because they avoid heavy asset digitization.

Growth Inhibitors

What Is Restraining the Virtual Fitting Room Market?

Privacy compliance is the main restraint on the Virtual Fitting Room Market. Body scans and face images can qualify as biometric identification data. Illinois law provides liquidated damages of USD 1,000 for negligent violations and USD 5,000 for intentional or reckless ones, although a 2024 amendment limits recovery to one per person. The European Union AI Act adds duties for systems that process biometric data. Vendors therefore invest in consent screens, short retention periods and on device processing.

What Are the Growth Opportunities?

Can Garment Image Standardization Open the Mid-Market Retailer Segment?

Many mid-sized retailers hold inconsistent product photography that limits try on quality. Vendors offering low-cost image preparation and automated catalogue onboarding can serve this group, which has been priced out of custom 3D programs. The beneficiary is the apparel segment, where large catalogues and frequent seasonal changes make onboarding speed the deciding purchase factor for retail buyers.

Is There a Bundled Size and Try on Offer for Footwear and Accessories?

Footwear and accessories need both visual preview and fit guidance, yet most vendors sell the two separately. Perfect Corp. extended coverage to shoes and bags through its Wannaby acquisition, and eyewear and watches already rely on camera-based previews. A bundled offer serves accessories, the fastest growing application, and lets merchants measure return reduction under one contract.

Will Shopping Assistants Create a New Distribution Channel for Try On?

AI shopping assistants are beginning to compose outfits and answer fit questions. Perfect Corp. showcased AI shopping agents and developer APIs at Shoptalk 2026, signalling that try on is becoming a callable service. As agentic commerce grows, vendors with open interfaces can earn usage-based revenue from assistants run by retailers and platforms.

Segmentation Analysis

2025 (USD Billion)
2035 (USD Billion)
Augmented reality try on 2025: $0.64 Billion | 2035: $2.90 Billion
Augmented re
Generative AI try on 2025: $0.42 Billion | 2035: $5.75 Billion
Generative A
3D avatar and body scanning 2025: $0.34 Billion | 2035: $3.05 Billion
3D avatar an
Augmented reality try on $0.64 Billion $2.90 Billion 16.4%
Generative AI try on $0.42 Billion $5.75 Billion 28.1%
3D avatar and body scanning $0.34 Billion $3.05 Billion 24.6%

Which Technology Segment Leads the Virtual Fitting Room Industry?

Augmented reality try on remains the largest technology segment at USD 0.74 Billion in 2026, supported by footwear, eyewear and jewellery tools that run on a phone camera. Generative AI try on is the fastest growing segment at 28.1% CAGR from 2026–2035. 3D avatar and body scanning grows at 24.6% CAGR, helped by a persistent digital twin of the shopper that supports size advice across many brands.

2025 (USD Billion)
2035 (USD Billion)
Category A
Category B
Category C
Category D
Segment Item 2025 (USD Billion) 2035 (USD Billion) CAGR
Category A $10.0 USD Billion $40.0 USD Billion 18.0%
Category B $17.1 USD Billion $51.1 USD Billion 16.0%
Category C $24.2 USD Billion $62.2 USD Billion 22.0%
Category D $31.3 USD Billion $73.3 USD Billion 12.0%

Segment-wise data is locked

Unlock complete segment-wise numbers for By Application.

Unlock Full Data
2025 (USD Billion)
2035 (USD Billion)
Category A
Category B
Category C
Category D
Segment Item 2025 (USD Billion) 2035 (USD Billion) CAGR
Category A $10.0 USD Billion $40.0 USD Billion 13.0%
Category B $17.1 USD Billion $51.1 USD Billion 11.0%
Category C $24.2 USD Billion $62.2 USD Billion 21.0%
Category D $31.3 USD Billion $73.3 USD Billion 11.0%

Segment-wise data is locked

Unlock complete segment-wise numbers for By Channel.

Unlock Full Data
2025 (USD Billion)
2035 (USD Billion)
Category A
Category B
Category C
Category D
Segment Item 2025 (USD Billion) 2035 (USD Billion) CAGR
Category A $10.0 USD Billion $40.0 USD Billion 10.0%
Category B $17.1 USD Billion $51.1 USD Billion 8.0%
Category C $24.2 USD Billion $62.2 USD Billion 18.0%
Category D $31.3 USD Billion $73.3 USD Billion 8.0%

Segment-wise data is locked

Unlock complete segment-wise numbers for By Region.

Unlock Full Data

Growth Opportunities

Our analysis shows that three whitespace opportunities are positioned to generate disproportionate revenue before 2035.

Can Garment Image Standardization Open the Mid-Market Retailer Segment?

Many mid-sized retailers hold inconsistent product photography that limits try on quality. Vendors offering low-cost image preparation and automated catalogue onboarding can serve this group, which has been priced out of custom 3D programs. The beneficiary is the apparel segment, where large catalogues and frequent seasonal changes make onboarding speed the deciding purchase factor for retail buyers.

Is There a Bundled Size and Try on Offer for Footwear and Accessories?

Footwear and accessories need both visual preview and fit guidance, yet most vendors sell the two separately. Perfect Corp. extended coverage to shoes and bags through its Wannaby acquisition, and eyewear and watches already rely on camera-based previews. A bundled offer serves accessories, the fastest growing application, and lets merchants measure return reduction under one contract.

Will Shopping Assistants Create a New Distribution Channel for Try On?

AI shopping assistants are beginning to compose outfits and answer fit questions. Perfect Corp. showcased AI shopping agents and developer APIs at Shoptalk 2026, signalling that try on is becoming a callable service. As agentic commerce grows, vendors with open interfaces can earn usage-based revenue from assistants run by retailers and platforms.

Regional Outlook

2025 (USD Billion)
2035 (USD Billion)
North Americ
Europe
Asia-Pacific
Middle East
Latin Americ
Region 2025 (USD Billion) 2035 (USD Billion) CAGR (%)
North America $10.0 USD Billion $40.0 USD Billion 9.0%
Europe $17.1 USD Billion $51.1 USD Billion 27.0%
Asia-Pacific $24.2 USD Billion $62.2 USD Billion 25.0%
Middle East & Africa $31.3 USD Billion $73.3 USD Billion 23.0%
Latin America $38.4 USD Billion $84.4 USD Billion 12.0%

Regional data is locked

Unlock complete regional numbers for this market.

Unlock Full Data

Consumer Behaviour Analysis Impacting the Virtual Fitting Room Market

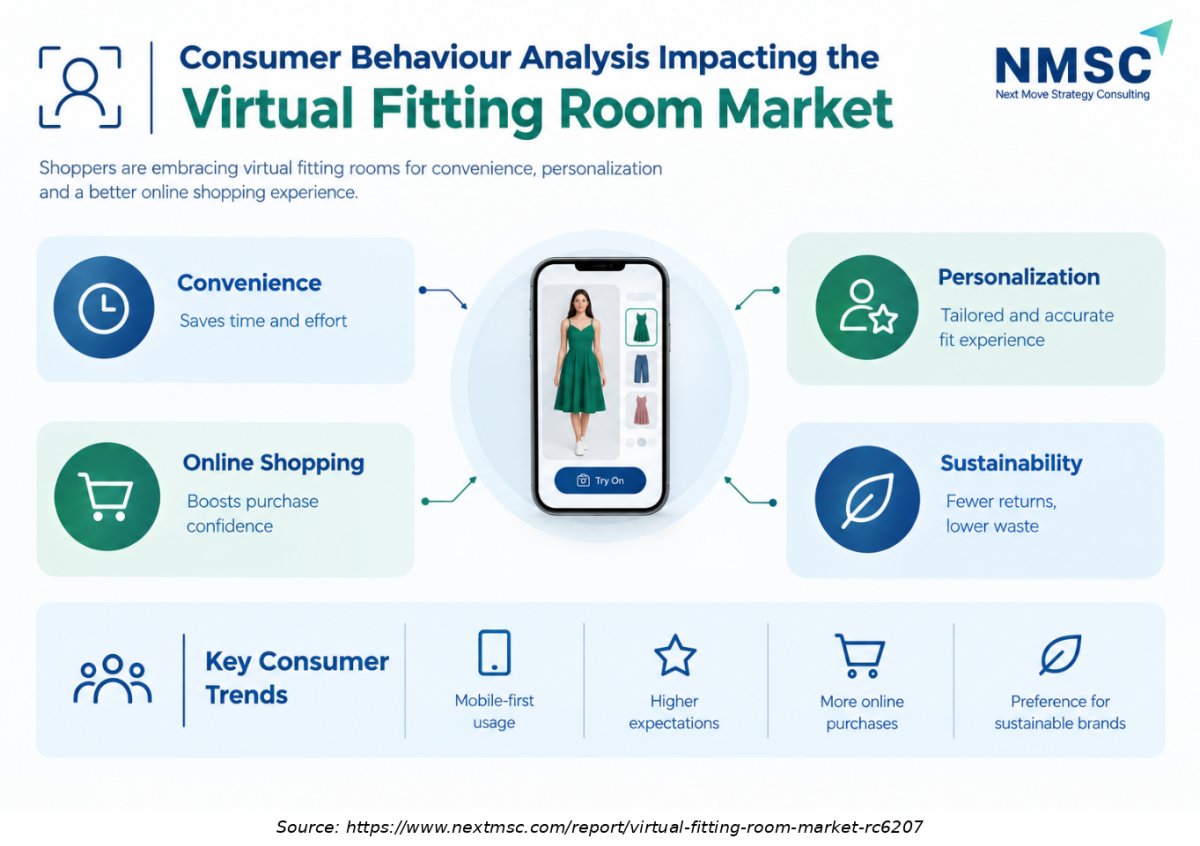
The Consumer Behaviour Analysis infographic for the Virtual Fitting Room Market highlights qualitative themes such as personalized shopping, convenience, sizing confidence, and reduced uncertainty when purchasing apparel, footwear, and accessories online. These factors may influence consumer interest in virtual try-on solutions and support a more confident online shopping experience.

Competitive Landscape

How Do Companies Compete in the Virtual Fitting Room Industry?

Competition runs on realism, fit accuracy, catalogue coverage and integration speed. Platform owners such as Alphabet, Walmart and Amazon compete through reach and owned shopper relationships, while specialists such as Perfect Corp. and 3DLOOK sell to brands that lack in house teams. We observed that pricing now follows usage volume, which favours vendors with efficient image generation.

Which Company Archetypes Dominate the Market?

Three archetypes dominate. Search and platform companies differentiate on scale and distribution, retail groups differentiate on first party catalogues and shopper data, and independent vendors differentiate on depth of fit science and brand services. Perfect Corp. combines beauty heritage with fashion coverage, whereas 3DLOOK concentrates on body measurement and size advice.

What Innovation and Differentiation Strategies Are Companies Pursuing?

Vendors invest in diffusion models that preserve garment texture, in body estimation from two photos, and in APIs that assistants can call. Geographic expansion follows platform launches, as Google moved from the U.S. to Canada and Australia within three months of its first release. Pricing is shifting toward per render and per session fees that scale with merchant traffic.

How Active Is M&A in the Virtual Fitting Room Industry?

Acquisitions concentrate on capability gaps. Walmart acquired Zeekit, Snap bought a size recommendation provider, and Perfect Corp. closed its Wannaby purchase in January 2025 to add shoes, bags and luxury clients. In March 2026 the Perfect Corp. board received a preliminary nonbinding proposal letter from CyberLink International Technology Corp. We expect further consolidation as platforms seek proprietary fit data.

Key Market Players

NMSC's analysis indicates that the following verified companies lead the market, listed in ranked order.

Alphabet Inc. Walmart Inc. Amazon.com, Inc. Perfect Corp. 3DLOOK

Latest Developments

During our market evaluation, we noticed that platform launches and acquisitions defined recent activity.

Date Event
September 2026 Perfect Corp. partnered with QWEEN to introduce 3D virtual jewellery try-on across desktop and mobile shopping experiences
February 2026 Perfect Corp. partnered with designer Nicole Miller to demonstrate an AI virtual fitting room featuring 12 looks from 12 archival collections
December 2025 Google introduced its photo-based virtual apparel try-on experience in the UK and India
October 2025 Google expanded its Shopping virtual try-on experience to footwear in the United States
July 2025 AWS introduced virtual try-on capabilities in Amazon Nova Canvas, allowing users to combine an image of a person with a product image to generate a visualization
March 2024 3DLOOK announced a partner ecosystem involving retail technology companies including Mercaux, Findmine, Vantana and Heuritech

Investment Opportunities

Where Is Capital Flowing in the Virtual Fitting Room Industry?

Capital flows toward vendors that own fit data and toward acquirers consolidating capability. Perfect Corp. paid for Wannaby to enter shoes and bags, Walmart bought Zeekit to build its own try on, and Snap acquired a size recommendation business. Our analysis shows that investors favour usage-based revenue models, because merchant spend scales with traffic and avoided returns.

What Infrastructure Investments Support Market Growth?

Infrastructure spending centres on GPU capacity for image generation, on edge AI that processes photos on the shopper device, and on catalogue pipelines that standardise garment imagery. Device processing lowers latency and reduces the volume of body images sent to servers. Retailers also invest in product data teams, since try on quality depends on clean garment photos.

How Do ESG Considerations Influence Investment?

Environmental goals support spending, because fewer returns mean less freight and packaging waste, and they fit sustainable ecommerce programmes. Governance concerns centre on consent, retention and bias across body types. Social considerations include inclusive sizing and representation. We found that investors increasingly ask vendors for privacy audits and body diversity testing before committing capital.

Key Benefits for Stakeholders

What Does the Report Offer Enterprise and Retail Leaders?

Enterprise and retail leaders receive segment sizing, regional forecasts and a clear comparison of technology choices. The Virtual Fitting Room Market analysis links each technology to the return’s economics reported by the National Retail Federation, so buyers can set pilot targets. Leaders also gain a view of how platform features from search and marketplace owners change build or buy decisions.

How Does the Report Help Investors and Financial Analysts?

Investors receive a reconciled market model, growth rates by technology, application, channel and region, and an assessment of consolidation activity. The analysis shows where returns on capital concentrate, for instance in generative AI try on and in store deployments. Analysts can use the verified company set and the regional outlook to test valuation assumptions against measured demand.

What Value Does the Report Deliver to Technology Vendors and Product Teams?

Vendors and product teams gain insight into buyer priorities, integration barriers and the gap between platform features and specialist services. The report highlights where synthetic data can improve training for diverse body shapes, and where privacy design influences wins. Product teams can prioritise roadmaps against the fastest growing segments.

Key Market Segments Evaluated

By Technology

  • Augmented reality try on
  • Generative AI try on
  • 3D avatar and body scanning

By Application

  • Apparel
  • Footwear
  • Accessories

By Channel

  • Online
  • In store

By Region

  • North America 
    • U.S.
    • Canada
    • Mexico
  • Europe 
    • UK
    • Germany
    • France
    • Italy
    • Spain
    • Sweden
    • Denmark
    • Finland
    • Netherlands
    • Rest of Europe
  • Asia-Pacific 
    • China
    • India
    • Japan
    • South Korea
    • Taiwan
    • Indonesia
    • Vietnam
    • Australia
    • Philippines
    • Malaysia
    • Rest of APAC
  • Middle East & Africa 
    • Saudi Arabia
    • UAE
    • Egypt
    • Israel
    • Turkey
    • Nigeria
    • South Africa
    • Rest of MEA
  • Latin America 
    • Brazil
    • Argentina
    • Chile
    • Colombia
    • Rest of LATAM

Conclusion & Recommendations

The sector is set to grow from USD 1.78 Billion in 2026 to USD 11.70 Billion by 2035, reflecting a maturing technology with clear return economics. Generative AI will shift value from custom 3D builds to scalable services. We expect Asia-Pacific to become the largest region by the end of the forecast period, while North America remains the profit pool for premium vendors.

What Strategic Positioning Recommendations Does NMSC Offer?

Vendors should lead with measurable return reduction, publish fit accuracy results and integrate with retailer catalogues in days rather than months. Retailers should pilot on high return categories, assign a finance owner to track avoided shipments, and negotiate usage-based pricing. Platform owners can widen adoption by sharing integration tools with smaller retailers.

What Is the Investment Attractiveness of the Virtual Fitting Room Market?

Attractiveness is high but selective. Investors benefit from a 23.3% growth rate, recurring usage revenue and strategic acquirers that seek fit data. Risks include free platform features that cap pricing and privacy rules that raise compliance cost. Our assessment indicates that vendors with proprietary body data, retailer integrations and documented privacy practice deserve the highest valuations.

What Are the Market Shifts and Key Risks in the Virtual Fitting Room Market?

Key shifts include the move from overlays to generative rendering, the merging of size advice with visual try on, and the arrival of shopping assistants. Key risks include biometric privacy litigation, inaccurate fit rendering that raises returns, and concentration of power among platform owners. Vendors that manage consent and accuracy transparently will keep pricing power.

What Growth Pathways Will Shape the Market Through 2035?

Growth pathways include accessories and footwear expansion, in store deployments linked to the same shopper profile, and assistants that call try on services. Wearable displays and spatial computing may add immersive fitting later in the decade, though adoption depends on device volumes. Emerging regions add volume as smartphone use rises and marketplaces adopt hosted tools.

FAQs

Sources & References

1.

National Retail Federation: 2025 Retail Returns Landscape

nrf.com
2.

Perfect Corp. Investor Relations: Full Year 2025 Financial Results

ir.perfectcorp.com
3.

Perfect Corp. Business Wire: Completion of Wannaby Acquisition

businesswire.com
4.

Google: Try on styles with AI (July 2025)

blog.google
5.

Google Canada: Virtually try on clothes and shoes (October 2025)

blog.google
6.

Google Australia: Try On launch (October 2025)

blog.google
7.

Walmart Corporate: Be Your Own Model virtual try on

corporate.walmart.com
8.

Amazon: Virtual Try on for Shoes

press.aboutamazon.com
9.

3DLOOK: Your Fit launch announcement

xyz.3dlook.me
10.

Illinois General Assembly: Biometric Information Privacy Act (740 ILCS 14)

ilga.gov
11.

EUR-Lex: Regulation (EU) 2024/1689 (Artificial Intelligence Act)

eur-lex.europa.eu

Expert Insights

John Imah

Founder and CEO | SPREEAI

"Returns were high, personalization was limited, and the overall experience hadn’t evolved at the pace of the consumer."

Analyst Interpretation

The statement highlights persistent challenges in online fashion retail, particularly uncertainty about fit, limited personalization, and product returns. Virtual fitting room solutions that combine realistic garment visualization with accurate size recommendations can help retailers address these concerns, improve purchase confidence, and create more personalized digital shopping experiences.

About the Author

Mayurima Roy

Mayurima Roy

Mayurima Roy is Research Analyst at Next Move Strategy Consulting, where she has spent 4 years working across the firm's full industry coverage rather than a single fixed vertical. Her work centers on structured research, ongoing trend tracking, competitive assessment, and insight-led content development, translating complex market data into clear, decision-ready narratives that support informed client decision-making across diverse global industries, market sectors, and world regions every day.

About the Reviewer

Supradip Baul

Supradip Baul

Supradip Baul is an accomplished business consultant and strategist with over a decade of rich experience in market intelligence, strategy, technology, and business transformation. His work has included rigorous qualitative and quantitative analysis across multiple industries, helping clients shape investment decisions and long-term roadmaps. Earlier in his career, he was associated with Gartner, where he contributed to industry-leading reports and market share analyses. He has worked with leading global companies and holds an MBA with a dual specialization in Marketing and Finance.

Download Free Sample

Gaurav Jaiswal

GAURAV JAISWAL

Founder & CEO

Yano Charge Private Limited

The EV Charging market research report provided by the NextMSC was exceptionally detailed and insightful. It offered a comprehensive analysis that proved to be a game-changer for our strategic planning. Truly a testament to the NextMSC’s expertise and thoroughness in EV market landscape & analysis.

Kevin Coker

KEVIN COKER

Founder, CEO and Board Diector

Proxima Clinical Research

I have been using Next MSC reports for product positioning in a new geography for a long time. They have by far the best reports I have found and the price is reasonable too!

Kishu Kanda

KISHU KANDA

Strategy Analyst

Accenture

We purchased the AI Consumer Market Report from this company. Not only did they customize the report to meet our specific requirements, but they also showed great flexibility in accommodating our budget. The report we received fully met our expectations. Additionally, they provided prompt and thorough responses to both our pre-purchase and follow-up questions. We look forward to working with this company again in the future.

Semih Kavaklioglu

SEMIH KAVAKLIOGLU

Co-Founder & Sales Manager

Decortie

I work a lot in the marketing industry and I know that research is an essential part of any campaign. I have used Market research reports for my own products and I found them to be very informative and well-researched. The team here produces insightful reports for a good price

Pratyush Kumar Das

PRATYUSH KUMAR DAS

Assistant Manager

Polycab India Limited

We would like to express our appreciation for the data and insights provided by nextmsc. We are very pleased with the quality and depth of the information, which has proven to be highly valuable and beneficial for our business decision-making.

Custom Market Research Services

We will customize the research for you if the listed report does not fully match your requirements.

Get 30% Free Customization

Select License

This website uses cookies to ensure you get the best experience on our website. Learn more

✖