Virtual Reality 2.0 Market Global Industry Analysis and Forecast (2026–2035)

The global Virtual Reality 2.0 Market size was valued at USD 29.40 billion in 2025 and is estimated at USD 35.20 billion in 2026, forecast to reach USD 156.80 billion by 2035, expanding at an 18.2% CAGR between 2026 and 2035. North America leads with approximately 42% share, while Hardware dominates all other components with approximately 64% share.

Download Free Sample PDF
Base Year (2025)
$29.40 Billion
Forecast (2035)
$156.80 Billion
CAGR (2026-2035)
18.2%
Top Region
North America

What Is the Virtual Reality 2.0 Market Size?
The global virtual reality 2.0 market size was valued at USD 29.40 billion in 2025 and is estimated at USD 35.20 billion in 2026, forecast to reach USD 156.80 billion by 2035, expanding at an 18.2% CAGR between 2026 and 2035. North America leads with approximately 42% share, while Hardware dominates all other components with approximately 64% share.

We observed that growth is concentrated in mixed reality headsets and enterprise deployment, with open spatial computing platforms and Android XR ecosystem expansion driving the dominant structural shifts through 2035.

Virtual Reality 2.0 Market Global Industry Analysis and Forecast (2026–2035) Revenue Forecast
Values in USD Billion

2025 $29.40 Billion
2025
2026 $35.20 Billion
2026
2027 $41.61 Billion
2027
2028 $49.18 Billion
2028
2029 $58.13 Billion
2029
2030 $68.71 Billion
2030
2031 $81.21 Billion
2031
2032 $95.99 Billion
2032
2033 $113.47 Billion
2033
2034 $134.12 Billion
2034
2035 $156.80 Billion
2035

Key Takeaways

By Component: Hardware held the largest share of approximately 64% (USD 18.82 Billion) in 2025; Software is the fastest-growing sub-segment at 22.0% CAGR from 2026–2035.

By Device Type: Standalone Headsets held the largest share of approximately 61% (USD 17.93 Billion) in 2025; Mixed Reality Headsets is the fastest-growing sub-segment at 26.7% CAGR from 2026–2035.

By Application: Gaming and Entertainment held the largest share of approximately 39% (USD 11.47 Billion) in 2025; Healthcare is the fastest-growing sub-segment at 22.3% CAGR from 2026–2035.

By Distribution Channel: Direct-to-Consumer Online held the largest share of approximately 46% (USD 13.52 Billion) in 2025; Enterprise Direct Sales is the fastest-growing sub-segment at 24.4% CAGR from 2026–2035.

By End User: Consumer held the largest share of approximately 68% (USD 19.99 Billion) in 2025; Government and Defense is the fastest-growing sub-segment at 23.1% CAGR from 2026–2035.

Dominant Region: North America dominated with approximately 42% revenue share (USD 12.35 Billion) in 2025.

Fastest-Growing Region: Asia-Pacific is expected to register the highest CAGR of 21.8% during 2026–2035.

Dominant Country: U.S. led with approximately USD 10.74 Billion in 2025.

Fastest-Growing Country: India is the fastest-growing country at approximately 25.8% CAGR from 2026–2035.

What Does the Virtual Reality 2.0 Market Encompass?
The market encompasses next-generation standalone, tethered, and mixed reality headsets alongside the operating systems, development engines, and content platforms that power immersive spatial computing experiences beyond earlier-generation, single-purpose VR devices. Our assessment indicates that the scope spans hardware including headsets, controllers, sensors, and processors, software spanning operating platforms and development engines, and services including content creation and systems integration, delivered to consumer, enterprise, government, and education end users worldwide.
The market has evolved from closed, single-vendor hardware and software ecosystems toward an increasingly open, multi-vendor spatial computing platform model, exemplified by Google and Samsung's October 2025 launch of the first Android XR headset. We observed that this platform shift is expanding the addressable base of hardware manufacturers able to build headsets without developing proprietary operating systems. Next Move Strategy Consulting's analysis indicates that this structural transition toward open platforms, combined with rising enterprise mixed reality adoption, is redefining competitive dynamics across the virtual reality 2.0 market.

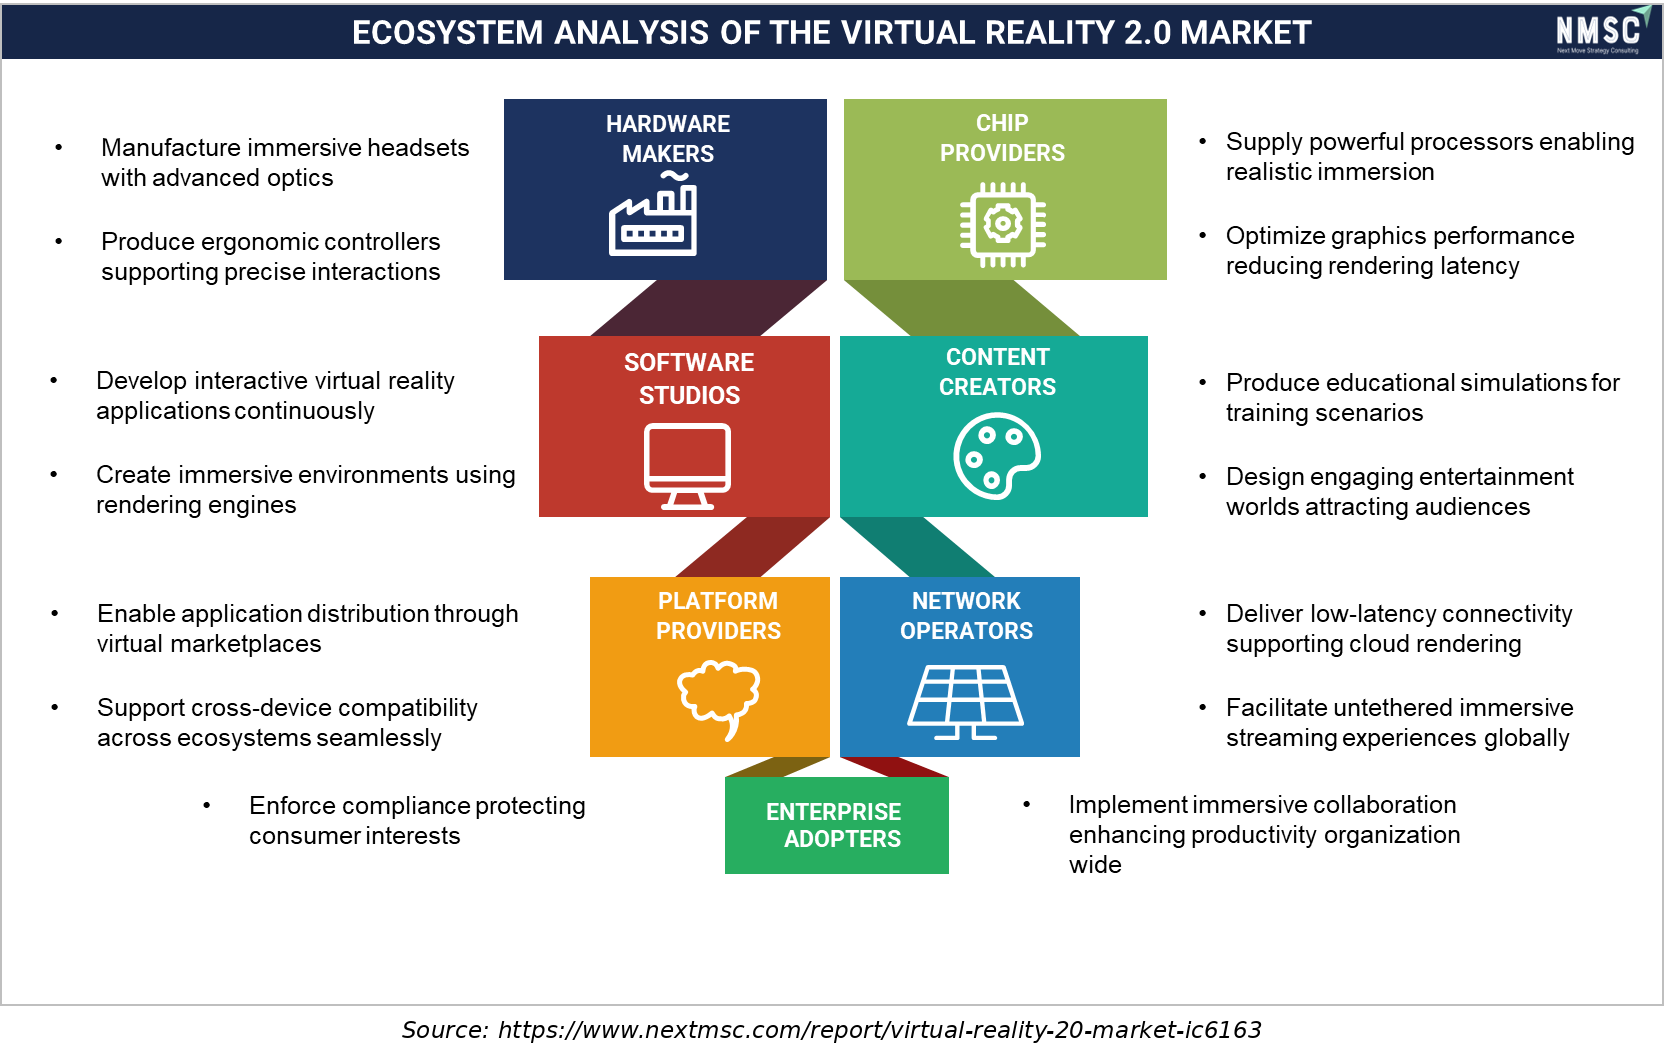
ECOSYSTEM ANALYSIS OF THE VIRTUAL REALITY 2.0 MARKET

The Virtual Reality 2.0 ecosystem connects hardware makers, chip providers, software studios, content creators, platform providers, network operators, and enterprise adopters. Hardware and semiconductors enable immersive experiences, while software and content drive engagement. Platform providers and network operators ensure seamless delivery, allowing enterprises across healthcare, manufacturing, education, retail, and entertainment to deploy advanced VR applications for training, collaboration, simulation, and customer experiences.

Market Drivers & Dynamics

Interactive Dataset
Launch of open, multi-vendor Android XR spatial computing platform driver +2.8% North America, Asia-Pacific 2026-2032
Rising enterprise mixed reality adoption for training and simulation driver +2.3% North America, Europe 2026-2035
Falling headset average selling prices expanding consumer accessibility driver +1.9% Global 2026-2035
Growing healthcare adoption for surgical simulation and pain management driver +1.6% Global 2026-2035
Expanding domestic headset manufacturing capacity across China and South Korea driver +1.4% Asia-Pacific 2026-2033
Improving passthrough camera and AI rendering quality reducing motion discomfort driver +1.2% Global 2026-2032
Rising government and defense simulation and training program investment driver +1.0% North America, Europe 2026-2035
High premium headset pricing limiting mainstream consumer adoption restraint -1.8% Global 2026-2030
Declining traditional standalone VR headset shipment volumes restraint -1.3% Global 2026-2028
Limited native content libraries constraining new platform adoption restraint -0.9% Global 2026-2030
Source: Next Move Strategy Consulting

Growth Drivers

What Is the Primary Growth Driver of the Virtual Reality 2.0 Market?

Launch of the open, multi-vendor Android XR spatial computing platform is the primary driver of the market. Google and Samsung's October 2025 launch of the Galaxy XR headset introduced the first commercially available Android XR device, enabling any hardware manufacturer to build compatible headsets without developing a proprietary operating system. We observed that this platform opening, combined with confirmed plans from multiple manufacturers to launch additional Android XR devices in 2026, continues to anchor structural market expansion beyond single-vendor hardware ecosystems.

How Is Enterprise Mixed Reality Adoption Driving Virtual Reality 2.0 Market Growth?
Rising enterprise mixed reality adoption for training and simulation is driving market growth as organizations increasingly specify passthrough-capable headsets over fully immersive virtual reality devices. The U.S. Securities and Exchange Commission's corporate disclosure filings continue to reflect growing enterprise technology capital expenditure allocated to immersive training infrastructure. Our assessment indicates that this enterprise demand, combined with improving passthrough camera quality, is compressing procurement timelines for organizations building large-scale mixed reality training deployments.

Growth Inhibitors

What Is Restraining Virtual Reality 2.0 Market Expansion?
High premium headset pricing limits mainstream consumer adoption, particularly for mixed reality devices positioned above traditional standalone virtual reality headsets. The U.S. Federal Trade Commission continues to monitor consumer electronics pricing and competition dynamics relevant to premium hardware categories. We found that this pricing barrier disproportionately affects consumer adoption relative to enterprise and government segments, where organizational budgets more readily absorb premium device costs for training and simulation applications.

Segmentation Analysis

2025 (USD Billion)
2035 (USD Billion)
Hardware 2025: $18.82 Billion | 2035: $81.54 Billion
Hardware
Software 2025: $7.06 Billion | 2035: $51.74 Billion
Software
Services 2025: $3.53 Billion | 2035: $23.52 Billion
Services
Hardware $18.82 Billion $81.54 Billion 15.8%
Software $7.06 Billion $51.74 Billion 22.0%
Services $3.53 Billion $23.52 Billion 20.9%

Which Component Segment Dominates the Virtual Reality 2.0 Market?

Hardware led the market with USD 18.82 billion in 2025, reflecting headsets, controllers, and processors' continued role as the largest single cost component of virtual reality deployment. We observed that Software is the fastest-growing component, expanding at a 22.0% CAGR from 2026 to 2035, as open platforms such as Android XR expand the addressable market for operating system and development engine licensing revenue.

2025 (USD Billion)
2035 (USD Billion)
Standalone H
Tethered Hea
Mixed Realit
Segment Item 2025 (USD Billion) 2035 (USD Billion) CAGR
Standalone Headsets $10.0 USD Billion $40.0 USD Billion 25.0%
Tethered Headsets $17.1 USD Billion $51.1 USD Billion 11.0%
Mixed Reality Headsets $24.2 USD Billion $62.2 USD Billion 25.0%

Segment-wise data is locked

Unlock complete segment-wise numbers for By Device Type.

Unlock Full Data

Which Device Type Segment Leads Virtual Reality 2.0 Market Demand?

Standalone Headsets remained the leading device type within the market, valued at USD 17.93 billion in 2025, on sustained consumer and enterprise preference for cordless, self-contained devices. Our findings suggest that Mixed Reality Headsets is the fastest-growing device type, registering a 26.7% CAGR from 2026 to 2035, as passthrough camera quality improvements make mixed reality viable for both enterprise training and everyday consumer use cases.

2025 (USD Billion)
2035 (USD Billion)
Gaming and E
Enterprise T
Healthcare
Education
Retail and R
Segment Item 2025 (USD Billion) 2035 (USD Billion) CAGR
Gaming and Entertainment $10.0 USD Billion $40.0 USD Billion 27.0%
Enterprise Training and Simulation $17.1 USD Billion $51.1 USD Billion 9.0%
Healthcare $24.2 USD Billion $62.2 USD Billion 19.0%
Education $31.3 USD Billion $73.3 USD Billion 17.0%
Retail and Real Estate $38.4 USD Billion $84.4 USD Billion 18.0%

Segment-wise data is locked

Unlock complete segment-wise numbers for By Application.

Unlock Full Data
2025 (USD Billion)
2035 (USD Billion)
Direct-to-Co
Retail Store
Enterprise D
Third-Party
Segment Item 2025 (USD Billion) 2035 (USD Billion) CAGR
Direct-to-Consumer Online $10.0 USD Billion $40.0 USD Billion 14.0%
Retail Stores $17.1 USD Billion $51.1 USD Billion 24.0%
Enterprise Direct Sales $24.2 USD Billion $62.2 USD Billion 22.0%
Third-Party Resellers $31.3 USD Billion $73.3 USD Billion 12.0%

Segment-wise data is locked

Unlock complete segment-wise numbers for By Distribution Channel.

Unlock Full Data
2025 (USD Billion)
2035 (USD Billion)
Consumer
Enterprise
Government a
Education an
Segment Item 2025 (USD Billion) 2035 (USD Billion) CAGR
Consumer $10.0 USD Billion $40.0 USD Billion 24.0%
Enterprise $17.1 USD Billion $51.1 USD Billion 22.0%
Government and Defense $24.2 USD Billion $62.2 USD Billion 20.0%
Education and Research Institutions $31.3 USD Billion $73.3 USD Billion 22.0%

Segment-wise data is locked

Unlock complete segment-wise numbers for By End User.

Unlock Full Data

Which End User Segment Is Most Significant in the Virtual Reality 2.0 Market?

Consumer remained the dominant end user segment across the market, reaching USD 19.99 billion in 2025 due to continued gaming and entertainment demand for standalone headsets. Based on research conducted by Next Move Strategy Consulting, we found that Government and Defense represents the fastest-growing end user category at a 23.1% CAGR from 2026 to 2035, reflecting expanding simulation and training program investment.

Growth Opportunities

Our analysis shows that three forward-looking opportunities stand out for stakeholders positioning within the virtual reality 2.0 market over the 2026-2035 forecast period.

How Can Android XR-Compatible Hardware Unlock Value for Component Manufacturers?

Android XR platform compatibility presents a whitespace opportunity for component and chipset manufacturers seeking to serve hardware makers building third-party headsets. Suppliers that commercialize certified, platform-compatible processors and sensors stand to capture recurring component revenue as additional manufacturers launch Android XR devices without developing proprietary operating systems.

Where Does Enterprise Training Content Development Create New Demand?

Enterprise customers seeking specialized training and simulation content represent an underpenetrated opportunity for content development studios and systems integrators. Providers that develop industry-specific mixed reality training modules can secure long-term enterprise contracts, benefiting from recurring content licensing revenue as organizations scale immersive training programs beyond pilot deployments.

How Can Lightweight Ergonomic Design Benefit Extended-Session Healthcare Applications?

Healthcare providers seeking extended-wear surgical simulation and pain management applications create an opportunity for manufacturers prioritizing lightweight, detachable-battery headset design. Early movers that optimize comfort for multi-hour clinical use can differentiate with healthcare systems pursuing expanded immersive therapy and training program adoption.

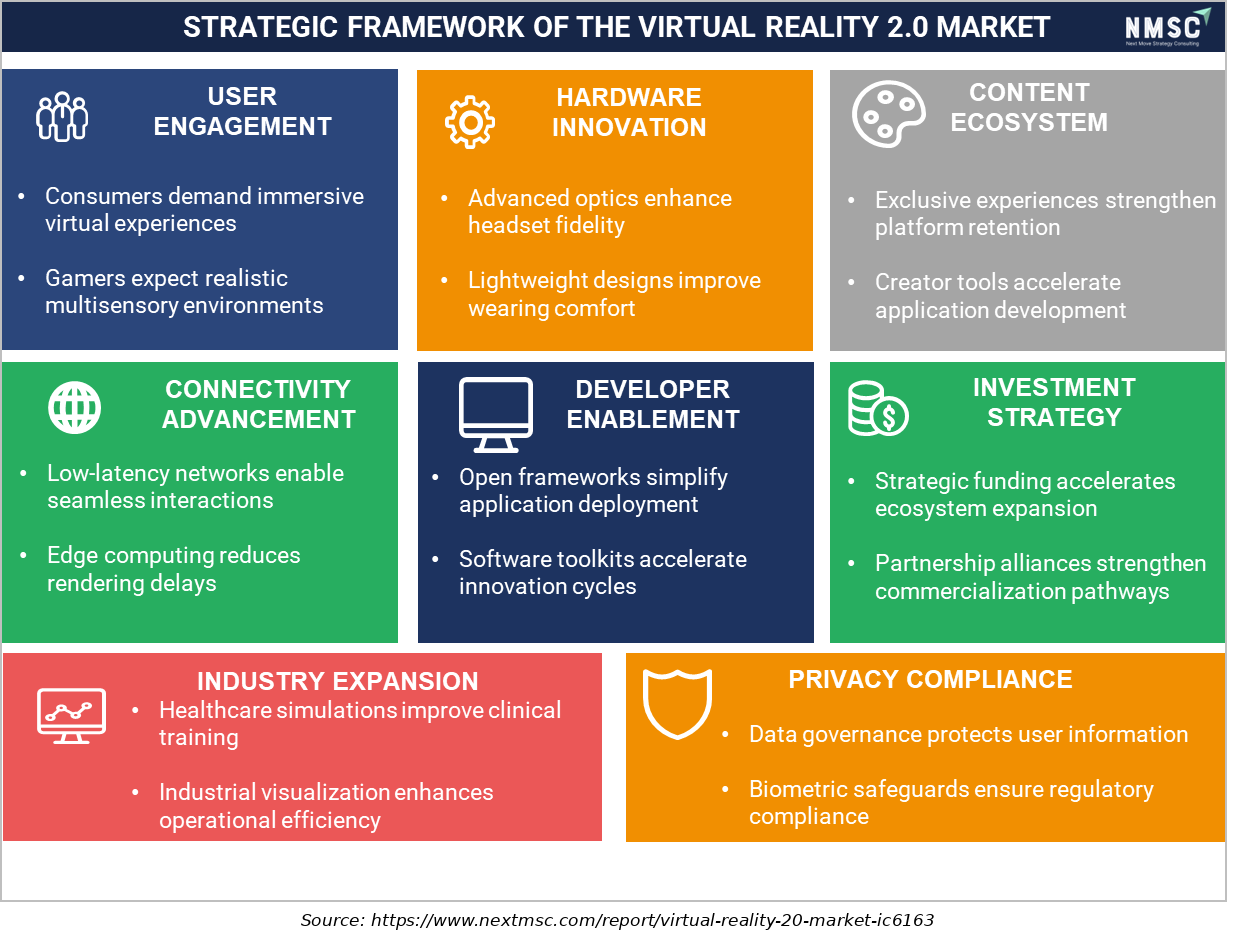
STRATEGIC FRAMEWORK OF THE VIRTUAL REALITY 2.0 MARKET

STRATEGIC FRAMEWORK OF THE VIRTUAL REALITY 2.0 MARKET
The strategic framework for the Virtual Reality 2.0 market emphasizes user engagement, hardware innovation, content ecosystem growth, connectivity advancement, developer enablement, investment strategy, industry expansion, and privacy compliance. Together, these pillars drive immersive experiences, accelerate application development, improve network performance, encourage ecosystem investments, expand enterprise adoption across industries, and ensure secure, compliant deployment through robust data governance and privacy protection.

Regional Outlook

2025 (USD Billion)
2035 (USD Billion)
North Americ
Europe
Asia-Pacific
Middle East
Latin Americ
Region 2025 (USD Billion) 2035 (USD Billion) CAGR (%)
North America $10.0 USD Billion $40.0 USD Billion 9.0%
Europe $17.1 USD Billion $51.1 USD Billion 27.0%
Asia-Pacific $24.2 USD Billion $62.2 USD Billion 25.0%
Middle East & Africa $31.3 USD Billion $73.3 USD Billion 23.0%
Latin America $38.4 USD Billion $84.4 USD Billion 12.0%

Regional data is locked

Unlock complete regional numbers for this market.

Unlock Full Data

Competitive Landscape

We observed that the virtual reality 2.0 market features a moderately concentrated competitive landscape, with a small number of dominant hardware and platform developers competing alongside enabling technology suppliers and specialized enterprise-focused manufacturers on ecosystem breadth, platform openness, and component performance.

Dimension Description
Market Structure Moderately concentrated; Meta continues to hold the largest share of dedicated VR headset unit sales, while Samsung and Google's Android XR launch introduces a structurally new open-platform competitor to previously closed single-vendor ecosystems.
Innovation Focus Open platform ecosystem development, AI-integrated spatial computing, and lightweight ergonomic headset design dominate current innovation pipelines across leading virtual reality 2.0 vendors.
M&A Activity Selective platform and technology partnership activity, exemplified by Google and Samsung's multi-year Android XR development collaboration, which represents platform-level integration rather than traditional acquisition.

How Do Companies Compete in the Virtual Reality 2.0 Market?

Companies compete primarily on platform ecosystem breadth, hardware ergonomics, and AI integration depth across the industry. Meta leverages its integrated hardware, software, and content ecosystem to maintain leading dedicated headset unit share, while Samsung and Google compete through the newly launched, open Android XR platform offering broader Android app compatibility than closed alternatives.

Which Competitive Archetypes Dominate the Virtual Reality 2.0 Market?

Two archetypes dominate the market: vertically integrated single-vendor ecosystems controlling both hardware and software, and open multi-vendor platform coalitions enabling third-party hardware development. Meta and Apple exemplify the vertically integrated archetype through proprietary operating systems, while Samsung and Google's Android XR partnership exemplifies the open platform archetype enabling broader hardware manufacturer participation.

How Are Companies Differentiating Through Innovation in Virtual Reality 2.0?

Innovation and differentiation strategy increasingly center on platform openness and AI assistant integration. Samsung's Galaxy XR, featuring Google's Gemini AI assistant and a detachable battery design, reflects a shift toward ergonomics and AI-differentiated spatial computing experiences. Our analysis shows that vendors unable to demonstrate credible AI integration risk losing enterprise and consumer mindshare to platform competitors.

What M&A and Expansion Activity Is Shaping the Virtual Reality 2.0 Market?

Strategic partnerships and platform expansion continue to reshape competitive dynamics within the industry. Google's multi-year collaboration with Samsung on Android XR, alongside confirmed plans from additional manufacturers to launch Android XR devices in 2026, illustrates how platform coalitions are expanding beyond single hardware partners to build broader multi-vendor ecosystems.

Key Market Players

Our assessment indicates that the following 20 companies are actively shaping platform ecosystem development, hardware innovation, and enabling technology capability within the global virtual reality 2.0 market.

Meta Platforms, Inc. Sony Group Corporation Apple Inc. ByteDance Ltd. HTC Corporation Valve Corporation Samsung Electronics Co., Ltd. Alphabet Inc. Qualcomm Incorporated Varjo Technologies Oy Pimax Technology (Shanghai) Co., Ltd. Lenovo Group Limited Microsoft Corporation Unity Software Inc. Epic Games, Inc. Shenzhen Sanlang Technology Co., Ltd. (DPVR) Vuzix Corporation Shiftall Inc. NVIDIA Corporation Kopin Corporation

Latest Developments

We found that recent developments within the virtual reality 2.0 market are concentrated on open platform launches and AI-integrated spatial computing, reflecting the industry's broader shift toward multi-vendor ecosystems.

Date Event
January 2024 Apple announced Apple Vision Pro, its first spatial computer, with U.S. availability beginning February 2, 2024. The device introduced a new spatial-computing ecosystem built around visionOS, three-dimensional interfaces, eye tracking, hand gestures and voice input, alongside immersive applications, spatial games, 3D entertainment and other spatial experiences.

Expert Insights

Susan Prescott

Susan Prescott

Vice President, Worldwide Developer Relations & Enterprise Marketing | Apple

"There's tremendous opportunity for businesses to reimagine what's possible using Apple Vision Pro at work... we believe spatial computing has the potential to revolutionize industries around the world."

Analyst Interpretation

This insight emphasizes that Virtual Reality 2.0 growth is increasingly being driven by enterprise digital transformation rather than consumer gaming alone. Organizations are adopting immersive technologies for design visualization, workforce training, field service, and collaborative engineering, creating significant long-term revenue opportunities for VR/XR solution providers.

Investment Opportunities

What Capital Inflows Are Targeting the Virtual Reality 2.0 Market?

Capital inflows into the virtual reality 2.0 market are increasingly directed toward open platform ecosystem development and enterprise-focused hardware manufacturers. Samsung and Google's continued joint investment in Android XR platform development reflects sustained confidence in the open spatial computing model. We observed that investors favor manufacturers demonstrating validated platform compatibility, viewing Android XR certification as a proxy for long-term hardware distribution potential.

How Is Infrastructure Investment Supporting Virtual Reality 2.0 Market Scaling?

Infrastructure investment is expanding chipset and component manufacturing capacity to support growing headset production volumes across both closed and open platform ecosystems. Our findings suggest that component suppliers are investing in processor and sensor production capacity to support multiple hardware manufacturers simultaneously building Android XR-compatible devices, positioning suppliers to capture cross-platform component demand.

What ESG Considerations Are Shaping Virtual Reality 2.0 Investment Decisions?

Environmental, social, and governance considerations are relevant to investment decisions across the industry, with device accessibility and digital wellbeing as emerging governance criteria. The U.S. Federal Trade Commission continues to monitor consumer protection considerations relevant to immersive technology marketing and use. We found that investors increasingly treat pricing accessibility and platform openness as governance indicators alongside hardware performance specifications.

Key Benefits for Stakeholders

How Does This Report Benefit Enterprise and Industry Leaders?

Enterprise and industry leaders gain access to validated segmentation, competitive benchmarking, and regional demand forecasts that support hardware sourcing and platform strategy decisions across the virtual reality 2.0 industry. Our analysis shows that detailed device type, application, and end user breakdowns help procurement teams align platform selection with training and simulation requirements while identifying underserved segments for portfolio expansion.

How Does This Report Benefit Investors and Financial Analysts?

Investors and financial analysts benefit from consistent, single-point market size and CAGR estimates that support valuation and capital-allocation decisions across the virtual reality 2.0 supply chain. We observed that the report's regional and segment-level growth differentials help identify which manufacturers are best positioned to capture above-market growth in Asia-Pacific and mixed reality hardware categories through 2035.

How Does This Report Benefit Technology Vendors and Product Teams?

Technology vendors and product teams gain insight into emerging platform requirements, including Android XR compatibility and AI assistant integration, that are reshaping the industry. Our findings suggest that this analysis helps product teams prioritize development roadmaps around ergonomic design and open platform certification increasingly required by enterprise and consumer buyers.

Key Market Segments Evaluated

By Component

  • Headsets and Head Mounted Displays
  • Controllers and Haptic Devices
  • Sensors and Tracking Systems
  • Processors and Chipsets
  • Operating Systems and Platforms
  • Development Engines and SDKs
  • Content and Applications
  • Content Creation Services
  • Systems Integration Services
  • Support and Maintenance Services

By Region

  • North America 
    • U.S.
    • Canada
    • Mexico
  • Europe 
    • UK
    • Germany
    • France
    • Italy
    • Spain
    • Sweden
    • Denmark
    • Finland
    • Netherlands
    • Rest of Europe
  • Asia-Pacific 
    • China
    • India
    • Japan
    • South Korea
    • Taiwan
    • Indonesia
    • Vietnam
    • Australia
    • Philippines
    • Malaysia
    • Rest of APAC
  • Middle East & Africa 
    • Saudi Arabia
    • UAE
    • Egypt
    • Israel
    • Turkey
    • Nigeria
    • South Africa
    • Rest of MEA
  • Latin America 
    • Brazil
    • Argentina
    • Chile
    • Colombia
    • Rest of LATAM

Conclusion & Recommendations

The long-term outlook for the market remains strongly positive, with global revenue projected to grow more than fivefold from USD 29.40 billion in 2025 to USD 156.80 billion by 2035 at an 18.2% CAGR. We observed that sustained Android XR platform expansion, growing enterprise mixed reality adoption, and improving hardware ergonomics will continue underpinning demand across consumer, enterprise, and government applications through the forecast period.

What Strategic Positioning Should Virtual Reality 2.0 Suppliers Pursue?

Suppliers should prioritize Android XR platform compatibility and mixed reality passthrough quality while pursuing enterprise training partnerships to secure long-term institutional contracts. Our assessment indicates that manufacturers investing early in ergonomic design and AI assistant integration will be best positioned to capture premium pricing within the virtual reality 2.0 market.

How Attractive Is the Virtual Reality 2.0 Market for New Investment?

The virtual reality 2.0 industry presents a highly attractive investment case, supported by a USD 121.60 billion absolute dollar opportunity between 2026 and 2035 and above-average growth in Asia-Pacific and mixed reality hardware categories. We found that investment attractiveness is highest for manufacturers combining validated Android XR compatibility with scaled component supply relationships.

What Market Shifts and Key Risks Should Stakeholders Monitor?

Stakeholders should monitor high premium pricing limiting mainstream adoption, declining traditional standalone headset shipment volumes, and limited native content libraries constraining new platform adoption as key risks to the virtual reality 2.0 market. Our analysis shows that manufacturers unable to demonstrate compelling content ecosystems risk losing consumer and enterprise mindshare to competitors with proven platform maturity.

What Are the Key Growth Pathways for the Virtual Reality 2.0 Market?

Key growth pathways include expanding Android XR-compatible hardware portfolios, scaling enterprise training and simulation content development, and deepening AI assistant integration across spatial computing platforms. Next Move Strategy Consulting's analysis indicates that suppliers pursuing these pathways while maintaining cost competitiveness in standard standalone headset categories will be best positioned to capture the virtual reality 2.0 market's projected growth through 2035.

FAQs

About the Author

Liza Phukan

Liza Phukan

Liza Phukan is Research Associate at Next Move Strategy Consulting, where she has covered emerging industries and market research across sectors for 3.5 years. Her work includes analyzing industry developments, validating market data, and developing structured business content from research findings. She uses secondary research and data-validation practices to turn complex market information into clear decision-useful market analysis for business audiences and support report development and B2B.

About the Reviewer

Supradip Baul

Supradip Baul

Supradip Baul is an accomplished business consultant and strategist with over a decade of rich experience in market intelligence, strategy, technology, and business transformation. His work has included rigorous qualitative and quantitative analysis across multiple industries, helping clients shape investment decisions and long-term roadmaps. Earlier in his career, he was associated with Gartner, where he contributed to industry-leading reports and market share analyses. He has worked with leading global companies and holds an MBA with a dual specialization in Marketing and Finance.

Download Free Sample

Rishabh Jogani

RISHABH JOGANI

Strategy Analyst

Accenture Japan

We are incredibly impressed with the market report on the real estate market in India provided by Next Move Strategy Consulting. The report was thorough, insightful, and well-structured, offering deep analysis and actionable recommendations. It not only captured the current trends and dynamics but also provided a forward-looking perspective that has been invaluable for our strategic planning. Their team demonstrated exceptional professionalism, attention to detail, and a profound understanding of the industry. The data-driven insights and clarity of presentation exceeded our expectations, making complex market trends easy to understand. We highly recommend Next Move Strategy Consulting to anyone looking for reliable and comprehensive market research services. Their expertise has given us the confidence to navigate the complexities of the Indian real estate market with clarity and foresight.

Henri Knyphausen

HENRI KNYPHAUSEN

Partner at Singulier [Ex-BCG]

Singulier

I recently engaged NEXTMSC.com for a commercial due diligence project within the intralogistics sector, and I am pleased to provide a reference based on my experience. In utilizing NEXTMSC.com's services, I found their report to offer valuable insights into market dynamics and key industry players. The initial report provided a solid foundation for our analysis. However, as we were investigating a smaller target in the market, and I had specific customization requests requiring additional research. These requests included detailed information on product portfolios of various players and sub-market sizes, both inclusive and exclusive of certain product categories. NEXTMSC.com demonstrated commendable responsiveness and agility in accommodating these customization requests. Within a timeframe of 1-2 weeks, they delivered a revised report that met our specific needs. Furthermore, they were receptive to my follow-up inquiries, ensuring clarity and understanding of the data provided. The final deliverable significantly contributed to our due diligence efforts. One of NEXTMSC.com's notable strengths lies in their qualitative research capabilities. However, for future engagements, I would recommend the inclusion of a quantified market model in Excel format. Such a model would offer the ability to conduct in-depth analyses and explore various market segments, including country-specific data and subcomponent breakdowns. Based on my positive experience, I would not hesitate to work with NEXTMSC.com again. Their responsiveness, willingness to accommodate customization requests, and commitment to delivering actionable insights make them a reliable partner for commercial research projects.

Amos Chang

AMOS CHANG

Strategy Consultant

Kardex Group

I have bought the intralogistics market reports from NMSC two times so far. Joseph and his team are always very helpful and flexible in responding to any customization requirements on the report. Their expertise in market reports really helps us steer the day-to-day business. I will definitely recommend and come back myself whenever there is a need.

Ross J Mckenzie

ROSS J MCKENZIE

Business Insight Manager

Staysure Group

“Next MSC have been incredibly helpful in providing detailed & robust information on our market, alongside quantifying growth by different segments. The process to procure was simple and easy, with sample reports and regular contact to ensure we had what we needed. Succinct detail on their sources & methodologies is also greatly received, allowing transparency in this respect helps build trust in the detail you pay for. Joseph in particular was fantastic, and helped ensure efficient provision of the insight pack – thank you NMSC!”.

Robert Sean Trevino

ROBERT SEAN TREVINO

Sr. Director, Head of Strategic Insights & Analytics

Foundation Medicine

I realized that it was a reliable source of information. These days, there are many people who are looking for authentic data, and this is one of the only sources that can offer them with what they need;

Custom Market Research Services

We will customize the research for you if the listed report does not fully match your requirements.

Get 30% Free Customization

Select License

This website uses cookies to ensure you get the best experience on our website. Learn more

✖