Virtual Power Plant Market Global Industry Analysis and Forecast (2026–2035)

The global Virtual Power Plant Market size was valued at USD 8.53 billion in 2025 and is estimated at USD 12.82 billion in 2026, forecast to reach USD 51.47 billion by 2035, expanding at a 16.7% CAGR between 2026 and 2035. North America leads with approximately 37% share, while Demand Response dominates the technology segment with approximately 44% share.

Download Free Sample PDF
Base Year (2025)
$8.53 Billion
Forecast (2035)
$51.47 Billion
CAGR (2026-2035)
16.7%
Top Region
North America

What Is the Virtual Power Plant Market Size?

The global Virtual Power Plant Market reached USD 8.53 Billion in 2025 and is estimated at USD 12.82 Billion in 2026. It is forecast to reach USD 51.47 Billion by 2035, registering a CAGR of 16.7% from 2026 to 2035. North America leads with roughly 37% share, while demand response dominates the technology mix at about 44%.

Our analysis shows that value concentration differs sharply across the four segmentation axes, as the takeaways below summarise.

Virtual Power Plant Market Global Industry Analysis and Forecast (2026–2035) Revenue Forecast

Values in USD Billion

2025 $8.53 Billion
2025
2026 $12.82 Billion
2026
2027 $14.96 Billion
2027
2028 $17.46 Billion
2028
2029 $20.38 Billion
2029
2030 $23.78 Billion
2030
2031 $27.75 Billion
2031
2032 $32.38 Billion
2032
2033 $37.79 Billion
2033
2034 $44.10 Billion
2034
2035 $51.47 Billion
2035

Key Takeaways

By Technology: Demand response is dominant, moving from USD 3.80 Billion in 2025 to USD 20.40 Billion in 2035; Mixed Asset is the fastest-growing segment at an 18.0% CAGR (2026–2035).

By Offering: Software and platform is dominant, moving from USD 3.55 Billion in 2025 to USD 23.75 Billion in 2035; Services is the fastest growing at a 18.8% CAGR (2026–2035).

By End User: Commercial is dominant, moving from USD 3.13 Billion in 2025 to USD 18.77 Billion in 2035; Residential is the fastest growing at a 18.3% CAGR (2026–2035).

Dominant Region: North America, with USD 4.75 Billion in 2026 and about 37% of global revenue.

Fastest-Growing Region: Asia-Pacific, at a 19.6% CAGR (2026–2035).

Dominant Country: The U.S., with an estimated USD 4.15 Billion in 2026.

Fastest-Growing Country: Saudi Arabia, at a 23.7% CAGR (2026–2035).

The Virtual Power Plant Market is projected to expand by approximately USD 38.65 billion between 2026 and 2035, increasing from USD 12.82 billion to USD 51.47 billion. This projected growth may create opportunities for software platforms, fleet aggregation services and market-access solutions. Actual investment outcomes will depend on regulatory developments, customer adoption, contract structures and the ability to deliver reliable dispatchable capacity.

According to the supplied market estimates, the Virtual Power Plant Market increases from USD 8.53 billion in 2025 to USD 12.82 billion in 2026, representing approximately 50.3% year-on-year growth. Recent capacity agreements with data center operators and utilities demonstrate growing interest in aggregated flexibility. However, the projected increase in market revenue should be interpreted in the context of the underlying market-sizing assumptions. From 2026 onward, the market is forecast to expand at a CAGR of 16.7% through 2035.

What Does the Virtual Power Plant Market Encompass?

The Virtual Power Plant Market covers the software, control hardware and services that aggregate distributed energy resources into one dispatchable resource. These resources include rooftop solar, home batteries, smart thermostats, electric vehicle chargers and flexible industrial loads. Aggregators sell the resulting capacity to utilities and wholesale markets, so the platform layer captures most of the value. This market report sizes revenue earned by platform providers, control equipment suppliers and aggregation service operators.

Regulation shapes participation directly. In the United States, FERC Order No. 2222 enables aggregated distributed energy resources to participate in wholesale electricity markets. Implementation timelines vary across regional grid operators, with published schedules extending from 2026 to 2030. These staggered timelines influence when aggregators can access wholesale markets and expand beyond established utility demand response programs.

Market Drivers & Dynamics

Interactive Dataset
Data center demand for dispatchable capacity driver +3.1% North America, Asia-Pacific 2026–2032
FERC Order 2222 and similar market access reforms driver +2.6% North America, Europe 2026–2030
Rising peak demand and generation adequacy gaps driver +2.4% Global 2026–2035
Falling home battery and smart device costs driver +1.9% Global 2026–2033
Delays in wholesale integration of aggregations restraint −1.8% North America 2026–2029
Interoperability and cybersecurity risks restraint −1.3% Global 2026–2032
Customer enrolment and retention fatigue restraint −1.1% North America, Europe 2026–2031
Fragmented tariffs and compensation rules restraint −0.9% Asia-Pacific, Middle East & Africa 2027–2033
Source: Next Move Strategy Consulting

Growth Drivers

What Is the Primary Growth Driver in the Virtual Power Plant Industry?

Rising peak demand is the primary structural driver of the Virtual Power Plant Market, because utilities need capacity faster than new plants and transmission lines can be built. The U.S. Department of Energy estimates that tripling virtual power plant capacity by 2030 could save about USD 10 Billion in annual grid costs. We found that utilities treat aggregated flexibility as a cheaper alternative to peaker plants, which supports multi year program budgets.

How Is Data Center Load Growth Driving the Market Growth?

Data center load growth links aggregator revenue to a buyer with deep budgets and urgent timelines. The 16.8 GW framework announced by Sunrun, Tesla and Renew Home in June 2026 shows how residential fleets can be packaged for large users. Based on research conducted by NMSC, we found that contracts of this type lift demand for software, metering and enrolment services, adding an estimated 3.1% to the forecast CAGR.

Growth Inhibitors

What Is Restraining the Virtual Power Plant Market?

Slow wholesale integration is the primary restraint. The Pacific Northwest National Laboratory reports that FERC accepted a June 2029 implementation date for MISO, so aggregations in that region cannot fully enter wholesale markets sooner. Interoperability gaps between device makers and aggregators add cost, and customer enrolment fatigue raises churn. NMSC's analysis indicates that these frictions cut about 5.1% from the unconstrained growth rate.

What Are the Growth Opportunities?

Can Capacity Contracts with Data Center Operators Create a New Revenue Class?

Large electricity users need firm capacity before new generation arrives, and Virtual Power Plant Market aggregators can supply it from enrolled devices. The June 2026 framework covering up to 16.8 GW shows buyers will contract at fleet scale. Software and platform providers and Mixed asset operators benefit most, because these contracts require verified dispatch, forecasting and settlement tools that smaller programs have not needed.

Does Residential Battery Fleet Aggregation Represent an Untapped Volume Opportunity?

Millions of home batteries sit idle outside outage events and could be enrolled at low acquisition cost. Virtual Power Plant Market aggregators that sign installers and manufacturers can add megawatts without building new sites, and stationary energy storage owners earn payments for dispatch. Residential, the fastest growing end user at 18.3% CAGR, and Services providers handling enrolment and customer support capture most of this value.

Can Emerging Utilities in Asia-Pacific and the Middle East Leapfrog into Aggregated Flexibility?

Utilities in fast growing power systems can design aggregation programs from the start rather than retrofit legacy ones. Rising solar power equipment installations create flexible assets that need orchestration, and new capacity markets can price them. Platform vendors and Distributed generation operators in the Virtual Power Plant Market across India, Saudi Arabia, Australia and China hold the strongest position to win these first contracts.

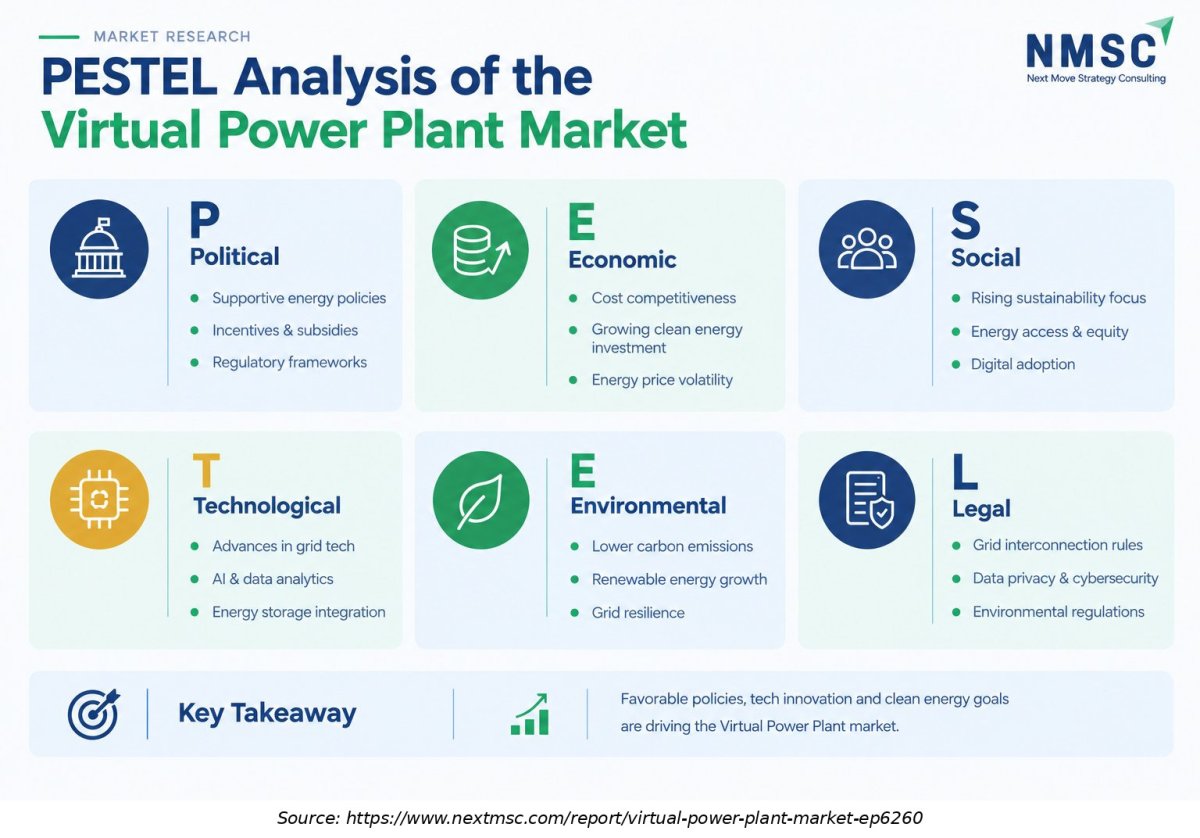
PESTEL Analysis of the Virtual Power Plant Market

PESTEL Analysis of the Virtual Power Plant Market

The virtual power plant market is shaped by government energy policies, investment trends, technological advancements, and environmental priorities. Supportive regulations and clean energy incentives encourage adoption, while energy price volatility can affect project economics. Advances in smart grids, artificial intelligence, and energy storage improve system flexibility. Data protection, grid interconnection rules, and environmental regulations remain important considerations for market participants.

Segmentation Analysis

2025 (USD Billion)
2035 (USD Billion)
Demand response 2025: $3.80 Billion | 2035: $20.40 Billion
Demand respo
Distributed generation 2025: $1.78 Billion | 2035: $11.77 Billion
Distributed
Mixed asset 2025: $2.95 Billion | 2035: $19.30 Billion
Mixed asset
Demand response $3.80 Billion $20.40 Billion 15.4%
Distributed generation $1.78 Billion $11.77 Billion 17.0%
Mixed asset $2.95 Billion $19.30 Billion 18.0%

Which Technology Segment Leads the Virtual Power Plant Market?

Demand response leads with USD 5.60 Billion in 2026, or about 44% of revenue, because utilities have run enrolment based programs for years and the control infrastructure already exists. Mixed asset is the fastest growing segment at 18.0% CAGR as batteries and electric vehicles add firm dispatch, while Distributed generation grows at 17.0%. Our findings suggest that program designs rewarding firm capacity will keep shifting spend toward mixed portfolios.

2025 (USD Billion)
2035 (USD Billion)
Software and
Hardware and
Services
Segment Item 2025 (USD Billion) 2035 (USD Billion) CAGR
Software and platform $10.0 USD Billion $40.0 USD Billion 15.0%
Hardware and controls $17.1 USD Billion $51.1 USD Billion 9.0%
Services $24.2 USD Billion $62.2 USD Billion 19.0%

Segment-wise data is locked

Unlock complete segment-wise numbers for By Offering.

Unlock Full Data
2025 (USD Billion)
2035 (USD Billion)
Residential
Commercial
Industrial
Segment Item 2025 (USD Billion) 2035 (USD Billion) CAGR
Residential $10.0 USD Billion $40.0 USD Billion 26.0%
Commercial $17.1 USD Billion $51.1 USD Billion 16.0%
Industrial $24.2 USD Billion $62.2 USD Billion 18.0%

Segment-wise data is locked

Unlock complete segment-wise numbers for By End User.

Unlock Full Data

Growth Opportunities

Our analysis shows that three structural whitespace opportunities are open to aggregators and platform vendors through 2035.

Can Capacity Contracts with Data Center Operators Create a New Revenue Class?

Large electricity users need firm capacity before new generation arrives, and Virtual Power Plant Market aggregators can supply it from enrolled devices. The June 2026 framework covering up to 16.8 GW shows buyers will contract at fleet scale. Software and platform providers and Mixed asset operators benefit most, because these contracts require verified dispatch, forecasting and settlement tools that smaller programs have not needed.

Does Residential Battery Fleet Aggregation Represent an Untapped Volume Opportunity?

Millions of home batteries sit idle outside outage events and could be enrolled at low acquisition cost. Virtual Power Plant Market aggregators that sign installers and manufacturers can add megawatts without building new sites, and stationary energy storage owners earn payments for dispatch. Residential, the fastest growing end user at 18.3% CAGR, and Services providers handling enrolment and customer support capture most of this value.

Can Emerging Utilities in Asia-Pacific and the Middle East Leapfrog into Aggregated Flexibility?

Utilities in fast growing power systems can design aggregation programs from the start rather than retrofit legacy ones. Rising solar power equipment installations create flexible assets that need orchestration, and new capacity markets can price them. Platform vendors and Distributed generation operators in the Virtual Power Plant Market across India, Saudi Arabia, Australia and China hold the strongest position to win these first contracts.

Regional Outlook

2025 (USD Billion)
2035 (USD Billion)
North Americ
Asia-Pacific
Europe
Middle East
Latin Americ
Region 2025 (USD Billion) 2035 (USD Billion) CAGR (%)
North America $10.0 USD Billion $40.0 USD Billion 9.0%
Asia-Pacific $17.1 USD Billion $51.1 USD Billion 27.0%
Europe $24.2 USD Billion $62.2 USD Billion 25.0%
Middle East & Africa $31.3 USD Billion $73.3 USD Billion 23.0%
Latin America $38.4 USD Billion $84.4 USD Billion 12.0%

Regional data is locked

Unlock complete regional numbers for this market.

Unlock Full Data

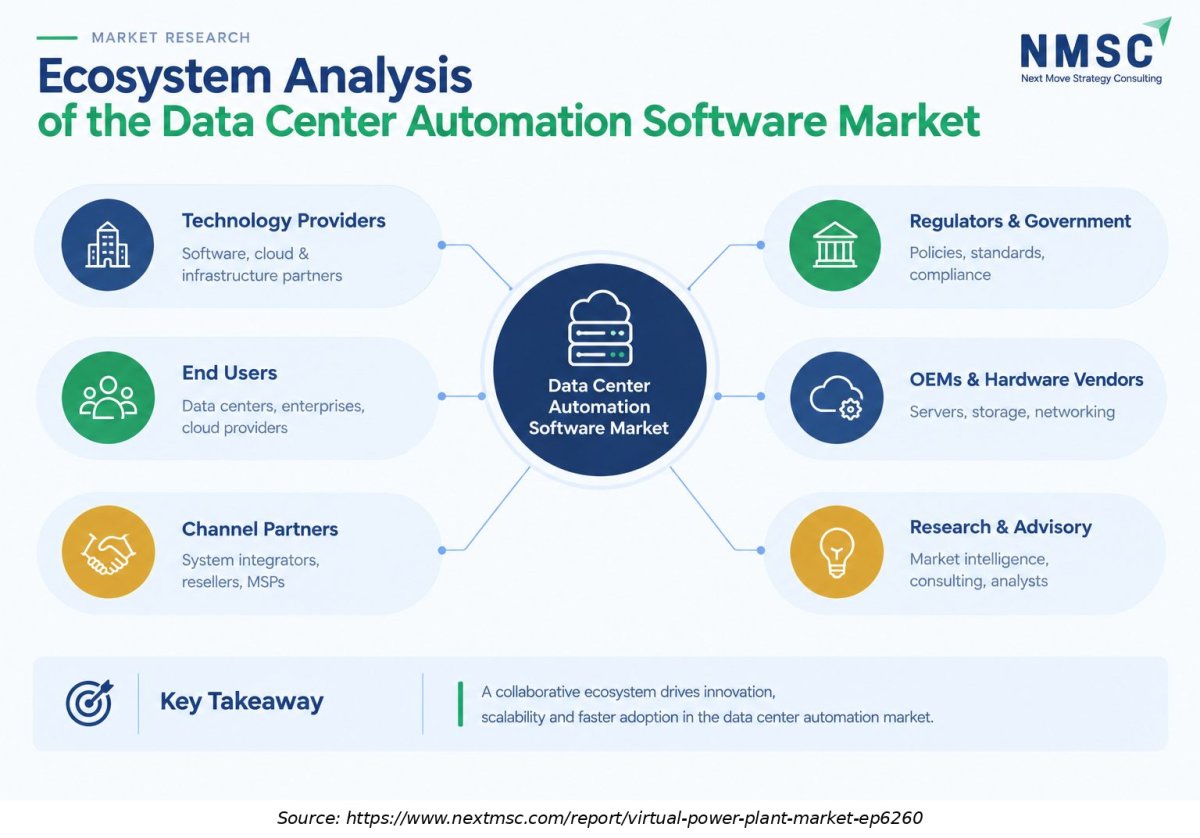
Ecosystem Analysis of the Virtual Power Plant Market

"The virtual power plant market ecosystem includes technology providers, hardware vendors, end users, channel partners, aggregators, utilities, and research organizations. Software and platform providers deliver orchestration capabilities, while hardware vendors support inverter and control integration. System integrators and managed service providers facilitate deployment and ongoing operations. Collaboration among these stakeholders enables innovation, scalability, improved operational efficiency, and broader adoption of automated data center solutions.

Competitive Landscape

Our assessment indicates that the industry is fragmented, with solar and storage owners, software specialists and energy majors each pursuing different routes to the same flexible capacity.

Dimension Description
Dimension Assessment
Market Structure Fragmented; device owners such as Tesla and Sunrun, software firms and energy majors compete, and no single provider holds a verified dominant share.
Innovation Focus AI based forecasting and dispatch, multi asset orchestration and automated bidding in wholesale markets.
M&A Activity Active consolidation: Shell owns Next Kraftwerke, Limejump and sonnen, and Uplight agreed to acquire AutoGrid from Schneider Electric.

How Do Companies Compete in the Virtual Power Plant Industry?

Competition in the Virtual Power Plant Market rests on enrolled capacity, dispatch reliability and access to buyers. Tesla and Sunrun compete through installed home fleets, while Voltus and Shell businesses compete through commercial portfolios and trading skill. Pricing is shifting from fixed enrolment payments toward revenue sharing, and we found that providers with the largest controllable fleets negotiate the strongest terms with utilities and data center buyers.

Which Competitive Archetypes Dominate the Market?

Three archetypes stand out in the Virtual Power Plant Market: hardware owners that aggregate their own installed base, software platforms sold to utilities, and energy majors that trade flexibility alongside generation. Tesla and Sunrun represent the first, Uplight and Schneider Electric the second, and Shell the third. Differentiation themes include fleet scale, forecasting accuracy and wholesale market access, and our analysis shows that archetypes increasingly partner, as the 2026 Sunrun, Tesla and Renew Home framework illustrates.

What Innovation and Differentiation Strategies Are Companies Pursuing?

Virtual Power Plant Market providers invest in machine learning for dispatch, in standard device protocols that reduce integration cost, and in settlement tools for wholesale markets. Geographic expansion follows regulatory openings, with European operators entering several countries from one trading platform. We observed that vendors able to enrol third party devices without proprietary hardware grow faster, because utilities prefer vendor neutral programs.

How Active Is M&A in the Virtual Power Plant Industry?

Consolidation has been steady. Shell acquired Limejump and sonnen in 2019 and Next Kraftwerke in 2021, building a European flexibility portfolio. Schneider Electric acquired AutoGrid, which Uplight then agreed to buy to combine customer engagement with orchestration software. During our market evaluation, we noticed that buyers target platforms with utility contracts, and we expect further deals as data center demand raises the value of enrolled fleets.

Key Market Players

NMSC's analysis indicates that the following verified companies shape competition in the sector, listed in ranked order by announced aggregation scale and verified VPP activity.

• Tesla, Inc. • Sunrun Inc. • Shell plc • Schneider Electric SE • Renew Home • Voltus • Uplight

Latest Developments

We observed that the most significant 2026 developments tie aggregators directly to data center capacity buyers.

Date Event
22 October 2026 On October 22, Voltus and Google expanded their June 2026 agreement, announcing a Google-funded virtual power plant described as 1 GW in PJM. The expansion includes an additional 1,070 MW of distributed capacity from businesses and homes, including batteries, smart thermostats and flexible industrial loads.
24 June 2026 Sunrun, Renew Home and Tesla announced a framework to aggregate over 16 GW of flexible residential energy capacity for hyperscalers and utilities. It combines hundreds of thousands of home batteries with more than 8 million smart thermostats and other devices; over 300 MW was reported as readily available in Virginia.

Investment Opportunities

Where Is Capital Flowing into the Virtual Power Plant Industry?

Capital in the Virtual Power Plant Market is flowing toward fleet scale and software. The 16.8 GW framework and the Google arrangement with Voltus show buyers committing to multi year capacity, which supports project and platform financing. Energy majors continue to fund acquisitions of aggregation platforms. Based on research conducted by NMSC, we found that investors favour recurring software revenue and contracted capacity over hardware sales alone.

Which Infrastructure Investments Support Market Expansion?

Virtual Power Plant Market expansion depends on metering, telemetry and orchestration software that let utilities see and command devices. Advanced metering infrastructure supplies settlement data, while distributed energy resource management systems link control rooms to enrolled fleets. We observed that utilities bundle these upgrades with aggregation programs, so vendors selling both software and field services gain access to larger and longer contracts.

How Do ESG Considerations Influence Investment in Virtual Power Plants?

Aggregated flexibility displaces peaker plants and lets grids absorb more renewable output, which supports emissions targets. Uplight stated that its enrolled devices equal 50 MW of flexible load, enough to avoid one peaker plant every four months. Our assessment indicates that sustainability linked financing and utility clean energy mandates will increasingly reward Virtual Power Plant Market providers that measure and report avoided emissions.

Key Benefits for Stakeholders

How Does This Report Benefit Utilities and Grid Operators?

Utilities and grid operators gain Virtual Power Plant Market forecasts by technology, offering and region, plus an assessment of Order 2222 implementation timelines. These help planners compare aggregated flexibility with peaker plants and size program budgets through 2035. The analysis also shows which providers and archetypes are active, supporting vendor selection and procurement design.

How Does This Report Benefit Investors and Financial Analysts?

Investors receive a reconciled market model showing USD 12.82 Billion in 2026 rising to USD 51.47 Billion by 2035, with segment and country growth rates. The growth matrix separates drivers from restraints, and the competitive assessment identifies consolidation patterns. Together these support valuation work, entry timing and screening of platform and fleet owners.

How Does This Report Benefit Technology Vendors and Aggregators?

Vendors and aggregators can identify the fastest growing segments, including Mixed asset at 18.0% and Services at 18.8% CAGR, and the regions where adoption is accelerating. The opportunity analysis points to data center contracts, residential batteries and emerging utilities. Product teams can use these findings to prioritise integrations, market bidding features and partnerships.

Key Market Segments Evaluated

By Technology

  • Demand response
  • Distributed generation
  • Mixed asset

By Offering

  • Software and platform
  • Hardware and controls
  • Services

By End User

  • Residential
  • Commercial
  • Industrial

By Region

  • North America 
    • U.S.
    • Canada
    • Mexico
  • Europe 
    • UK
    • Germany
    • France
    • Italy
    • Spain
    • Sweden
    • Denmark
    • Finland
    • Netherlands
    • Rest of Europe
  • Asia-Pacific 
    • China
    • India
    • Japan
    • South Korea
    • Taiwan
    • Indonesia
    • Vietnam
    • Australia
    • Philippines
    • Malaysia
    • Rest of APAC
  • Middle East & Africa 
    • Saudi Arabia
    • UAE
    • Egypt
    • Israel
    • Turkey
    • Nigeria
    • South Africa
    • Rest of MEA
  • Latin America 
    • Brazil
    • Argentina
    • Chile
    • Colombia
    • Rest of LATAM

Conclusion & Recommendations

The sector is on course to expand from USD 12.82 Billion in 2026 to USD 51.47 Billion by 2035, as aggregated flexibility becomes standard grid infrastructure. Growth should moderate from the 2026 jump toward the 16.7% forecast rate as wholesale integration matures. Our findings suggest that revenue will tilt toward software, services and mixed asset portfolios as buyers demand verified firm capacity.

Strategic Positioning Recommendations

Providers should build fleets that bundle batteries, flexible loads and generation, and invest in wholesale bidding capability ahead of Order 2222 milestones. Partnerships with installers, device makers and utilities lower enrolment cost. We recommend targeting data center capacity contracts and commercial portfolios first, then extending to residential fleets where reliable settlement data is available.

Investment Attractiveness

Attractiveness is highest in North America, which holds the largest base, and in Asia-Pacific, which grows fastest at 19.6% CAGR. Software and platform assets offer recurring revenue, while Services offers the fastest growth at 18.8%. Our assessment indicates that contracted capacity with creditworthy buyers carries lower risk than merchant exposure to wholesale prices.

Market Shifts and Key Risks

Key shifts include data center driven demand, market based revenue and consolidation among platforms. Risks include delayed wholesale access, with MISO accepted for June 2029, interoperability and cybersecurity weaknesses, and customer fatigue that raises churn. The 2026 step up in size also implies timing risk if large contracts slip, so we advise stress testing revenue assumptions.

Growth Pathways

Growth will follow three paths: larger enrolled fleets from residential and commercial batteries, deeper market participation as Order 2222 takes effect, and new regional programs in Asia-Pacific and the Middle East. Software upgrades and bundled services will raise revenue per megawatt. Based on research conducted by NMSC, we found that combined progress on all three paths is needed to reach the 2035 forecast.

FAQs

About the Author

Mihul Sharma

Mihul Sharma

Mihul Sharma is Research Associate at Next Move Strategy Consulting, where he has covered technology, industrial, and healthcare markets for 3 years. His work applies structured business research, market analysis, and secondary-source review to assess market trends, competitive developments, and growth opportunities. He supports report development by fully synthesizing industry data, company information, and market signals into concise findings for strategy and investment-focused research teams.

About the Reviewer

Supradip Baul

Supradip Baul

Supradip Baul is an accomplished business consultant and strategist with over a decade of rich experience in market intelligence, strategy, technology, and business transformation. His work has included rigorous qualitative and quantitative analysis across multiple industries, helping clients shape investment decisions and long-term roadmaps. Earlier in his career, he was associated with Gartner, where he contributed to industry-leading reports and market share analyses. He has worked with leading global companies and holds an MBA with a dual specialization in Marketing and Finance.

Download Free Sample

Ross J Mckenzie

ROSS J MCKENZIE

Business Insight Manager

Staysure Group

“Next MSC have been incredibly helpful in providing detailed & robust information on our market, alongside quantifying growth by different segments. The process to procure was simple and easy, with sample reports and regular contact to ensure we had what we needed. Succinct detail on their sources & methodologies is also greatly received, allowing transparency in this respect helps build trust in the detail you pay for. Joseph in particular was fantastic, and helped ensure efficient provision of the insight pack – thank you NMSC!”.

Diana Trejo

DIANA TREJO

Assistant Manager

Sumitomo Corporation de Mexico, S.A. de C.V.

Recently, we purchased a report on the Mexico Data Center Market from Next Move Strategy Consulting. The service has been excellent, with support that is always timely and thoroughly professional. The information provided is interesting, highly useful, and delivered with clarity. I would highly recommend NextMSC for anyone seeking insightful and dependable analysis.

Semih Kavaklioglu

SEMIH KAVAKLIOGLU

Co-Founder & Sales Manager

Decortie

I work a lot in the marketing industry and I know that research is an essential part of any campaign. I have used Market research reports for my own products and I found them to be very informative and well-researched. The team here produces insightful reports for a good price

Robert Sean Trevino

ROBERT SEAN TREVINO

Sr. Director, Head of Strategic Insights & Analytics

Foundation Medicine

I realized that it was a reliable source of information. These days, there are many people who are looking for authentic data, and this is one of the only sources that can offer them with what they need;

Gustaf Hummel Burstrom

GUSTAF HUMMEL BURSTROM

Founder

Revline Tools AB

Joseph and the team at Next Move Strategy Consulting have been excellent to work with, in supplying us with relevant market data and forecasts for our specific category. We had some special requirements and they were able to do a custom package to suit our needs. We would definitely recommend them to any other company needing market data and forecasts

Custom Market Research Services

We will customize the research for you if the listed report does not fully match your requirements.

Get 30% Free Customization

Select License

This website uses cookies to ensure you get the best experience on our website. Learn more

✖