Hyperscale Data Center Market Global Industry Analysis and Forecast (2026–2035)

Hyperscale Data Center Market size stood at USD 318.70 Billion in 2025 and should climb to USD 1,869.27 Billion by 2035 at a 16.48% CAGR from 2026 to 2035, as AI compute demand and cloud migration reinforce the lead of North America.

Download Free Sample PDF
Base Year (2025)
$318.70 Billion
Forecast (2035)
$1,869.27 Billion
CAGR (2026-2035)
16.5%
Top Region
North America

What Is the Hyperscale Data Center Market Size?

The global Hyperscale Data Center Market was valued at USD 318.70 Billion in 2025 and is estimated at USD 473.76 Billion in 2026. It is forecast to reach USD 1,869.27 Billion by 2035, expanding at a 16.48% CAGR from 2026 to 2035. North America leads with about 43.5% share, while servers and compute hold about 40.5%.

We observed that capital commitments from the largest cloud and platform operators now define the demand curve. The four biggest US operators guided to roughly USD 725 Billion of combined 2026 capital expenditure, and a rising share of it flows to campuses that host AI accelerators. Buyer concentration explains why revenue tracks delivered capacity rather than end demand, and why construction schedules, not order books, set the growth pace for suppliers.

Our analysis shows that the following takeaways capture the segments, regions and countries shaping the market through 2035.

Hyperscale Data Center Market Global Industry Analysis and Forecast (2026–2035) Revenue Forecast
Values in USD Billion

2025 $318.70 Billion
2025
2026 $473.76 Billion
2026
2027 $551.84 Billion
2027
2028 $642.78 Billion
2028
2029 $748.71 Billion
2029
2030 $872.10 Billion
2030
2031 $1,015.82 Billion
2031
2032 $1,183.22 Billion
2032
2033 $1,378.22 Billion
2033
2034 $1,605.35 Billion
2034
2035 $1,869.27 Billion
2035

Key Takeaways

By Operator Type: Cloud service providers held the largest share, expanding from USD 194.41 Billion in 2025 to USD 1,065.49 Billion by 2035; colocation and wholesale providers are the fastest growing at 18.77% CAGR from 2026–2035.

By Component: Servers and compute held the largest share, expanding from USD 127.48 Billion in 2025 to USD 803.79 Billion by 2035; cooling systems are the fastest growing at 18.34% CAGR from 2026–2035.

By Workload: Cloud services held the largest share, expanding from USD 165.72 Billion in 2025 to USD 747.71 Billion by 2035; The AI and machine learning workload is the fastest-growing workload segment, at a 20.03% CAGR from 2026 to 2035.

Dominant Region: North America generated USD 140.23 Billion in 2025 and is expected to reach USD 719.67 Billion by 2035.

Fastest-Growing Region: Asia-Pacific is advancing at 18.97% CAGR from 2026–2035, rising to USD 644.90 Billion by 2035.

Dominant Country: The U.S. is the largest national market at USD 123.40 Billion in 2025 and USD 618.92 Billion by 2035.

Fastest-Growing Country: India leads growth at 24.46% CAGR from 2026–2035, reaching USD 77.39 Billion by 2035.

Between 2026 and 2035 the market adds USD 1,395.51 Billion, an absolute opportunity that rewards early capacity investment.

According to NMSC analysis, power access has overtaken land and capital as the binding constraint on new capacity.

What Does the Hyperscale Data Center Market Encompass?
The Hyperscale Data Center Market covers purpose-built facilities that deliver very large scale compute, storage and network capacity to cloud service providers, internet platforms and the colocation partners that serve them. Campuses typically draw tens or hundreds of megawatts, run standardized designs and host dense AI clusters. The scope includes the datacenterinfrastructure inside the building, from servers and networking to power and cooling, and excludes enterprise server rooms and small edge sites.
The regulatory environment is tightening around energy, water and reporting. The European Union requires operators to report key performance indicators to a central database each year, and national grids increasingly condition interconnection on demand flexibility. Technology adoption is shifting toward liquid cooling, high voltage distribution and custom silicon, and ownership is shifting toward joint ventures that let operators build faster than their balance sheets alone would allow.

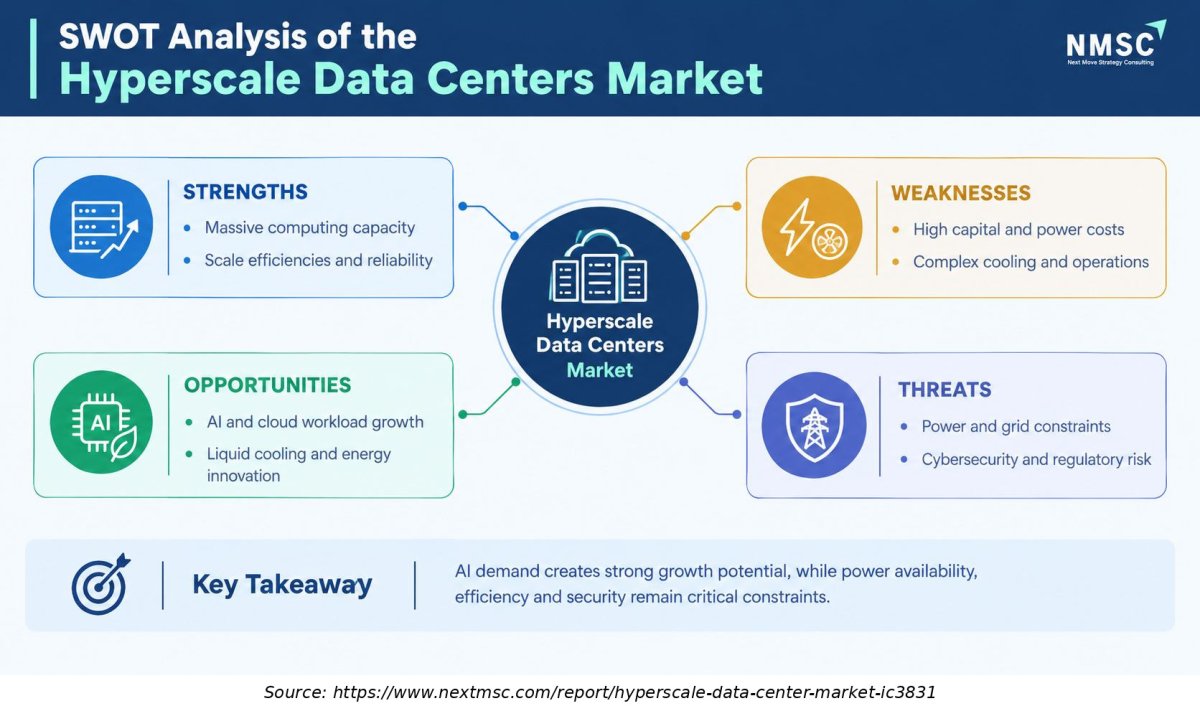
SWOT Analysis

This SWOT view highlights structural strengths, strategic gaps, expansion headroom, and external risks shaping outcomes in the Hyperscale Data Center Market Global Industry Analysis and Forecast (2026–2035).
Strengths

massive computing capacity and scale efficiencies

Weaknesses

capital expenditure, power consumption, and cooling complexity

Opportunities

AI workloads, cloud expansion, and energy innovation

Threats

grid constraints, cybersecurity risks, and regulatory challenges affecting long-term market growth

Market Drivers & Dynamics

Interactive Dataset
Surge in AI training and inference capacity driver +4.10% Global, led by North America 2026–2035
Hyperscaler capital expenditure expansion driver +3.40% North America, Asia-Pacific 2026–2030
Enterprise migration to cloud platforms driver +2.20% Global 2026–2035
Colocation and build to suit leasing models driver +1.60% North America, Europe 2026–2032
Sovereign cloud and data localization policy driver +1.30% Europe, Middle East & Africa, Asia-Pacific 2026–2033
Grid interconnection and power availability limits restraint −3.20% North America, Europe, Asia-Pacific 2026–2031
Component price inflation and supply constraints restraint −1.90% Global 2026–2028
Efficiency, water and siting regulation restraint −1.20% Europe, North America 2026–2035
Source: Next Move Strategy Consulting

Growth Drivers

What Is the Primary Growth Driver in the Hyperscale Data Center Market?

AI compute demand is the primary driver of the Hyperscale Data Center Market. Global data center electricity use is projected to reach about 945 TWh by 2030, driven by demand from AI optimized sites which is projected to more than quadruple over the forecast period. The International Energy Agency estimates that a typical AI-focused data center consumes as much electricity as approximately 100,000 households. The largest facilities under construction could consume about 20 times that amount, highlighting the importance of power availability and efficient cooling in hyperscale campus development.

How Is Cloud Adoption Driving Market Growth?

Enterprise migration keeps cloud computing demand rising even as AI draws attention. In the United States, data center electricity use rose from 58 TWh in 2014 to 176 TWh in 2023, and projections reach between 325 and 580 TWh by 2028. Operators therefore plan capacity in multiyear blocks, and the Hyperscale Data Center Market benefits because every region launch, resilience zone and storage tier adds measurable demand for new floor space.
Growth Inhibitors

What Is Restraining the Hyperscale Data Center Market?

Power availability is the principal restraint. Data Center account for close to 3% of EU electricity demand, and the European Union mandates annual performance reporting under Commission Delegated Regulation (EU) 2024/1364, increasing regulatory compliance requirements for new facility commissioning. In the United States, interconnection waits and local siting opposition delay energization. Component price inflation adds cost, so the Hyperscale Data Center Market grows more slowly in grid constrained metros than demand alone would suggest.
What Are the Growth Opportunities?

How Can Modular and Prefabricated Designs Shorten Delivery Times?

Factory built modular data centre units cut on site work and let operators energize capacity in phases. Colocation and wholesale providers that standardize these designs can deliver faster than custom builds, which is valuable where grid slots are scarce. Suppliers of prefabricated electrical and thermal skids are the main beneficiaries as repeat orders rise.

How Can Advanced Nuclear and Firm Clean Power Unlock New Sites?

Firm clean generation that sits beside a campus avoids grid queues and supports sustainability targets. Operators that sign long dated supply agreements for nuclear, geothermal or gas with capture can secure sites in regions that lack spare grid capacity. Energy developers and the cooling and power system suppliers serving those campuses benefit most. Early supply agreements also give operators price visibility across the forecast period.

How Can Sovereign and Regional Capacity Expand the Customer Base?

Public sector, financial and healthcare workloads increasingly need in country hosting. Operators that pair local partners with global design standards can win these contracts in Europe, the Gulf and Asia. Regional colocation providers and cloud operators with local regions gain the most because compliance requirements reduce price competition and lengthen contract terms.

Segmentation Analysis

2025 (USD Billion)
2035 (USD Billion)
Cloud service providers 2025: $194.41 Billion | 2035: $1,065.49 Billion
Cloud servic
Colocation and wholesale providers 2025: $78.08 Billion | 2035: $579.47 Billion
Colocation a
Internet and social platform operators 2025: $46.21 Billion | 2035: $224.31 Billion
Internet and
Cloud service providers $194.41 Billion $1,065.49 Billion 15.81%
Colocation and wholesale providers $78.08 Billion $579.47 Billion 18.77%
Internet and social platform operators $46.21 Billion $224.31 Billion 14.50%

Which Operator Types Lead the Hyperscale Data Center Market?

Cloud service providers dominate with USD 284.25 Billion in 2026, equal to 60.0% of the total market share, as major cloud platforms continue to expand hyper-scale self-build facilities. Colocation and wholesale providers are the fastest growing at 18.77% CAGR from 2026 to 2035 as cloud operators lease more finished capacity and as institutional capital funds hyperscale joint ventures. Internet and social platform operators grow more slowly but sustain large AI clusters.

2025 (USD Billion)
2035 (USD Billion)
Servers and
Storage syst
Networking e
Power system
Cooling syst
Segment Item 2025 (USD Billion) 2035 (USD Billion) CAGR
Servers and compute $10.0 USD Billion $40.0 USD Billion 13.0%
Storage systems $17.1 USD Billion $51.1 USD Billion 19.0%
Networking equipment $24.2 USD Billion $62.2 USD Billion 13.0%
Power systems $31.3 USD Billion $73.3 USD Billion 11.0%
Cooling systems $38.4 USD Billion $84.4 USD Billion 12.0%

Segment-wise data is locked

Unlock complete segment-wise numbers for By Component.

Unlock Full Data
2025 (USD Billion)
2035 (USD Billion)
Cloud servic
AI and machi
Big data ana
Content and
Segment Item 2025 (USD Billion) 2035 (USD Billion) CAGR
Cloud services $10.0 USD Billion $40.0 USD Billion 21.0%
AI and machine learning $17.1 USD Billion $51.1 USD Billion 23.0%
Big data analytics $24.2 USD Billion $62.2 USD Billion 25.0%
Content and media delivery $31.3 USD Billion $73.3 USD Billion 11.0%

Segment-wise data is locked

Unlock complete segment-wise numbers for By Workload.

Unlock Full Data

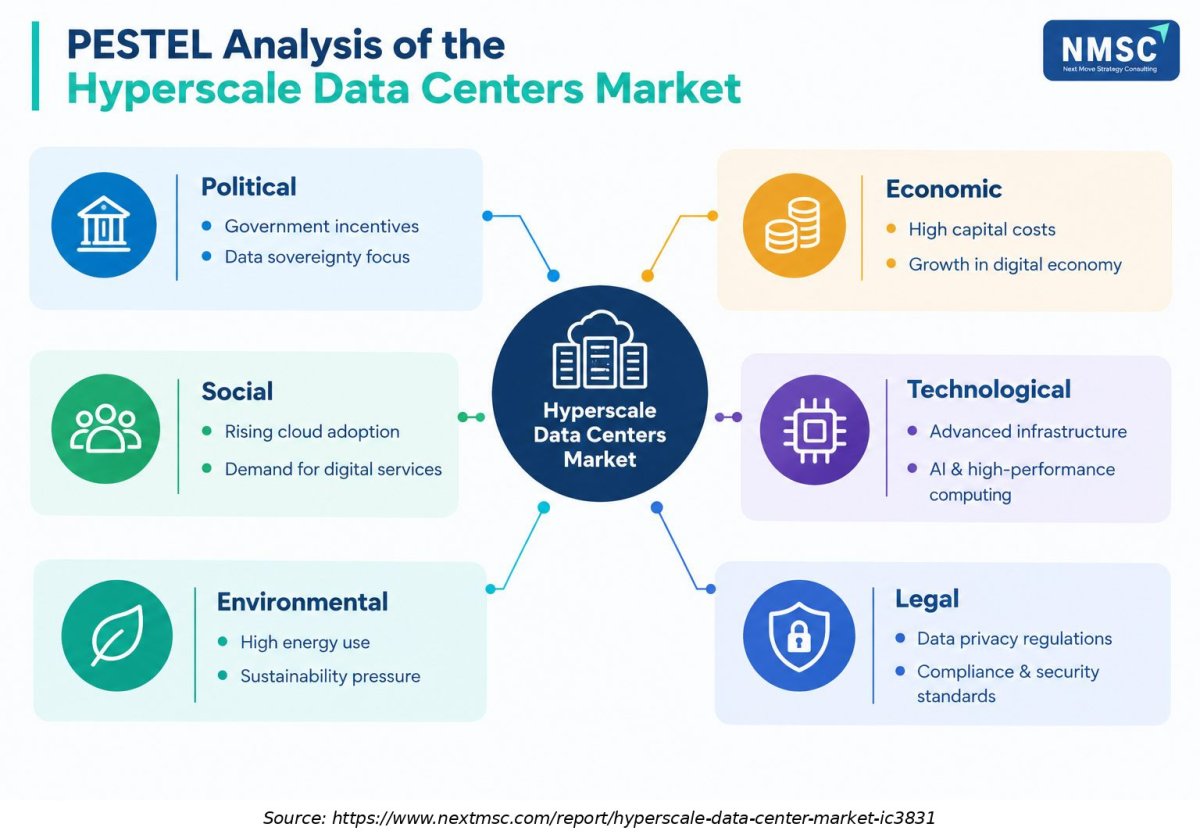
PESTEL Analysis of the Hyperscale Data Center Market

PESTEL Analysis of the Hyperscale Data Center Market

The infographic illustrates the PESTEL factors influencing the hyperscale data Center market across political, economic, social, technological, environmental, and legal dimensions. It highlights government incentives, capital investment, cloud adoption, AI computing advancements, energy consumption, and data privacy requirements. These external factors shape infrastructure development, operational efficiency, regulatory compliance, and investment decisions across the global hyperscale data center industry.

Growth Opportunities

During our market evaluation, we noticed that three opportunities offer the clearest route to share gains.

How Can Modular and Prefabricated Designs Shorten Delivery Times?

Factory built modular data centre units cut on site work and let operators energize capacity in phases. Colocation and wholesale providers that standardize these designs can deliver faster than custom builds, which is valuable where grid slots are scarce. Suppliers of prefabricated electrical and thermal skids are the main beneficiaries as repeat orders rise.

How Can Advanced Nuclear and Firm Clean Power Unlock New Sites?

Firm clean generation that sits beside a campus avoids grid queues and supports sustainability targets. Operators that sign long dated supply agreements for nuclear, geothermal or gas with capture can secure sites in regions that lack spare grid capacity. Energy developers and the cooling and power system suppliers serving those campuses benefit most. Early supply agreements also give operators price visibility across the forecast period.

How Can Sovereign and Regional Capacity Expand the Customer Base?

Public sector, financial and healthcare workloads increasingly need in country hosting. Operators that pair local partners with global design standards can win these contracts in Europe, the Gulf and Asia. Regional colocation providers and cloud operators with local regions gain the most because compliance requirements reduce price competition and lengthen contract terms.

Regional Outlook

2025 (USD Billion)
2035 (USD Billion)
North Americ
Europe
Asia-Pacific
Middle East
Latin Americ
Region 2025 (USD Billion) 2035 (USD Billion) CAGR (%)
North America $10.0 USD Billion $40.0 USD Billion 9.0%
Europe $17.1 USD Billion $51.1 USD Billion 27.0%
Asia-Pacific $24.2 USD Billion $62.2 USD Billion 25.0%
Middle East & Africa $31.3 USD Billion $73.3 USD Billion 23.0%
Latin America $38.4 USD Billion $84.4 USD Billion 12.0%

Regional data is locked

Unlock complete regional numbers for this market.

Unlock Full Data

Competitive Landscape

We found that competition rewards power access, delivery speed and balance sheet strength more than product differentiation.

Dimension Description
Market Structure Concentrated at the top, with cloud and platform operators self building and colocation providers acting as capacity partners.
Innovation Focus AI accelerator clusters, liquid cooling, high voltage power distribution and custom silicon.
M&A Activity Active portfolio deals and private capital partnerships, including Digital Realty's agreed June 2026 purchase of three Northern Virginia assets.

How Do Companies Compete in the Hyperscale Data Center Market?

Companies compete on delivered megawatts, time to energization and cost per megawatt. Cloud operators self build where scale and control justify capital, and lease where speed matters. Colocation providers compete on site pipelines, power rights and customer relationships. Geographic expansion follows power availability and regulation, and pricing reflects long dated leases that favor tenants with investment grade credit in the Hyperscale Data Center Market.

Which Operator Archetypes Dominate the Hyperscale Data Center Market?

Three archetypes dominate. Global cloud service providers set demand and technology standards. Internet and social platform operators build private AI and content capacity at massive scale. Colocation and wholesale providers, such as Digital Realty and Equinix, supply campuses and connectivity. Differentiation themes include sovereign compliance, interconnection density, sustainability credentials and the ability to host liquid cooled AI racks.

What Innovation and Differentiation Strategies Are Shaping Competition?

Operators differentiate through custom silicon, liquid cooling, standardized campus designs and firm power sourcing. Colocation providers market architectures built for dense AI deployments and connect them to cloud on ramps and network hubs. Vendors compete by shortening commissioning time, and the strongest players integrate power, cooling and software controls so customers can raise utilization without adding space.

Key Market Players

NMSC's analysis indicates that the following operators hold the leading positions in installed and committed hyperscale capacity, listed in ranked order.

Amazon.com, Inc. Microsoft Corporation Alphabet Inc. Meta Platforms, Inc. Alibaba Group Holding Limited Oracle Corporation Tencent Holdings Limited Digital Realty Trust, Inc. Equinix, Inc. Huawei Investment & Holding Co., Ltd. Nippon Telegraph and Telephone Corporation CoreWeave, Inc. China Telecom Corporation Limited

Latest Developments

Our findings suggest that recent announcements concentrate on capital commitments, portfolio transactions and regulation.

Date Event
August 2026 Amazon increased its planned investment in northwest Louisiana from USD 12 billion to USD 18 billion, adding a third data center campus in the Shreveport area to expand infrastructure supporting cloud computing and AI workloads.
July 2026 Microsoft reported quarterly capital expenditures of USD 41 billion for the quarter ended June 30, 2026, reflecting approximately 70% year-over-year growth as the company expanded AI computing capacity, including data center infrastructure and specialized processors.
June 2026 Digital Realty agreed to acquire Blackstone's interests in three fully leased Northern Virginia hyperscale data Center totaling 288 MW of IT capacity, representing a gross asset value of USD 7.8 billion and strengthening its position in a major U.S. data center market.
February 2026 Amazon Web Services announced plans to invest USD 12 billion in data center campuses across northwest Louisiana, expanding its cloud infrastructure footprint and supporting growing demand for cloud computing and AI services.

Investment Opportunities

What Capital Inflows Are Supporting the Hyperscale Data Center Market?

Capital inflows come from operator balance sheets, listed property trusts and private infrastructure funds. Digital Realty reported about USD 10 Billion available to support hyperscale development, and joint ventures draw sovereign and pension investors. Stabilized, fully leased campuses were priced at an expected initial yield above 6.5% in the Northern Virginia transaction, so investors can price risk against creditworthy tenants.

How Is Infrastructure Investment Shaping Capacity?

Infrastructure spending now extends beyond buildings to substations, transmission, onsite generation and storage. Operators that fund grid upgrades gain faster energization and community support. Opportunities exist for long duration storage, firm clean generation and fiber routes that connect new campuses, and investors that bundle these assets with data center development can capture more of the value created per megawatt.

How Do ESG Considerations Influence Investment Decisions?

ESG criteria increasingly determine which projects secure financing and permits. Efficiency labels, water use disclosure and clean power sourcing are moving from voluntary pledges to regulatory requirements in Europe. Operators that document power usage effectiveness, water efficiency and heat reuse reduce permitting risk and attract lower cost capital, which strengthens returns for the Hyperscale Data Center Market over the full forecast period.

Key Benefits for Stakeholders

How Does the Report Benefit Enterprise and Industry Leaders?

Enterprise and industry leaders gain a clear view of capacity supply, regional pricing pressure and sovereign hosting options. The forecasts and segment data help them time commitments, choose between cloud regions and colocation, and judge whether to secure capacity early. The analysis also clarifies which workloads will absorb the largest share of new capacity through 2035.

What Value Does It Offer Investors and Financial Analysts?

Investors and financial analysts receive reconciled segment, regional and country forecasts that support underwriting. The report links growth to power access, lease structures and capital expenditure cycles, and it shows where returns are most exposed to energy and component costs. Analysts can use the competitive assessment to compare operator archetypes and judge portfolio quality.

How Can Technology Vendors and Infrastructure Suppliers Use the Insights?

Technology vendors and infrastructure suppliers can align product roadmaps with the fastest growing components and regions. The analysis highlights rising demand for liquid cooling, high voltage power distribution and optical connectivity, and it shows how colocation partners are becoming major buyers. Suppliers can prioritize accounts and regions where delivery schedules are most compressed.

Key Market Segments Evaluated

By Operator Type

  • Cloud service providers
  • Colocation and wholesale providers
  • Internet and social platform operators

By Component

  • Servers and compute
  • Storage systems
  • Networking equipment
  • Power systems
  • Cooling systems

By Workload

  • Cloud services
  • AI and machine learning
  • Big data analytics
  • Content and media delivery

By Region

  • North America 
    • U.S.
    • Canada
    • Mexico
  • Europe 
    • UK
    • Germany
    • France
    • Italy
    • Spain
    • Sweden
    • Denmark
    • Finland
    • Netherlands
    • Rest of Europe
  • Asia-Pacific 
    • China
    • India
    • Japan
    • South Korea
    • Taiwan
    • Indonesia
    • Vietnam
    • Australia
    • Philippines
    • Malaysia
    • Rest of APAC
  • Middle East & Africa 
    • Saudi Arabia
    • UAE
    • Egypt
    • Israel
    • Turkey
    • Nigeria
    • South Africa
    • Rest of MEA
  • Latin America 
    • Brazil
    • Argentina
    • Chile
    • Colombia
    • Rest of LATAM

Conclusion & Recommendations

The outlook is strongly positive. The market is expected to grow from USD 473.76 Billion in 2026 to USD 1,869.27 Billion by 2035, with AI workloads, cloud migration and sovereign programs sustaining demand. Growth will be uneven across regions because power access varies widely, so the strongest results should come from operators that can deliver energized capacity on schedule in the markets where grids can support them.

What Are the Strategic Positioning Recommendations?

Operators should secure power and land early, standardize campus designs and adopt liquid cooling as a baseline. Colocation providers should pursue private capital partnerships to extend delivery capacity, and cloud operators should balance self build and leasing. Suppliers should focus on prefabricated power and cooling modules and on service models that shorten commissioning.

How Strong Is the Investment Attractiveness of the Hyperscale Data Center Market?

Investment attractiveness is high but selective. Long dated leases to investment grade tenants support stable yields, and the forecast absolute opportunity is large. Returns depend on power access, construction execution and component costs, so investors should favor platforms with secured energy, diversified tenants and a track record of delivering campuses on time.

What Are the Market Shifts and Key Risks?

Key shifts include denser AI racks, liquid cooling, higher voltage power and a rising role for joint ventures. The main risks are grid delays, component price inflation, tighter efficiency rules and local opposition to new campuses. A slowdown in AI monetization would also pause leasing, so operators should keep flexible phasing and avoid concentrating exposure in a single metro.

What Are the Growth Pathways Through 2035?

Growth pathways run through AI inference capacity, sovereign and regional builds, firm clean power and modular delivery. Asia-Pacific and the Middle East and Africa offer the fastest regional expansion, while North America keeps the largest base. Colocation and wholesale providers and cooling systems are the fastest growing segments, and operators aligned with them are best placed to capture incremental demand.

Delivered Customizations

We have successfully delivered the following deep-dive customizations:

Client Request Customization Delivered Value Adds
Country-Level Trade Assessment
  • Country-wise import and export analysis of data center servers, networking equipment, and power and cooling components using HS-coded trade data.
  • Identifies sourcing concentration risks and supplier-country dependencies for hardware and infrastructure procurement.
Historical Capacity and Investment Growth Analysis
  • Historical revenue, investment, and capacity-addition analysis of hyperscale data centers by operator type from company filings and public disclosures.
  • Shows which operator categories drove past capacity growth, supporting timing and scale decisions for market entry or expansion.
Addressable Market Sizing by Operator and Workload
  • Segment-level TAM and SAM estimates across operator types, components, and workload categories.
  • Prioritizes the operator and workload pools with the largest serviceable opportunity for product and go-to-market focus.
AI and Cloud Workload Capacity Transition Mapping
  • Mapping of capacity and power-density shifts between AI training, AI inference, and general cloud workloads, based on company capex and facility disclosures.
  • Guides facility design, cooling, and power-equipment investment toward the rack densities and workloads gaining share.
Hyperscale Campus Power Pipeline and Grid Interconnection Assessment
  • Assessment of announced hyperscale campus MW pipelines by operator and region against utility and grid interconnection queue data.
  • Highlights regions where power availability will gate deployment timing, informing site selection and partnership priorities.
Build Versus Lease Economics Benchmarking
  • Benchmarking of self-build versus leased hyperscale capacity economics, including lease rates per kW and capacity mix by operator type.
  • Supports capacity-sourcing strategy and pricing decisions for operators and colocation providers.

FAQs

About the Author

Mayurima Roy

Mayurima Roy

Mayurima Roy is Research Analyst at Next Move Strategy Consulting, where she has spent 4 years working across the firm's full industry coverage rather than a single fixed vertical. Her work centers on structured research, ongoing trend tracking, competitive assessment, and insight-led content development, translating complex market data into clear, decision-ready narratives that support informed client decision-making across diverse global industries, market sectors, and world regions every day.

About the Reviewer

Supradip Baul

Supradip Baul

Supradip Baul is an accomplished business consultant and strategist with over a decade of rich experience in market intelligence, strategy, technology, and business transformation. His work has included rigorous qualitative and quantitative analysis across multiple industries, helping clients shape investment decisions and long-term roadmaps. Earlier in his career, he was associated with Gartner, where he contributed to industry-leading reports and market share analyses. He has worked with leading global companies and holds an MBA with a dual specialization in Marketing and Finance.

Download Free Sample

Diana Trejo

DIANA TREJO

Assistant Manager

Sumitomo Corporation de Mexico, S.A. de C.V.

Recently, we purchased a report on the Mexico Data Center Market from Next Move Strategy Consulting. The service has been excellent, with support that is always timely and thoroughly professional. The information provided is interesting, highly useful, and delivered with clarity. I would highly recommend NextMSC for anyone seeking insightful and dependable analysis.

Gaurav Jaiswal

GAURAV JAISWAL

Founder & CEO

Yano Charge Private Limited

The EV Charging market research report provided by the NextMSC was exceptionally detailed and insightful. It offered a comprehensive analysis that proved to be a game-changer for our strategic planning. Truly a testament to the NextMSC’s expertise and thoroughness in EV market landscape & analysis.

Melanie Samko

MELANIE SAMKO

Director of Marketing

TOSOH BIOSCIENCE, INC.

The information provided by NMSC is incredibly valuable, thank you so much for such a excellent work. I really appreciate it. I will make sure to reference all of it, in my summary document.

Mohit Agarwal

MOHIT AGARWAL

Chief Manager

DryChem India Pvt. Ltd.

Next Move Strategy Consulting is an amazing team of consultants. We required a market study report for our investors on top priority and the team went above and beyond our expectations to deliver the same with ample supporting data within a short time span enabling us to secure the investments and keep our project timeline maintained. Their professionalism, attention to detail, and timely delivery of actionable recommendations have left a lasting impression on our organization.

Robert Sean Trevino

ROBERT SEAN TREVINO

Sr. Director, Head of Strategic Insights & Analytics

Foundation Medicine

I realized that it was a reliable source of information. These days, there are many people who are looking for authentic data, and this is one of the only sources that can offer them with what they need;

Custom Market Research Services

We will customize the research for you if the listed report does not fully match your requirements.

Get 30% Free Customization

Select License

This website uses cookies to ensure you get the best experience on our website. Learn more

✖