Wave Machines Market Global Industry Analysis and Forecast (2026–2035)

Wave Machines Market size was USD 318.60 Million in 2025, projected to reach USD 1,029.43 Million by 2035, growing at a CAGR of 12.4% from 2026 to 2035. Key drivers include a widening pipeline of commercial surf lagoons, Gulf investment in surf-anchored destinations, and the shift toward programmable multizone wave systems, with North America leading the global market.
Download Free Sample PDF
Base Year (2025)
$318.60 Billion
Forecast (2035)
$1,029.43 Billion
CAGR (2026-2035)
12.4%
Top Region
North America

What Is the Wave Machines Market Size?

The global Wave Machines Market reached USD 318.60 Million in 2025 and is estimated at USD 359.50 Million in 2026, forecast to reach USD 1,029.43 Million by 2035 at a CAGR of 12.4%. North America leads with approximately 36% revenue share, while Mechanical Systems is the dominant technology at approximately 34%.

We observed that the industry is moving from prototype delivery to repeatable commercial supply. Surf parks, waterparks, and resorts now buy wave systems against defined performance specifications. Suppliers increasingly earn recurring revenue from licensing, wave programming updates, and maintenance contracts alongside initial equipment sales.

Wave Machines Market Global Industry Analysis and Forecast (2026–2035) Revenue Forecast

Values in USD Billion

2025 $0.32 Billion
2025
2026 $0.36 Billion
2026
2027 $0.40 Billion
2027
2028 $0.45 Billion
2028
2029 $0.51 Billion
2029
2030 $0.57 Billion
2030
2031 $0.64 Billion
2031
2032 $0.72 Billion
2032
2033 $0.81 Billion
2033
2034 $0.92 Billion
2034
2035 $1.03 Billion
2035

Key Takeaways

By Technology: Mechanical Systems held the largest share, expanding from USD 108.32 Million in 2025 to USD 380.90 Million by 2035; Mechanical Systems is the fastest-growing at 13.35% CAGR from 2026–2035.

By Offering: Equipment held the largest share, expanding from USD 223.02 Million in 2025 to USD 658.84 Million by 2035; Services is the fastest-growing at 14.45% CAGR from 2026–2035.

By Facility Type: Surf Parks held the largest share, expanding from USD 121.07 Million in 2025 to USD 483.83 Million by 2035; Surf Parks is the fastest-growing at 14.79% CAGR from 2026–2035.

By Installation Setting: Outdoor held the largest share, expanding from USD 210.28 Million in 2025 to USD 700.01 Million by 2035; Outdoor is the fastest-growing installation setting at 12.74% CAGR from 2026–2035.

By Water Type: Freshwater held the largest share, expanding from USD 261.25 Million in 2025 to USD 782.37 Million by 2035; Saltwater is the fastest-growing water type at 15.63% CAGR from 2026–2035.

By Sales Channel: Direct held the largest share, expanding from USD 175.23 Million in 2025 to USD 494.13 Million by 2035; Licensing Partner Led is the fastest-growing channel at 16.17% CAGR from 2026–2035.

Dominant Region: North America dominated with approximately 36% revenue share in 2025 at USD 114.70 Million, anchored by early commercial lagoons and a deep pipeline of mixed use surf parks.

Fastest-Growing Region: Middle East & Africa is expected to register the highest CAGR of 15.22% during 2026–2035, driven by Saudi Arabia, the UAE and Bahrain destination projects.

Dominant Country: The U.S. led the market with an estimated USD 100.93 Million in 2025, supported by Atlantic Park, DSRT Surf and the BSR facility in Waco.

Fastest-Growing Country: Saudi Arabia is projected to expand from USD 16.06 Million in 2025 at a CAGR of approximately 17.0%, driven by the Aquarabia and ADRENA lagoons and further destination projects.

The Wave Machines Market presents an absolute investment opportunity of approximately USD 669.93 Million between 2026 and 2035, calculated as the difference between the 2035 forecast of USD 1,029.43 Million and the 2026 base of USD 359.50 Million, which makes licensed technology and aftermarket services the most capital-efficient categories for equipment investors.

According to NMSC analysis, the rise of licensing-partner-led sales is the most structurally significant shift. Technology owners that separate intellectual property from construction risk can serve more projects at once, while developers gain a proven wave specification without building supplier capability in-house.

Ecosystem Analysis of the Wave Machines Market Industry

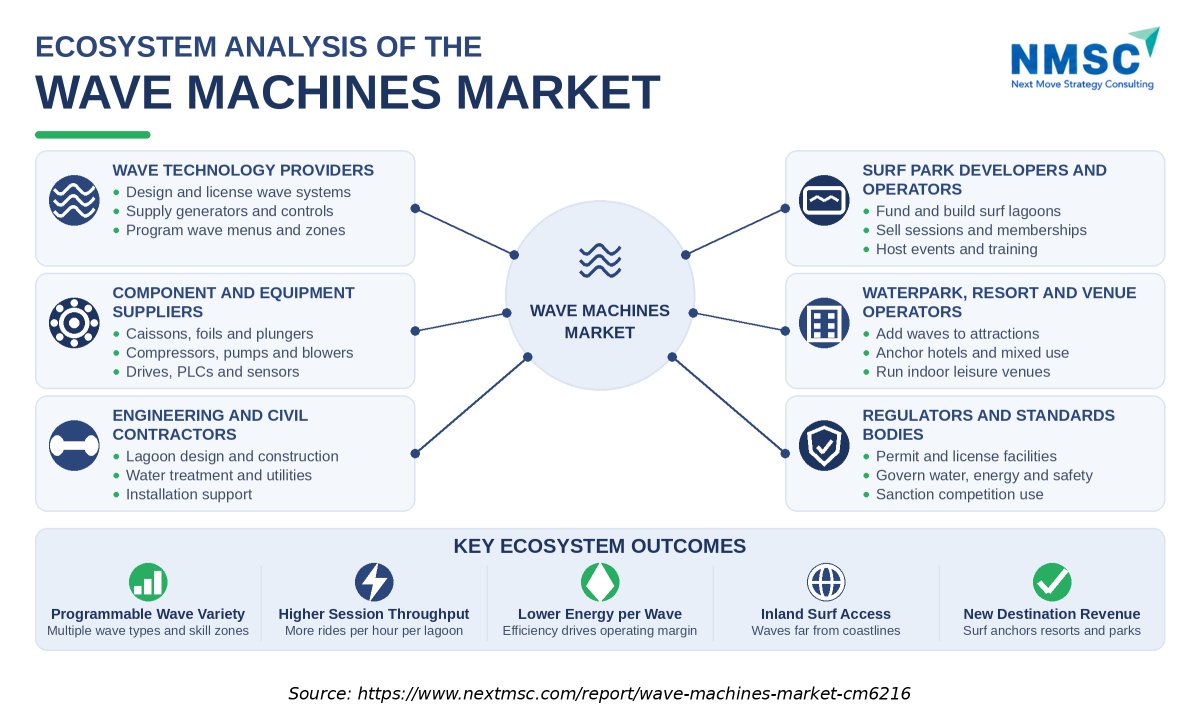
Figure 1: Ecosystem Analysis of the Wave Machines Market Industry

The above infographic maps the ecosystem around artificial wave generation across six stakeholder groups: technology providers, component suppliers, engineering contractors, surf park developers and operators, waterpark and resort operators, and regulators. It shows that value is created where wave performance, civil delivery and venue economics meet, and that outcomes such as wave variety, throughput and destination revenue depend on coordination between suppliers, builders and operators rather than on equipment alone.

What does the Wave Machines Market Encompass?

The Wave Machines Market covers supplier revenue from artificial wave generation systems that create surfable or rideable waves in pools, lagoons, lakes and channels for recreation, resorts and training. It includes pneumatic, mechanical, standing wave and pump and release systems, together with control software, installation, licensing and maintenance. It excludes wave energy converters, laboratory wave tanks, facility construction and park operations, so revenue is measured where system suppliers invoice developers and operators.
The category has progressed from single prototype lagoons toward a commercial pipeline, with roughly 34 wave pools operating worldwide in early 2026 and more than a dozen projects scheduled to open during the year. Planning approvals, water use permits and aquatic safety codes shape project timing, while programmable wave control, split zones and saltwater operation are raising buyer expectations for system performance.

Market Drivers & Dynamics

Interactive Dataset
Expanding pipeline of commercial surf lagoons from proven technologies driver +3.1% Global 2026–2035
Gulf destination investment in surf anchored attractions driver +2.3% Middle East & Africa 2026–2032
Licensing models separating technology from construction risk driver +1.6% Global 2026–2033
Hospitality and real estate schemes using waves as anchor amenities driver +1.4% North America, Europe, Asia-Pacific 2026–2033
Compact and indoor systems opening private and urban sites driver +0.9% North America, Europe 2026–2031
High capital cost and long permitting cycles for lagoon projects restraint −1.5% Global 2026–2035
Project delays and cancellations at developer level restraint −1.0% North America, Asia-Pacific 2026–2032
Energy and water use scrutiny for large lagoons restraint −0.6% Europe, Middle East & Africa 2026–2031
Source: Next Move Strategy Consulting

Growth Drivers

What Is the Primary Growth Driver in the Wave Machines Market?

The expanding pipeline of commercial surf lagoons is the primary driver. Wavegarden said in April 2026 that it operates 12 facilities, with 23 projects in development and an estimated 50 more in planning, against roughly 34 wave pools operating worldwide. Based on research conducted by NMSC, we found that supplier order books already exceed the installed base, which supports Surf Parks growth at 14.79% CAGR and positions commissioning capacity as the near term constraint on revenue.

How Is Gulf Destination Investment Driving Demand?

Gulf developers are buying wave systems as anchor attractions inside much larger destinations. Endless Surf’s lagoon at Aquarabia sits within Qiddiya City, which the company describes as a $750 billion destination, and its ES36 lagoon opened at ADRENA on The Red Sea on March 1, 2026. We observed that Bahrain’s Wavegarden Cove, designed for up to 90 surfers and 1,000 waves per hour, extends the pattern, creating large single orders with strong delivery visibility.

Growth Inhibitors

What Is Restraining the Market?

The primary restraint is the capital intensity of lagoon projects and the delivery risk that follows. Wavegarden’s indicative appraisal for southern Europe puts total development cost at €25 million to €40 million, of which €10 million to €25 million covers the lagoon, wave generator and water treatment. During our market evaluation, we noticed that financing and permitting delays stall projects, and several Kelly Slater Wave Company projects in Japan, the Coachella Valley and Florida have been discontinued.

Segmentation Analysis

2025 (USD Billion)
2035 (USD Billion)
Pneumatic Systems 2025: $89.21 Billion | 2035: $298.53 Billion
Pneumatic Sy
Mechanical Systems 2025: $108.32 Billion | 2035: $380.90 Billion
Mechanical S
Foil Systems 2025: $76.46 Billion | 2035: $257.37 Billion
Foil Systems
Displacement Systems 2025: $31.86 Billion | 2035: $123.53 Billion
Displacement
Standing Wave Systems 2025: $73.28 Billion | 2035: $195.59 Billion
Standing Wav
Pump and Release Systems 2025: $47.79 Billion | 2035: $154.41 Billion
Pump and Rel
Pneumatic Systems $89.21 Billion $298.53 Billion 12.79%
Mechanical Systems $108.32 Billion $380.90 Billion 13.35%
Foil Systems $76.46 Billion $257.37 Billion 12.86%
Displacement Systems $31.86 Billion $123.53 Billion 14.45%
Standing Wave Systems $73.28 Billion $195.59 Billion 10.25%
Pump and Release Systems $47.79 Billion $154.41 Billion 12.40%

Which Wave Technologies Are Winning Share in the Market?

Mechanical Systems lead with USD 108.32 Million in 2025 and are also the fastest growing parent at 13.35% CAGR, with Displacement Systems the fastest sub-segment at 14.45%. We found that electromechanical foil systems such as Wavegarden’s Cove hold the largest installed base, while pneumatic suppliers including Endless Surf and Surf Loch scale through large Gulf and waterpark projects.

2025 (USD Billion)
2035 (USD Billion)
Equipment
Wave Generat
Control and
Services
Installation
Segment Item 2025 (USD Billion) 2035 (USD Billion) CAGR
Equipment $10.0 USD Billion $40.0 USD Billion 25.0%
Wave Generation Hardware $17.1 USD Billion $51.1 USD Billion 11.0%
Control and Monitoring Systems $24.2 USD Billion $62.2 USD Billion 25.0%
Services $31.3 USD Billion $73.3 USD Billion 11.0%
Installation and Commissioning $38.4 USD Billion $84.4 USD Billion 16.0%

Segment-wise data is locked

Unlock complete segment-wise numbers for By Offering.

Unlock Full Data

How Is Revenue Splitting Between Equipment and Services?

Equipment is the dominant offering at USD 223.02 Million in 2025, led by Wave Generation Hardware, while Services grows fastest at 14.45% CAGR. Licensing and Design is the fastest sub-segment at 15.97%. NMSC’s analysis indicates that technology owners now license wave systems to local developers, as Kelly Slater Wave Company did for Surf Abu Dhabi, which turns a one-time sale into royalty and upgrade income.

2025 (USD Billion)
2035 (USD Billion)
Surf Parks
Water Parks
Resorts and
Entertainmen
Residential
Segment Item 2025 (USD Billion) 2035 (USD Billion) CAGR
Surf Parks $10.0 USD Billion $40.0 USD Billion 27.0%
Water Parks $17.1 USD Billion $51.1 USD Billion 9.0%
Resorts and Hotels $24.2 USD Billion $62.2 USD Billion 19.0%
Entertainment Venues $31.3 USD Billion $73.3 USD Billion 17.0%
Residential and Private $38.4 USD Billion $84.4 USD Billion 18.0%

Segment-wise data is locked

Unlock complete segment-wise numbers for By Facility Type.

Unlock Full Data

Which Facility Types Anchor Demand for Wave Machines?

Surf Parks are both dominant and fastest growing, expanding from USD 121.07 Million in 2025 to USD 483.83 Million by 2035 at 14.79% CAGR. Our findings suggest that mixed use schemes drive this, as shown by the $350 million Atlantic Park development in Virginia Beach, where a 46 module Wavegarden Cove anchors retail and hospitality. Water Parks remain the second largest facility type but grow more slowly at 10.15%.

2025 (USD Billion)
2035 (USD Billion)
Outdoor
Indoor
Segment Item 2025 (USD Billion) 2035 (USD Billion) CAGR
Outdoor $10.0 USD Billion $40.0 USD Billion 14.0%
Indoor $17.1 USD Billion $51.1 USD Billion 24.0%

Segment-wise data is locked

Unlock complete segment-wise numbers for By Installation Setting.

Unlock Full Data
2025 (USD Billion)
2035 (USD Billion)
Freshwater
Saltwater
Segment Item 2025 (USD Billion) 2035 (USD Billion) CAGR
Freshwater $10.0 USD Billion $40.0 USD Billion 24.0%
Saltwater $17.1 USD Billion $51.1 USD Billion 22.0%

Segment-wise data is locked

Unlock complete segment-wise numbers for By Water Type.

Unlock Full Data
2025 (USD Billion)
2035 (USD Billion)
Direct
Licensing Pa
Integrator L
Segment Item 2025 (USD Billion) 2035 (USD Billion) CAGR
Direct $10.0 USD Billion $40.0 USD Billion 23.0%
Licensing Partner Led $17.1 USD Billion $51.1 USD Billion 9.0%
Integrator Led $24.2 USD Billion $62.2 USD Billion 19.0%

Segment-wise data is locked

Unlock complete segment-wise numbers for By Sales Channel.

Unlock Full Data

Supply Chain Analysis of the Wave Machines Market Industry

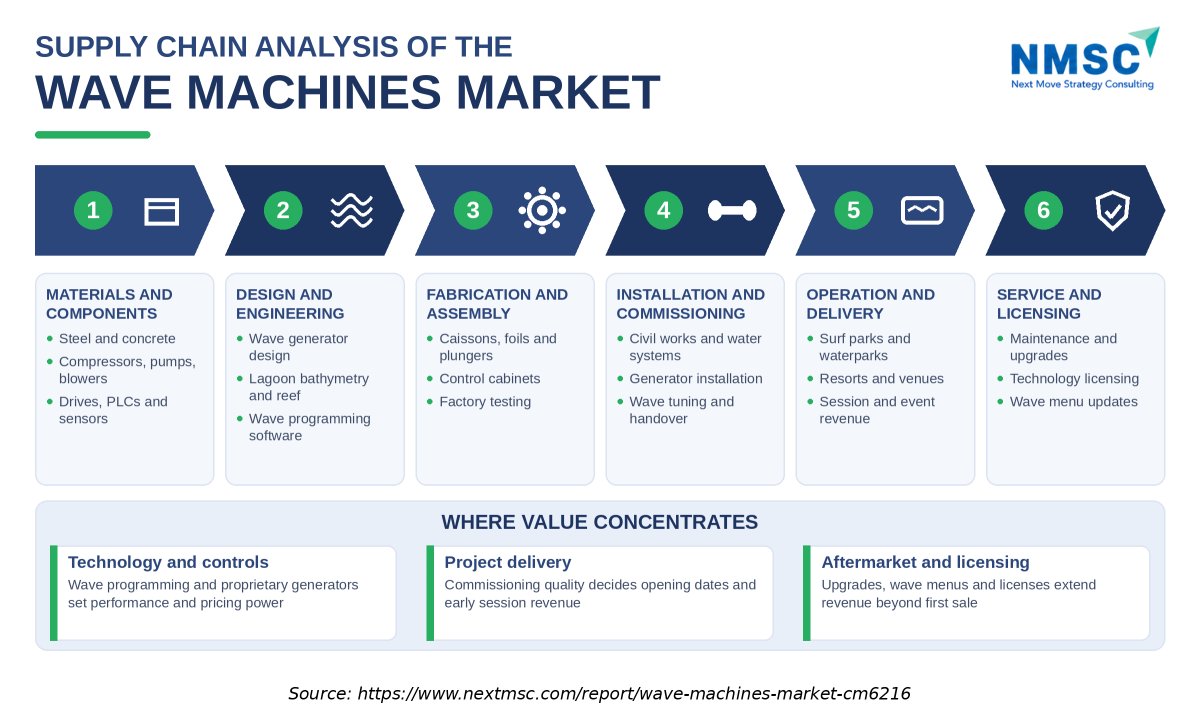
Supply Chain Analysis of the Wave Machines Market Industry
Figure 2: Supply Chain Analysis of the Wave Machines Market Industry
The above infographic traces the supply chain from steel, concrete and mechanical components through wave system design, fabrication, site installation, venue operation and long term service. It indicates that value concentrates in proprietary generators, controls and wave programming, in commissioning quality that determines opening dates, and in aftermarket and licensing income, which gives suppliers with strong engineering and delivery capability a durable advantage over assemblers of standard parts.

Growth Opportunities

Our assessment indicates that three whitespace opportunities are positioned to generate disproportionate revenue for suppliers that commit capacity ahead of buyer demand.

Can Gulf Destination Projects Become the Anchor Demand Pool?

Giga project developers buy large lagoons as integrated attractions, which creates single orders worth far more than a typical park. The mechanism is bundled delivery inside waterparks and resort districts, benefiting the Saltwater segment and Surf Parks. Aquarabia opened in April 2026 and ADRENA on March 1, 2026. Realization depends on suppliers delivering on schedule and sustaining wave quality, with Saudi Arabia projected to grow at 17.0% CAGR.

Does Technology Licensing Unlock Faster Scaling Than Direct Sales?

Licensing lets technology owners serve many projects without carrying construction risk. The mechanism is a licence for wave generation intellectual property, paired with design support and royalties, benefiting the Licensing Partner Led channel growing at 16.17% CAGR. Kelly Slater Wave Company licensed its technology to Surf Abu Dhabi, which operated in 2025. Success requires strict quality control so that licensed lagoons protect the originator’s performance reputation.

Can Compact Systems Open Residential and Urban Sites?

Compact wave systems address developers who lack land for a full lagoon. The mechanism is smaller pools with high ride frequency, benefiting Residential and Private installations growing at 14.45% CAGR and the Indoor setting. Surf Loch’s GT100 targets private residences, boutique resorts and indoor sites. Realization depends on power access, water treatment simplicity and pricing that private buyers accept relative to a full surf park membership.

Regional Outlook

2025 (USD Billion)
2035 (USD Billion)
North Americ
Europe
Asia-Pacific
Middle East
Latin Americ
Region 2025 (USD Billion) 2035 (USD Billion) CAGR (%)
North America $10.0 USD Billion $40.0 USD Billion 9.0%
Europe $17.1 USD Billion $51.1 USD Billion 27.0%
Asia-Pacific $24.2 USD Billion $62.2 USD Billion 25.0%
Middle East & Africa $31.3 USD Billion $73.3 USD Billion 23.0%
Latin America $38.4 USD Billion $84.4 USD Billion 12.0%

Regional data is locked

Unlock complete regional numbers for this market.

Unlock Full Data

Competitive Landscape

NMSC’s analysis indicates that competition is shaped by a small group of technology owners that differentiate on wave quality, throughput, energy use and delivery track record rather than on price alone.

Dimension Description
Market Structure Concentrated at the technology level, with a handful of suppliers delivering most commercial lagoons; waterpark equipment is more fragmented; licensing is widening supplier reach
Innovation Focus Programmable multizone waves, saltwater operation, lower energy per wave, compact and private models, and AI video and wave programming software
M&A Activity Limited consolidation; activity centers on licensing agreements, regional development partnerships and ownership changes at flagship facilities rather than acquisitions of technology owners

How Do Companies Compete in the Wave Machines Market?

Companies compete on demonstrated wave quality, waves per hour, energy per wave and the number of operating references. Wavegarden promotes up to 1,000 waves per hour from its Cove and more than 25 wave types, while Surf Loch markets ride times and capacity of its WaveBender model. Our findings suggest that pricing follows project scale, with total development appraisals in southern Europe of €25 million to €40 million, and suppliers expand geographically through Gulf, Latin American and Asia-Pacific projects.

Which Competitive Archetypes Dominate the Market?

Three archetypes dominate. Integrated technology suppliers, including Wavegarden, Endless Surf and American Wave Machines, design, supply and commission complete systems. Licensors such as Kelly Slater Wave Company grant rights to local developers. Aquatic attractions groups, led by WhiteWater, bundle wave systems with rides and slides inside waterparks, as at Aquarabia. Our assessment indicates that each archetype wins different customers, from lagoon developers to waterpark owners buying a complete attraction package.

What Innovation and Differentiation Strategies Are Companies Pursuing?

Innovation focuses on wave programming, split zones, saltwater operation, lower energy use and compact models. Endless Surf announced saltwater ES36 and ES32 installations in 2026, Surf Loch launched GT100 and introduced Wavebender, and Wavegarden is scaling modular Cove designs with 56 and 62 modules. Our analysis shows that automated AI video systems, such as the one at Surfers Cove that lets surfers replay rides, are becoming bundled extras that support operator pricing.

What M&A and Partnership Activity Is Shaping the Market?

Consolidation has been limited and centers on technology owners and flagship facilities. The World Surf League has reportedly exited ownership of Surf Ranch, while Kelly Slater Wave Company continues to license its technology. Based on research conducted by NMSC, we found that partnerships are the dominant structure, such as Wavegarden’s UK and Ireland agreement with The Wave and its work with developers in Portugal, Spain and Australia, which tie suppliers to long delivery programs without full acquisitions.

Key Market Players

Based on research conducted by NMSC, the following five companies represent the validated leadership set across wave system design, supply and licensing within this market.

Wavegarden WhiteWater West Industries Ltd. American Wave Machines, Inc. Surf Loch Kelly Slater Wave Company

Latest Developments

During our market evaluation, we noticed that 2025–2026 activity reflects commissioning of large destination lagoons, new compact models and a deepening Gulf project pipeline.

Date Event
May 2026 Endless Surf announced the opening of its ES32 lagoon at Aquarabia in Qiddiya City, which welcomed guests on April 23, 2026. The lagoon uses 32 pneumatic caissons and delivers split peak zones for mixed skill levels.
February 2026 Endless Surf debuted its ES36 saltwater lagoon at ADRENA, the sports and entertainment district within The Red Sea in Saudi Arabia. The district opened to the public on March 1, 2026.
December 2025 American Wave Machines reported two surf park openings in 2025 and expansion into new markets. A PerfectSwell pool in Utah and a third pool in Brazil were under way for 2026.
August 2025 Atlantic Park Surf in Virginia Beach opened the first Wavegarden Cove in North America, with a 46 module lagoon capable of up to 1,000 waves per hour. It became the 12th Wavegarden facility to open to the public.

Expert Insights

Paul Chutter

Paul Chutter

President and Co-Founder | Endless Surf

"We’re seeing surf move beyond standalone venues into fully integrated destinations like this …"

Analyst Interpretation

Our findings suggest that this statement marks a shift in demand from standalone surf venues toward integrated destinations, where waves sit alongside rides, hotels and retail. Waterpark and resort developers become direct buyers, which favors suppliers able to deliver at large scale and reliability. Decision makers should monitor operating performance at Aquarabia and ADRENA, as well as whether bundled delivery models spread beyond the Gulf.

Investment Opportunities

Where Are Capital Inflows Concentrating in the Wave Machines Market?

Capital is concentrating in destination-scale projects that pair a lagoon with real estate and hospitality. Verified announcements include the $350 million Atlantic Park development in Virginia Beach, the €25 million Surfers Cove project in Portugal and the Qiddiya City destination in Saudi Arabia. NMSC interpretation is that investors favor sponsors whose returns depend on property and tourism, which lowers reliance on session revenue alone and lifts equipment demand.

How Is Infrastructure Investment Shaping Market Capacity?

Infrastructure spending on lagoon construction, water treatment and power supply determines how many systems can be delivered each year. Wavegarden’s indicative appraisal assigns €10 million to €25 million to the lagoon, wave generator and treatment package, and it says a Cove can be powered by on-site solar. NMSC interpretation is that commissioning teams, rather than demand, limit near term deliveries, which supports Services growth.

What ESG Considerations Are Influencing Market Investment?

Environmental review focuses on electricity and water use. Wavegarden states that a Cove lagoon holds 30,000 to 50,000 cubic meters of water, below the 95,140 cubic meters it cites for an 18 hole golf course, and that its system uses between 0.3 and 1.0 kWh per wave. NMSC interpretation is that suppliers with published efficiency data gain approval advantages, and energy per wave will appear in more tender documents.

Key Benefits for Stakeholders

How Does This Report Benefit Surf Park Developers and Operators?

Developers and operators gain segment forecasts and CAGR benchmarks across six axes, including Surf Parks growing from USD 121.07 Million in 2025 to USD 483.83 Million by 2035. The technology and sales channel breakdowns support supplier selection, while the regional outlook identifies Middle East & Africa at 15.22% CAGR as the fastest growing procurement base. These data support financing cases and technology comparisons.

How Does This Report Benefit Wave Technology Suppliers?

Suppliers gain visibility into which technologies and offerings are growing fastest, including Displacement Systems at 14.45%, Licensing and Design at 15.97% and Saltwater at 15.63%. The competitive assessment shows how licensing, compact models and bundled waterpark delivery are changing buyer expectations, which informs capacity planning, product roadmaps and partner selection through 2035.

How Does This Report Benefit Investors and Lenders?

Investors and lenders gain a reconciled sizing model rising from USD 318.60 Million in 2025 to USD 1,029.43 Million by 2035, with the absolute opportunity of USD 669.93 Million defined. The restraint analysis, including capital intensity and project cancellations, supports risk pricing, while the Sales Channel and Offering splits show where recurring licensing and service income can improve the quality of supplier revenue relative to one time equipment sales.

Key Market Segments Evaluated

By Technology

  • Pneumatic Systems
  • Mechanical Systems 
    • Foil Systems
    • Displacement Systems
  • Standing Wave Systems
  • Pump and Release Systems

By Offering

  • Equipment 
    • Wave Generation Hardware
    • Control and Monitoring Systems
  • Services 
    • Installation and Commissioning
    • Licensing and Design
    • Maintenance and Upgrades

By Facility Type

  • Surf Parks
  • Water Parks
  • Resorts and Hotels
  • Entertainment Venues
  • Residential and Private
  • Training and Research

By Installation Setting

  • Outdoor
  • Indoor

By Water Type

  • Freshwater
  • Saltwater

By Sales Channel

  • Direct
  • Licensing Partner Led
  • Integrator Led

By Region

  • North America 
    • U.S.
    • Canada
    • Mexico
  • Europe 
    • UK
    • Germany
    • France
    • Italy
    • Spain
    • Sweden
    • Denmark
    • Finland
    • Netherlands
    • Rest of Europe
  • Asia-Pacific 
    • China
    • India
    • Japan
    • South Korea
    • Taiwan
    • Indonesia
    • Vietnam
    • Australia
    • Philippines
    • Malaysia
    • Rest of APAC
  • Middle East & Africa 
    • Saudi Arabia
    • UAE
    • Egypt
    • Israel
    • Turkey
    • Nigeria
    • South Africa
    • Rest of MEA
  • Latin America 
    • Brazil
    • Argentina
    • Chile
    • Colombia
    • Rest of LATAM

Conclusion & Recommendations

The long term outlook is positive, with revenue rising from USD 359.50 Million in 2026 to USD 1,029.43 Million by 2035 at a 12.4% CAGR. We observed that growth rests on a funded pipeline of destination lagoons, broader licensing and the spread of compact systems, rather than on a single cycle. The market is still young, with roughly 34 operating pools, so execution quality will determine which suppliers convert the pipeline into revenue.

What Strategic Positioning Recommendations Does NMSC Offer?

Suppliers should prioritize licensing structures, compact models and saltwater capable designs, since Licensing Partner Led sales grow at 16.17% CAGR and Saltwater at 15.63%. Integrated suppliers should secure commissioning capacity ahead of orders, and developers should require published energy and water data. Technology owners should protect wave quality through licence audits to preserve reputation across third party projects.

How Attractive Is the Wave Machines Market for Investment?

Investment attractiveness is moderate to high, supported by the USD 669.93 Million absolute opportunity between 2026 and 2035. Middle East & Africa at 15.22% CAGR and Asia-Pacific at 13.97% offer the fastest relative growth, while North America provides the largest revenue base. Capital intensity and cancellations at the project level mean that exposure to suppliers with diversified, licensed or service income is preferable to single project risk.

What Are the Key Market Shifts and Risks in the Wave Machines Market?

Key shifts include the move from standalone parks to integrated destinations, the rise of saltwater and compact systems, and the growth of licensed delivery. Main risks are project cancellations, financing delays, regulatory scrutiny of energy and water use, and unproven technologies that fail to reach commercial operation, as Surf Lakes has no pool open to the public as of 2025. These risks can delay revenue even when demand holds.

What Are the Primary Growth Pathways Through 2035?

Primary pathways include Gulf destination projects, licensing led scale up, compact systems for private and urban sites, and aftermarket services on a growing installed base. During our market evaluation, we noticed that suppliers that combine proven wave quality, efficient operation and local delivery partners are best placed to capture a disproportionate share of the USD 669.93 Million absolute opportunity, particularly in Middle East & Africa and Asia-Pacific.

FAQs

Sources & References

1.

Wavegarden — Proven Business (indicative cost and appraisal figures)

wavegarden.com/proven-business
2.

Wavegarden — Sunshine-powered surfing in a Wavegarden Cove (energy and water figures)

wavegarden.com
3.

Wavegarden — Atlantic Park opening press release, August 11, 2025

sflinsider.com
4.

Wavegarden — six facilities in final construction press release, May 29, 2026 (Surf Park Central reprint)

surfparkcentral.com
5.

Wavegarden — Surfers Cove investment press release (The Inertia reprint)

theinertia.com
6.

Wavegarden — Bahrain Surf Park announcement (Arab News)

arabnews.com/node/2573589/amp
7.

Endless Surf — Aquarabia Qiddiya City opening press release, May 11, 2026 (Surf Park Central reprint)

surfparkcentral.com
8.

Endless Surf — ADRENA saltwater lagoon announcement (WavePoolMag)

wavepoolmag.com
9.

American Wave Machines — year end press release, December 16, 2025 (ACN Newswire)

acnnewswire.com
10.

American Wave Machines — company profile and installation countries (Blooloop)

blooloop.com
11.

American Wave Machines — PerfectSwell Shizunami announcement, February 23, 2021 (Kyodo PR Wire)

kyodonewsprwire.jp
12.

Surf Loch — official website

surfloch.com
13.

Surf Loch — GT100 launch, February 2026 (Surf Park Central)

surfparkcentral.com
14.

Surf Loch — Wavebender introduction (WavePoolMag)

wavepoolmag.com
15.

Kelly Slater Wave Company — licensing to Surf Abu Dhabi, June 2023 (ABC30)

abc30.com
16.

World Surf League — Surf Ranch ownership change (The Inertia)

theinertia.com
17.

Kelly Slater Wave Company — discontinued projects (WavePoolMag)

wavepoolmag.com
18.

Atlantic Park Surf — Kona Big Wave partnership press release, June 11, 2026

shop-eat-surf-outdoor.com
19.

Surf Lakes — commercial status as of 2025 (The Inertia)

theinertia.com
20.

WavePoolMag — new wave pools opening in 2026 (operating pool count)

wavepoolmag.com/new-wave-pools-2026
21.

WavePoolMag — Wavegarden projects in construction, 2026

wavepoolmag.com
22.

International Surfing Association — Olympic surfing venue confirmation, April 15, 2025

isasurf.org

About the Author

Debashree Dey

Debashree Dey

Debashree Dey is Assistant Manager at Next Move Strategy Consulting, where she supports cross-vertical market content and communications across diverse industries for 6 years. Her professional background includes senior content writing, communications, and published manuscript authorship, with experience developing audience-focused business narratives and maintaining clear, consistent messaging. Her role supports research-led content development and editorial quality across NextMSC publications.

About the Reviewer

Supradip Baul

Supradip Baul

Supradip Baul is an accomplished business consultant and strategist with over a decade of rich experience in market intelligence, strategy, technology, and business transformation. His work has included rigorous qualitative and quantitative analysis across multiple industries, helping clients shape investment decisions and long-term roadmaps. Earlier in his career, he was associated with Gartner, where he contributed to industry-leading reports and market share analyses. He has worked with leading global companies and holds an MBA with a dual specialization in Marketing and Finance.

Download Free Sample

Nishant Awate

NISHANT AWATE

Business Development Global Sales

Zehnder Group Deutschland GmbH

Our experience working with Next Move Strategy Consulting was positive. The team was responsive, professional, and open to incorporating our specific requirements throughout the project. The India AHU market study was comprehensive and well structured, covering market value and volume forecasts, product and application segments, and key industry trends. The inclusion of both AHU and residential MVHR market insights made the study particularly relevant for our strategic market assessment. Overall, the report provides a solid foundation for evaluating market potential, identifying priority segments, and supporting business-development decisions in India.

Robert Sean Trevino

ROBERT SEAN TREVINO

Sr. Director, Head of Strategic Insights & Analytics

Foundation Medicine

I realized that it was a reliable source of information. These days, there are many people who are looking for authentic data, and this is one of the only sources that can offer them with what they need;

Henri Knyphausen

HENRI KNYPHAUSEN

Partner at Singulier [Ex-BCG]

Singulier

I recently engaged NEXTMSC.com for a commercial due diligence project within the intralogistics sector, and I am pleased to provide a reference based on my experience. In utilizing NEXTMSC.com's services, I found their report to offer valuable insights into market dynamics and key industry players. The initial report provided a solid foundation for our analysis. However, as we were investigating a smaller target in the market, and I had specific customization requests requiring additional research. These requests included detailed information on product portfolios of various players and sub-market sizes, both inclusive and exclusive of certain product categories. NEXTMSC.com demonstrated commendable responsiveness and agility in accommodating these customization requests. Within a timeframe of 1-2 weeks, they delivered a revised report that met our specific needs. Furthermore, they were receptive to my follow-up inquiries, ensuring clarity and understanding of the data provided. The final deliverable significantly contributed to our due diligence efforts. One of NEXTMSC.com's notable strengths lies in their qualitative research capabilities. However, for future engagements, I would recommend the inclusion of a quantified market model in Excel format. Such a model would offer the ability to conduct in-depth analyses and explore various market segments, including country-specific data and subcomponent breakdowns. Based on my positive experience, I would not hesitate to work with NEXTMSC.com again. Their responsiveness, willingness to accommodate customization requests, and commitment to delivering actionable insights make them a reliable partner for commercial research projects.

Pratyush Kumar Das

PRATYUSH KUMAR DAS

Assistant Manager

Polycab India Limited

We would like to express our appreciation for the data and insights provided by nextmsc. We are very pleased with the quality and depth of the information, which has proven to be highly valuable and beneficial for our business decision-making.

Gaurav Jaiswal

GAURAV JAISWAL

Founder & CEO

Yano Charge Private Limited

The EV Charging market research report provided by the NextMSC was exceptionally detailed and insightful. It offered a comprehensive analysis that proved to be a game-changer for our strategic planning. Truly a testament to the NextMSC’s expertise and thoroughness in EV market landscape & analysis.

Custom Market Research Services

We will customize the research for you if the listed report does not fully match your requirements.

Get 30% Free Customization

Select License

This website uses cookies to ensure you get the best experience on our website. Learn more

✖