Machine Vision Lens Market Size, Share, Trends and Growth Analysis, By Lens Type (Fixed Focal Length, Telecentric, Zoom and Varifocal, Line Scan, and Specialty), By Sensor Format, By Spectral Band, By Mount, By Resolution Tier, By Ruggedness, By Channel, By Buyer Type, By Revenue Type, By End Use Industry (Electronics and Semiconductor, Automotive and Transportation, Food and Packaging, and others), and Region — Global Industry Report and Forecast, 2026–2035
Industry: Semiconductor & Electronics | Publishing Date: July 27, 2026 | Last Updated: September 30, 2026 | No of Pages: N/A | No. of Tables: N/A | No. of Figures: N/A | Format: PDF | Report Code: SE5407
What Is the Machine Vision Lens Market Size?
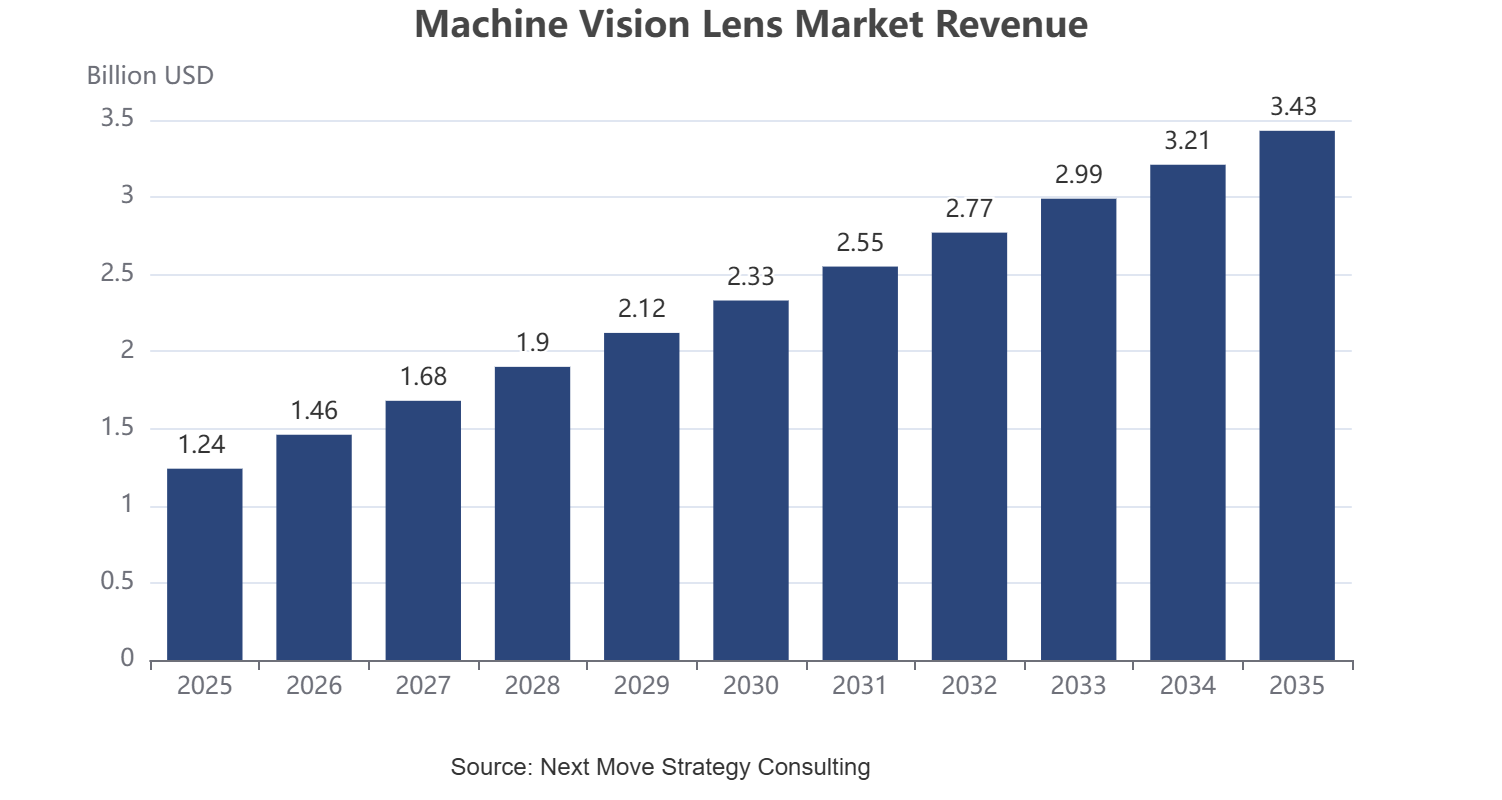
The global machine vision lens market size was valued at USD 1.24 Billion in 2025 and is estimated at USD 1.34 Billion in 2026, forecast to reach USD 3.43 Billion by 2035, expanding at an 11.0% CAGR between 2026 and 2035. Asia-Pacific leads with approximately 36% share, while fixed focal length lenses dominate all other lens types with approximately 46% share.
We observed that growth is broad-based across every segmentation axis, with telecentric optics and high-resolution custom formats driving the dominant structural shifts through 2035.
|
Key Takeaways |
|
By Lens Type: Fixed Focal Length held the largest share of approximately 46% (USD 0.57 Billion) in 2025; Specialty is the fastest-growing sub-segment at 14.0% CAGR from 2026–2035. |
|
By Sensor Format: Two-Thirds Inch held the largest share of approximately 24% (USD 0.30 Billion) in 2025; Large Format is the fastest-growing sub-segment at 16.6% CAGR from 2026–2035. |
|
By Spectral Band: Visible held the largest share of approximately 64% (USD 0.79 Billion) in 2025; Multispectral is the fastest-growing sub-segment at 18.5% CAGR from 2026–2035. |
|
By Mount: C-Mount held the largest share of approximately 48% (USD 0.60 Billion) in 2025; S-Mount is the fastest-growing sub-segment at 16.1% CAGR from 2026–2035. |
|
By Resolution Tier: 4 to 5 MP held the largest share of approximately 29% (USD 0.36 Billion) in 2025; Above 25 MP is the fastest-growing sub-segment at 19.2% CAGR from 2026–2035. |
|
By Ruggedness: Standard held the largest share of approximately 68% (USD 0.84 Billion) in 2025; Cleanroom and Vacuum is the fastest-growing sub-segment at 18.5% CAGR from 2026–2035. |
|
By Channel: Direct Sales held the largest share of approximately 52% (USD 0.64 Billion) in 2025; E-commerce is the fastest-growing sub-segment at 17.3% CAGR from 2026–2035. |
|
By Buyer Type: Vision System Integrator held the largest share of approximately 38% (USD 0.47 Billion) in 2025; End User is the fastest-growing sub-segment at 12.9% CAGR from 2026–2035. |
|
By Revenue Type: Standard Catalog held the largest share of approximately 54% (USD 0.67 Billion) in 2025; Services is the fastest-growing sub-segment at 16.7% CAGR from 2026–2035. |
|
By End Use Industry: Electronics and Semiconductor held the largest share of approximately 34% (USD 0.42 Billion) in 2025; Pharma and Medical Devices is the fastest-growing sub-segment at 14.3% CAGR from 2026–2035. |
|
Dominant Region: Asia-Pacific dominated with approximately 36% revenue share (USD 0.45 Billion) in 2025. |
|
Fastest-Growing Region: Latin America is expected to register the highest CAGR of 13.8% during 2026–2035. |
|
Dominant Country: U.S. led with approximately USD 0.27 Billion in 2025. |
|
Fastest-Growing Country: India is the fastest-growing country at approximately 15.8% CAGR from 2026–2035. |
Market Opportunity: The machine vision lens market is expected to create an absolute dollar opportunity of USD 2.09 Billion between 2026 and 2035, presenting significant investment potential across the semiconductor inspection, automotive electrification, and pharmaceutical serialization value chain.
According to Next Move Strategy Consulting analysis, camera OEMs and vision system integrators are increasingly consolidating optics sourcing with fewer, application-qualified lens partners to shorten system validation cycles, a shift that favors manufacturers with broad telecentric and custom OEM portfolios over single-format specialists as resolution requirements climb through 2035.
What Does the Machine Vision Lens Market Encompass?
The machine vision lens market encompasses optical components engineered to form, magnify, and correct images captured by industrial cameras and sensors for automated inspection, measurement, guidance, and identification tasks. Our assessment indicates that the scope spans fixed focal length, telecentric, zoom and varifocal, line scan, and specialty lens architectures supplied to camera OEMs, vision system integrators, and industrial OEMs across electronics and semiconductor, automotive, food and packaging, pharma and medical devices, logistics, aerospace, and other manufacturing end markets. The category has evolved from a niche precision-optics accessory into a foundational component of automated quality control, driven by rising resolution requirements and sensor miniaturization.
Regulatory frameworks such as the U.S. FDA's Quality System Regulation for medical device manufacturing and the European Union's Machinery Regulation (EU) 2023/1230 shape optical inspection accuracy and traceability requirements, while export-control classifications increasingly influence cross-border shipment of telecentric and high-magnification lens assemblies. We observed that technology adoption is shifting toward liquid lens and motorized varifocal architectures that replace fixed mechanical designs to improve inspection flexibility. Next Move Strategy Consulting's analysis indicates that this structural shift, combined with rising sensor resolution, is redefining sourcing criteria across the machine vision lens market.
|
Parameters |
Details |
|
Market Size in 2025 |
USD 1.24 Billion |
|
Market Size in 2026 |
USD 1.34 Billion |
|
Revenue Forecast in 2035 |
USD 3.43 Billion |
|
Growth Rate |
CAGR of 11.0% from 2026 to 2035 |
|
Analysis Period |
2025–2035 |
|
Base Year Considered |
2025 |
|
Forecast Period |
2026–2035 |
|
Market Size Estimation |
Revenue (USD Billion) |
|
Companies Profiled |
20 |
|
Countries Covered |
33 |
|
Market Share |
Available for Top 10 Companies |
Key Emerging Trends
We found that four structural trends are reshaping how optics are designed, sourced, and deployed across industrial imaging systems, each carrying distinct implications for lens manufacturers and their OEM customers.
How Is Liquid Lens Technology Transforming Focus Automation?
Liquid lens modules, which use electrically tunable membranes to adjust focus without mechanical movement, are transforming inspection stations that previously required fixed working distances. Our analysis shows that camera OEMs are integrating liquid lens elements into compact smart-camera housings to eliminate motorized focus assemblies, reducing moving parts and improving reliability on high-speed lines. Optotune AG has expanded its tunable lens portfolio for electronics inspection, illustrating how stakeholders across the value chain are prioritizing focus-free automation to shorten changeover time between product variants.
Why Is Telecentric Optics Adoption Accelerating in Precision Metrology?
Telecentric lenses, which maintain constant magnification regardless of object distance, are increasingly specified for dimensional metrology in electronics and medical device manufacturing. Our findings suggest that bi-telecentric designs are displacing conventional entocentric lenses wherever sub-micron measurement repeatability is required. Opto Engineering S.r.l. has broadened its bi-telecentric line for semiconductor packaging inspection, reflecting how stakeholders are adopting distortion-free optics to support tighter tolerance verification on shrinking component geometries.
How Are Large-Format Sensors Reshaping Lens Design Priorities?
The transition toward large-format and 1.1-inch sensors in industrial cameras is compelling lens manufacturers to redesign image circles and resolving power to avoid vignetting and edge softness. We observed that this shift disproportionately benefits specialists capable of matching optical performance to sensor pixel pitch below two microns. Kowa Company, Ltd. has introduced large-format lens series compatible with high-megapixel sensors, illustrating how stakeholders are re-engineering catalog lines to keep pace with sensor roadmaps.
What Role Is Custom OEM Optics Playing in System Differentiation?
Custom OEM lens design is gaining traction as vision system integrators seek differentiated optical performance that off-the-shelf catalog lenses cannot deliver for constrained housing geometries or unusual working distances. Based on research conducted by Next Move Strategy Consulting, we found that integrators increasingly co-develop optics with lens manufacturers during early system design rather than selecting components after camera specification is finalized. Navitar, Inc. has expanded its custom optical design services for robotics guidance applications, demonstrating how stakeholders are shifting toward application-specific optical engineering.
Ecosystem Analysis of the Machine Vision Lens Market
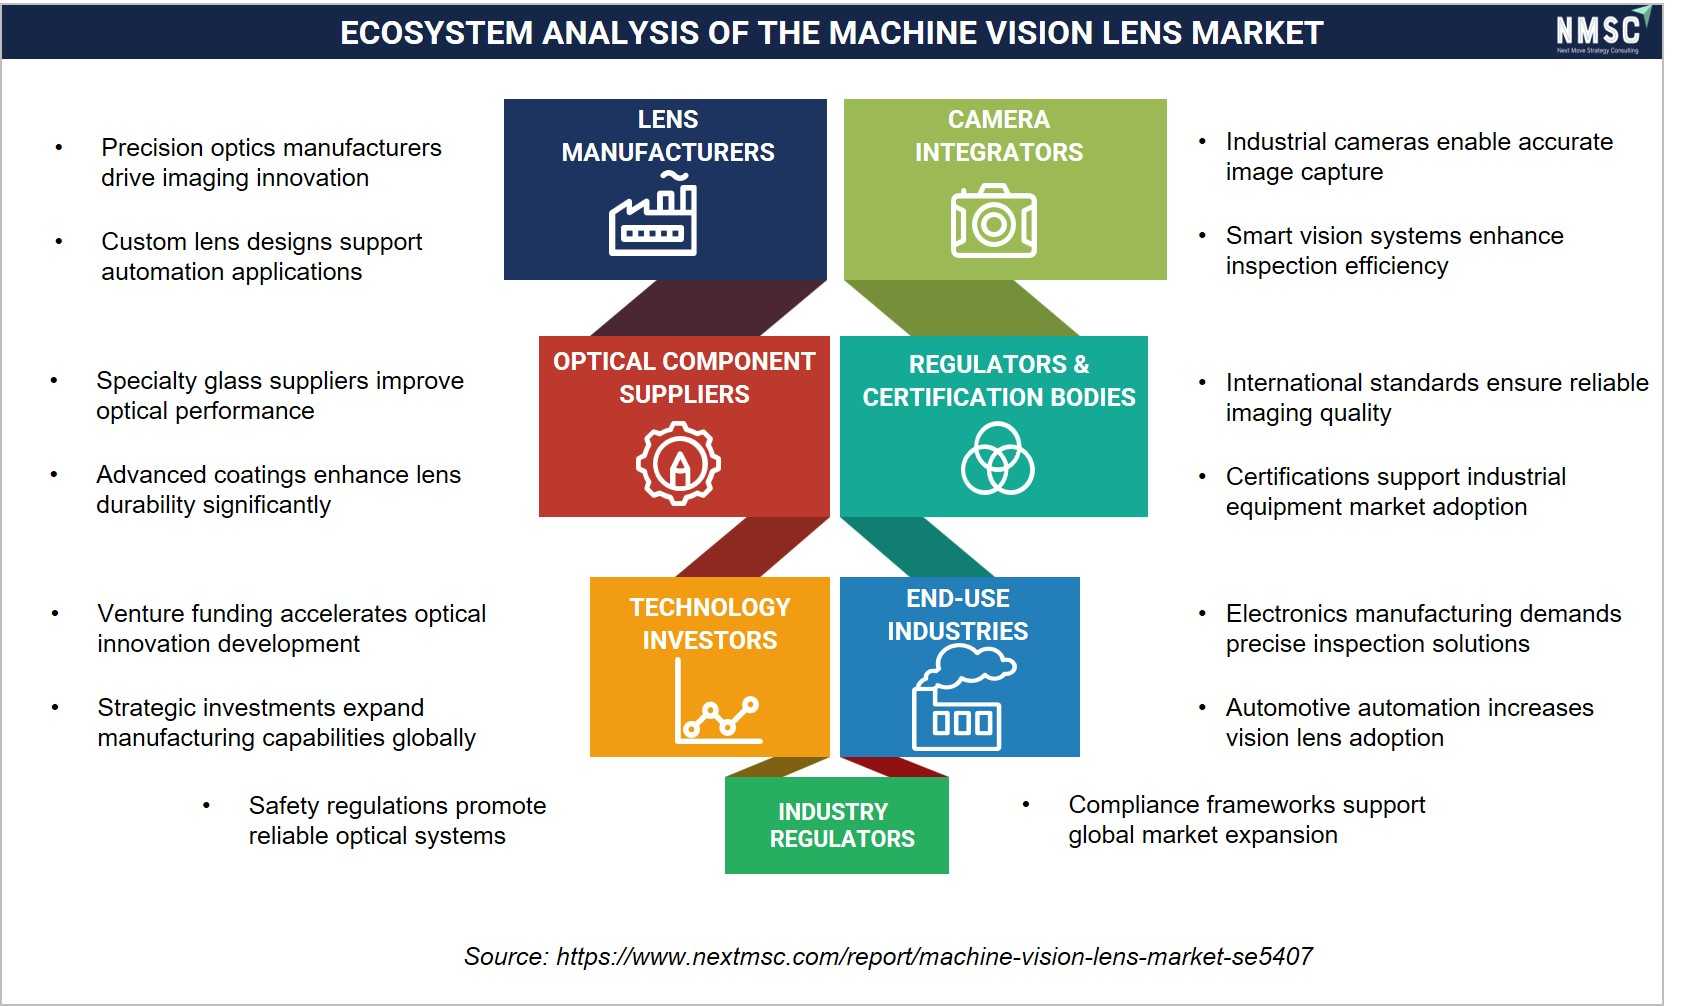
Our analysis indicates that the Machine Vision Lens Market ecosystem comprises lens manufacturers, optical component suppliers, camera integrators, technology investors, end-use industries, certification bodies, and industry regulators. Lens manufacturers develop precision optics using advanced optical materials supplied by specialized vendors, while camera integrators incorporate lenses into vision systems for industrial automation. Investors support optical technology innovation, and regulatory bodies establish quality and certification standards, ensuring reliable, high-performance machine vision solutions across manufacturing, electronics, automotive, and healthcare sectors.
Growth Drivers & Restraints
Growth Catalyst & Risk Assessment Matrix
|
Factors |
Type |
(+/−) % Impact on CAGR |
Geographic Relevance |
Impact Timeline |
|
Rising automated optical inspection in semiconductor packaging |
Driver |
+2.4% |
Asia-Pacific, North America |
2026–2032 |
|
Expansion of robotics-guided assembly in automotive electrification |
Driver |
+1.9% |
Global |
2026–2035 |
|
Growth in pharmaceutical serialization and track-and-trace mandates |
Driver |
+1.6% |
North America, Europe |
2026–2033 |
|
Rising sensor resolution requiring matched high-MP optics |
Driver |
+1.4% |
Global |
2026–2035 |
|
Expansion of e-commerce parcel sortation and scanning systems |
Driver |
+1.2% |
North America, Asia-Pacific |
2026–2032 |
|
Government-backed semiconductor fabrication investment programs |
Driver |
+1.1% |
Asia-Pacific, North America |
2026–2030 |
|
High engineering cost of telecentric and custom optical designs |
Restraint |
−0.8% |
Global |
2026–2035 |
|
Price competition from low-cost catalog lens suppliers |
Restraint |
−0.7% |
Asia-Pacific |
2026–2032 |
|
Extended qualification cycles for ruggedized optics in aerospace |
Restraint |
−0.5% |
North America, Europe |
2026–2031 |
What Is the Primary Growth Driver for the Machine Vision Lens Market?
The primary growth driver is the accelerating deployment of automated optical inspection across semiconductor manufacturing equipment lines, where shrinking node geometries demand lens systems capable of resolving defects below the wavelength of visible light. According to the U.S. Semiconductor Industry Association, global semiconductor sales exceeded USD 620 billion in 2024, and each new fabrication facility commissioned under related capacity-expansion programs requires dozens of inspection stations, each specifying multiple telecentric or high-resolution lens assemblies.
How Is Robotics-Guided Assembly Driving Market Growth?
Robotics-guided assembly is driving demand for lenses matched to eye-in-hand and fixed-mount guidance cameras on industrial robotics cells used for part-picking, alignment, and quality verification. The International Federation of Robotics reported that global industrial robot installations exceeded 540,000 units in 2023, and each guidance-enabled cell typically integrates one to three vision cameras, each requiring an application-specific lens matched to working distance and field of view.
What Is Restraining the Machine Vision Lens Market?
The primary restraint is the high non-recurring engineering cost associated with telecentric and custom optical designs, which can extend qualification timelines for smaller integrators operating on compressed project budgets. Industry-derived estimates (no publicly verifiable dataset available) suggest that custom lens qualification cycles can run six to twelve months longer than catalog lens adoption, discouraging smaller system integrators from specifying bespoke optics even where performance gains would justify the investment.
Segmentation Analysis
Segment Sizing: By Lens Type
|
Segment |
2025 (USD) |
2035 (USD) |
CAGR% (2026–2035) |
|
Fixed Focal Length |
0.57 Billion |
1.37 Billion |
9.3% |
|
Telecentric |
0.19 Billion |
0.62 Billion |
13.3% |
|
Zoom and Varifocal |
0.20 Billion |
0.58 Billion |
11.8% |
|
Line Scan |
0.15 Billion |
0.38 Billion |
9.9% |
|
Specialty |
0.14 Billion |
0.48 Billion |
14.0% |
|
Total |
1.24 Billion |
3.43 Billion |
11.0% |
Which Lens Type Segment Dominates the Machine Vision Lens Market?
Fixed focal length lenses dominate the machine vision lens market with approximately 46% share in 2025, supported by their lower cost, simpler integration, and broad compatibility with standard inspection and code-reading applications. Our analysis shows that specialty lenses, including liquid lens and 360-degree formats, are the fastest-growing category at 14.0% CAGR through 2035 as compact robotics and confined-space inspection applications proliferate, evidenced by expanding liquid lens deployment in electronics assembly cells.
Segment Sizing: By Spectral Band
|
Segment |
2025 (USD) |
2035 (USD) |
CAGR% (2026–2035) |
|
UV |
0.06 Billion |
0.14 Billion |
8.3% |
|
Visible |
0.79 Billion |
1.89 Billion |
9.2% |
|
NIR |
0.22 Billion |
0.65 Billion |
11.7% |
|
SWIR |
0.10 Billion |
0.45 Billion |
17.2% |
|
Multispectral |
0.06 Billion |
0.31 Billion |
18.5% |
|
Total |
1.24 Billion |
3.43 Billion |
11.0% |
Which Spectral Band Segment Is Growing Fastest?
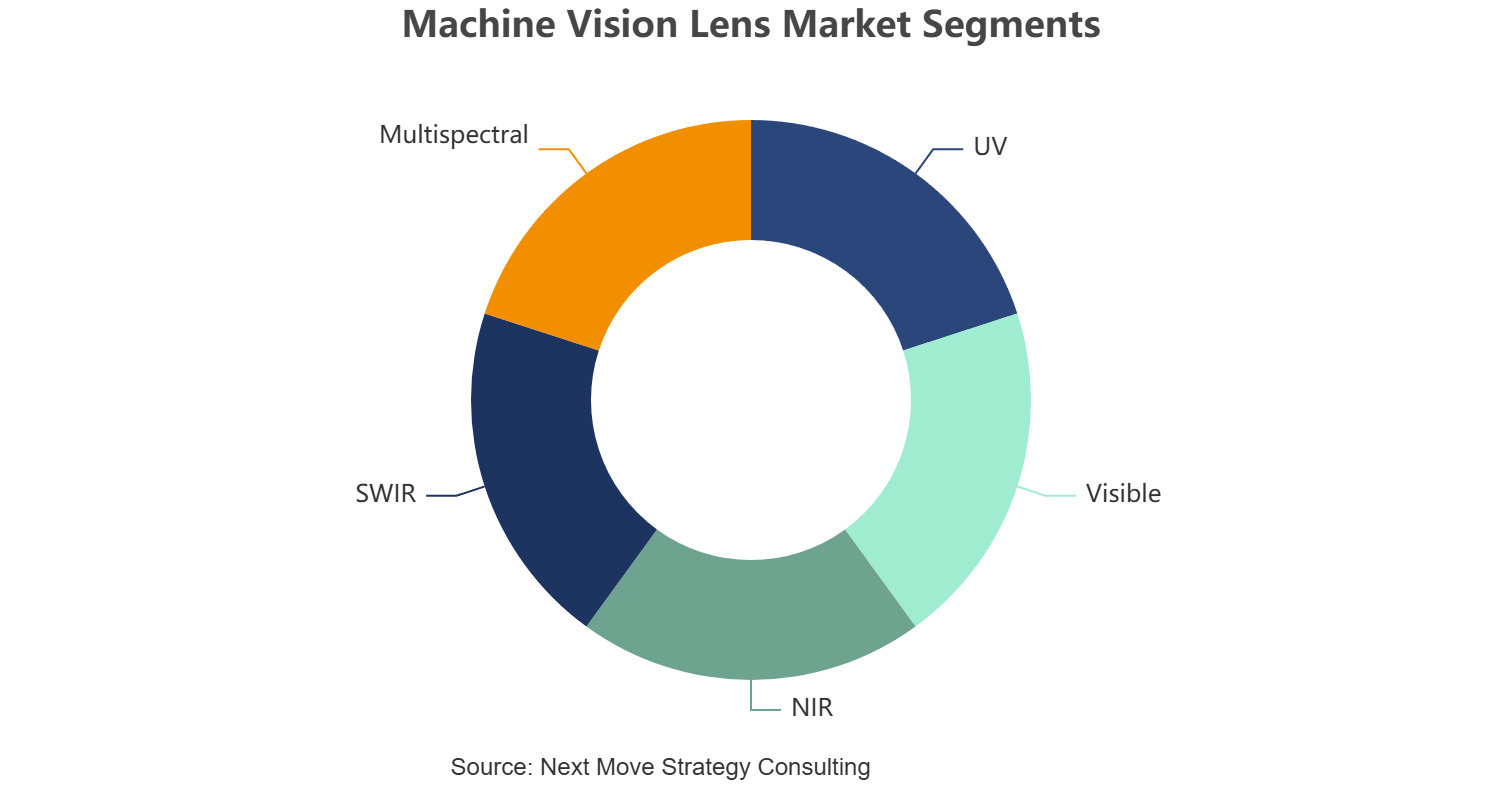
Visible-spectrum lenses dominate with approximately 64% share in 2025, reflecting their use across the vast majority of general-purpose inspection and code-reading systems. We observed that multispectral optics are the fastest-growing category at 18.5% CAGR through 2035, driven by food safety sorting and pharmaceutical contaminant detection applications that require simultaneous imaging across multiple wavelength bands to identify defects invisible to standard visible-light cameras.
Segment Sizing: By End Use Industry
|
Segment |
2025 (USD) |
2035 (USD) |
CAGR% (2026–2035) |
|
Electronics and Semiconductor |
0.42 Billion |
1.06 Billion |
9.9% |
|
Automotive and Transportation |
0.25 Billion |
0.65 Billion |
10.4% |
|
Food and Packaging |
0.14 Billion |
0.34 Billion |
9.8% |
|
Pharma and Medical Devices |
0.12 Billion |
0.45 Billion |
14.3% |
|
Logistics and Warehousing |
0.11 Billion |
0.38 Billion |
13.5% |
|
Aerospace and Defence |
0.09 Billion |
0.24 Billion |
11.0% |
|
Other Manufacturing |
0.11 Billion |
0.31 Billion |
11.0% |
|
Total |
1.24 Billion |
3.43 Billion |
11.0% |
Which End Use Industry Leads Machine Vision Lens Demand?
Electronics and semiconductor manufacturing leads with approximately 34% share in 2025, reflecting dense deployment of inspection cameras across wafer fabrication, advanced chip packaging, and surface-mount assembly lines. Our findings suggest that pharma and medical devices is the fastest-growing end use category at 14.3% CAGR through 2035, driven by expanding serialization mandates and rising automation of sterile packaging inspection.
Growth Opportunities
Beyond the core growth drivers, three forward-looking whitespace opportunities stand out for stakeholders positioning ahead of demand through 2035.
Can Miniaturized Telecentric Optics Unlock Portable Metrology?
Miniaturized bi-telecentric lens designs compatible with compact smart cameras could open portable, in-line metrology applications currently served by bench-top coordinate measuring machines. Vision system integrators serving electronics assembly stand to benefit as compact telecentric modules enable measurement stations to be relocated directly onto production lines rather than requiring offline sampling.
Does SWIR Lens Localization Present a Regional Manufacturing Opportunity?
Localizing SWIR-compatible lens coating and assembly capacity in North America and Europe could reduce dependence on concentrated Asia-Pacific supply for recycling-sorting and semiconductor wafer inspection applications. Regional camera OEMs stand to benefit from shorter lead times and eased export-control compliance on shipments to defence-adjacent end users.
Can Modular Lens Platforms Accelerate Robotics Integrator Adoption?
Modular lens platforms that allow integrators to swap focal length or spectral filter modules without recalibrating the full optical assembly could shorten deployment timelines for robotics system integrators serving fast-changing production environments. Integrators supporting flexible, high-mix manufacturing cells stand to benefit most from reduced revalidation effort when product lines change.
Regional Outlook
|
Region |
2025 (USD) |
2035 (USD) |
CAGR% (2026–2035) |
Key Driver |
|
North America |
0.38 Billion |
0.93 Billion |
9.3% |
Semiconductor fab investment |
|
Europe |
0.30 Billion |
0.75 Billion |
9.9% |
Automotive and pharma automation |
|
Asia-Pacific |
0.45 Billion |
1.37 Billion |
12.3% |
Electronics manufacturing scale |
|
Middle East & Africa |
0.06 Billion |
0.21 Billion |
13.3% |
Industrial diversification |
|
Latin America |
0.05 Billion |
0.17 Billion |
13.8% |
Automotive nearshoring |
|
Total |
1.24 Billion |
3.43 Billion |
11.0% |
— |
North America Machine Vision Lens Market Outlook
North America's machine vision lens market reflects a mature, technology-forward manufacturing base anchored by semiconductor fabrication and aerospace inspection demand. Our assessment indicates that regulatory emphasis on domestic chip production is accelerating capital investment in inspection infrastructure, while established camera OEM relationships support premium lens specification. Technology adoption skews toward high-resolution and telecentric formats, positioning the region for steady, quality-driven growth through 2035.
Europe Machine Vision Lens Market Outlook
Europe's market is shaped by stringent machinery safety and pharmaceutical serialization regulation that mandates traceable, high-precision inspection across automotive and medical device manufacturing. We observed that German and French integrators are early adopters of custom OEM optics for robotics guidance, while regional lens manufacturers maintain strong technology leadership in telecentric design, supporting a strategic outlook centered on precision differentiation rather than volume competition.
Asia-Pacific Machine Vision Lens Market Outlook
Asia-Pacific's dominant position reflects the sheer scale of electronics assembly, semiconductor packaging, and automotive component manufacturing concentrated in the region. Our assessment indicates that rising domestic sensor and camera production is deepening local lens sourcing, while government-backed semiconductor investment programs across multiple economies sustain elevated inspection equipment capital spending, supporting the region's position as both the largest and fastest-scaling market by absolute dollar growth through 2035.
Middle East & Africa Machine Vision Lens Market Outlook
The Middle East & Africa market remains comparatively nascent but is expanding as regional governments pursue industrial diversification away from hydrocarbon dependence. We found that new electronics assembly and food processing investment, particularly in the Gulf states, is introducing automated inspection at greenfield facilities, while regulatory frameworks for imported industrial equipment remain a manageable but real compliance consideration for lens suppliers entering the region.
Latin America Machine Vision Lens Market Outlook
Latin America's machine vision lens market is the fastest-growing globally in percentage terms, propelled by automotive nearshoring investment redirecting assembly capacity toward Mexico and Brazil. Our analysis shows that regional integrators increasingly specify catalog lenses sourced through distributor channels rather than direct manufacturer relationships, reflecting a still-developing local system integration base with strategic upside as automation penetration deepens through 2035.
U.S. Machine Vision Lens Market
Based on our estimates, the U.S. machine vision lens market was valued at approximately USD 0.27 billion in 2025 and is projected to reach approximately USD 0.67 billion by 2035, expanding at a 9.3% CAGR. Demand is concentrated among semiconductor and aerospace inspection buyers, with high technology adoption of telecentric and high-resolution optics, competitive intensity led by established domestic camera OEMs, and a strategic outlook favoring precision differentiation over price competition.
Canada Machine Vision Lens Market
The market in Canada reflects a smaller but steadily automating manufacturing base, with 2025 revenue of approximately USD 0.11 billion projected to reach approximately USD 0.26 billion by 2035 at a 9.3% CAGR. Demand structure leans toward food processing and automotive component inspection, regulatory influence from Health Canada packaging rules supports adoption of multispectral optics, and competitive intensity remains moderate as integrators rely on cross-border distributor channels.
UK Machine Vision Lens Market
As per our estimate, the UK machine vision lens market registered approximately USD 0.06 billion in 2025 and is estimated to reach approximately USD 0.14 billion by 2035 at a 9.9% CAGR. Demand structure centers on aerospace and pharmaceutical inspection, technology penetration favors ruggedized and cleanroom-rated optics, and regulatory influence from the Medicines and Healthcare products Regulatory Agency shapes serialization-linked inspection investment across the strategic outlook.
Germany Machine Vision Lens Market
According to our analysis, Germany's machine vision lens market reached approximately USD 0.09 billion in 2025 and is forecast to reach approximately USD 0.22 billion by 2035 at a 9.9% CAGR, anchored by automotive and industrial robotics guidance demand. Regulatory influence from the EU Machinery Regulation and dense system integrator competitive intensity support a strategic outlook favoring custom OEM optics over standard catalog formats.
France Machine Vision Lens Market
Based on our estimates, France's market stood at approximately USD 0.04 billion in 2025, projected to reach approximately USD 0.11 billion by 2035 at a 9.9% CAGR. Demand structure reflects aerospace and pharmaceutical inspection needs, technology penetration is rising for telecentric formats, and competitive intensity remains led by regional distributor networks serving mid-sized integrators across the country's strategic outlook.
China Machine Vision Lens Market
The market in China leads Asia-Pacific with approximately USD 0.17 billion in 2025, projected to reach approximately USD 0.52 billion by 2035 at an 11.5% CAGR. Demand structure is dominated by electronics assembly and semiconductor packaging inspection, technology penetration is accelerating for domestically produced lens assemblies, and regulatory influence from national semiconductor self-sufficiency policy supports a strategic outlook of rapid capacity expansion.
India Machine Vision Lens Market
As per our estimate, India is the fastest-growing country in the market, valued at approximately USD 0.06 billion in 2025 and projected to reach approximately USD 0.21 billion by 2035 at a 15.8% CAGR. Demand structure reflects expanding electronics manufacturing incentivized under national production-linked incentive schemes, technology penetration is rising from a low base, and competitive intensity is increasing as global lens manufacturers establish regional distributor partnerships.
Japan Machine Vision Lens Market
Based on our estimates, Japan's market reached approximately USD 0.09 billion in 2025, projected to reach approximately USD 0.27 billion by 2035 at a 12.3% CAGR, supported by dense semiconductor wafer fab equipment investment. Technology penetration is high given Japan's concentration of domestic optics manufacturers, and competitive intensity is shaped by long-standing camera OEM and lens supplier relationships across the strategic outlook.
South Korea Machine Vision Lens Market
The market in South Korea registered approximately USD 0.06 billion in 2025, projected to reach approximately USD 0.19 billion by 2035 at a 12.3% CAGR, driven by display and semiconductor inspection demand alongside expanding AI CCTV deployment that shares common optical component supply chains. Regulatory influence from domestic semiconductor investment policy and high competitive intensity among integrators support a strategic outlook centered on high-resolution optics.
Australia Machine Vision Lens Market
Based on our estimates, Australia's market remained comparatively small at approximately USD 0.02 billion in 2025, projected to reach approximately USD 0.07 billion by 2035 at a 12.3% CAGR. Demand structure centers on food processing and mining equipment inspection, technology penetration is moderate, and competitive intensity is limited, with most lenses sourced through distributor channels serving a strategic outlook of gradual automation uptake.
UAE Machine Vision Lens Market
The market in the UAE market reached approximately USD 0.02 billion in 2025, projected to reach approximately USD 0.06 billion by 2035 at a 13.3% CAGR. Demand structure reflects growing logistics and free-zone electronics assembly investment, regulatory influence from national industrial diversification strategy supports adoption incentives, and competitive intensity remains led by distributor-channel suppliers across the strategic outlook.
Saudi Arabia Machine Vision Lens Market
As per our estimate, Saudi Arabia's market stood at approximately USD 0.01 billion in 2025, projected to reach approximately USD 0.05 billion by 2035 at a 13.3% CAGR. Demand structure is emerging around Vision 2030-linked industrial diversification projects, technology penetration remains at an early stage, and competitive intensity is limited as global lens suppliers establish initial distributor coverage across the strategic outlook.
South Africa Machine Vision Lens Market
According to our analysis, South Africa's market reached approximately USD 0.01 billion in 2025, projected to reach approximately USD 0.03 billion by 2035 at a 13.3% CAGR. Demand structure centers on food and beverage packaging inspection, technology penetration is modest, and regulatory influence from national manufacturing competitiveness programs supports a gradually strengthening strategic outlook for automated inspection adoption.
Brazil Machine Vision Lens Market
Based on our estimates, Brazil's market registered approximately USD 0.02 billion in 2025, projected to reach approximately USD 0.08 billion by 2035 at a 13.8% CAGR. Demand structure is anchored by automotive nearshoring investment, technology penetration is rising for standard catalog optics, and competitive intensity is increasing as integrators expand inspection capacity across the country's strategic outlook through 2035.
Argentina Machine Vision Lens Market
The market in Argentina's market stood at approximately USD 0.01 billion in 2025, projected to reach approximately USD 0.03 billion by 2035 at a 13.8% CAGR. Demand structure reflects food processing and agricultural equipment inspection needs, technology penetration remains at an early stage, and competitive intensity is limited, with a strategic outlook dependent on broader industrial investment recovery.
Supply Chain Structure of the Machine Vision Lens Market
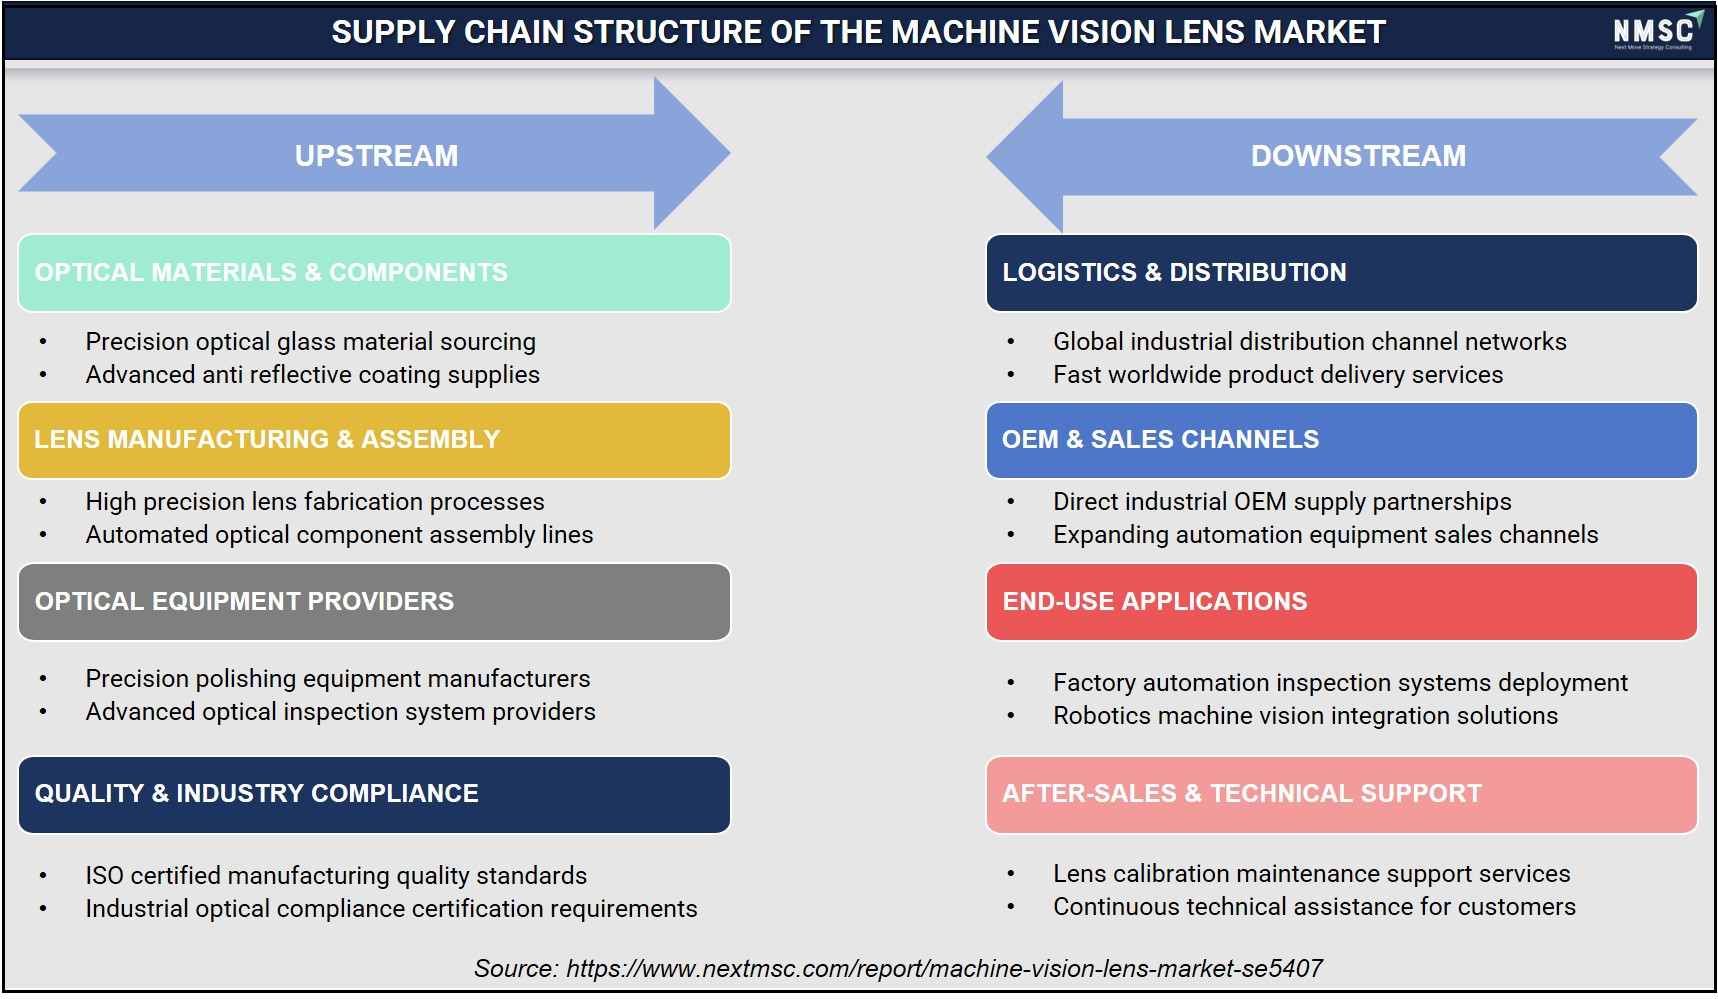
Our analysis indicates that the Machine Vision Lens Market supply chain begins with optical glass, coatings, and precision component suppliers, followed by lens manufacturing, assembly, and optical equipment providers utilizing advanced fabrication technologies. Compliance with industrial quality standards ensures product consistency and performance. Downstream activities include logistics, OEM partnerships, and distribution networks delivering lenses to automation equipment manufacturers. Technical support, calibration, and maintenance services further enhance product reliability and long-term operational efficiency for industrial customers.
Competitive Landscape
Our assessment indicates that the machine vision lens market remains moderately fragmented, with global optics specialists competing alongside regional manufacturers across differentiated technology and application niches.
|
Dimension |
Assessment |
|
Market Structure |
Moderately fragmented; top 10 companies hold a meaningful but non-dominant combined share |
|
Innovation Focus |
Telecentric precision, liquid lens autofocus, and high-resolution large-format optics |
|
M&A Activity |
Selective bolt-on acquisitions targeting spectral filtering and custom optics design capability |
How Do Companies Compete in the Machine Vision Lens Industry?
Companies compete primarily on optical performance, application-specific engineering support, and breadth of catalog coverage across mounts, formats, and spectral bands. Our findings suggest that integrators increasingly evaluate suppliers on speed of custom design turnaround alongside baseline optical specifications, pushing manufacturers to expand in-house simulation and prototyping capability rather than competing on catalog price alone.
Which Competitive Archetypes Dominate the Machine Vision Lens Industry?
Three archetypes dominate: diversified optics manufacturers with broad catalog depth across mounts and formats, telecentric and precision-metrology specialists commanding premium pricing on accuracy, and regional value suppliers competing on cost and distribution reach in price-sensitive markets. This differentiation structure allows manufacturers to defend margin in specialized segments while regional players absorb high-volume standard catalog demand.
What Innovation and Differentiation Strategies Are Emerging?
Innovation strategies increasingly center on tunable and liquid lens autofocus, coatings optimized for multispectral imaging, and modular mount adapters that let a single optical design serve multiple camera platforms. We observed that manufacturers investing in simulation-driven custom design services are capturing disproportionate share of robotics guidance and metrology applications where catalog lenses cannot meet tolerance requirements.
What M&A and Geographic Expansion Activity Is Shaping the Market?
M&A activity remains selective, concentrated on bolt-on acquisitions that add spectral filtering, coating, or custom design capability rather than large consolidating transactions. Geographic expansion is most visible in Asia-Pacific, where manufacturers are establishing regional design and assembly capacity to shorten lead times for electronics and semiconductor customers, while pricing strategies bifurcate between premium application-engineered optics and cost-competitive standard catalog lines.
Key Market Players
Our analysis shows that the following companies represent the leading validated participants shaping the competitive structure of the machine vision lens market.
-
Edmund Optics, Inc.
-
Tamron Co., Ltd.
-
Kowa Company, Ltd.
-
CBC Co., Ltd.
-
Ricoh Company, Ltd.
-
MORITEX Corporation
-
Opto Engineering S.r.l.
-
Sill Optics GmbH & Co. KG
-
VS Technology Corporation
-
Myutron Co., Ltd.
-
Optotune AG
-
Theia Technologies, Inc.
-
Sunex, Inc.
-
Navitar, Inc.
-
Thorlabs, Inc.
-
Goyo Optical Inc.
-
Excelitas Technologies Corp.
-
VICO Imaging Technology Co., Ltd.
-
Jenoptik AG
Latest Developments
|
Date |
Event |
|
February 2026 |
Pixelink (a Navitar company) announced the upcoming release of its high-performance PL-U Series of USB 3.1 Gen 1 machine vision cameras, engineered to deliver exceptional speed, precision, and seamless integration for automated industrial inspection and machine vision applications. |
|
December2025 |
Edmund Optics expanded its global manufacturing footprint and optical capabilities, receiving the "Manufacturer of the Year" award at the Southern Arizona Tech + Business Expo for its continued technological innovations and contributions to high-precision optical systems. |
|
September 2025 |
Jenoptik announced a low-double-digit million-euro investment to significantly expand and modernize its optical manufacturing campus in Jena, Germany, with scheduled renovation and production integration targeting high-end optics for the advanced semiconductor and industrial equipment sectors. . |
Expert Insights

“It does make a lot of sense to start with the lens because, given the super high performance of camera sensors on today's market, with incredible image quality relative to even what existed half a decade ago, the lenses are a bottleneck now in the vision system performance.”
— Nicholas Sischka, Director of Imaging Product Development, Edmund Optics
Statement made during a Vision Systems Design interview discussing the growing importance of advanced optics in modern machine vision systems as image sensor capabilities continue to improve.
Market Interpretation
The statement underscores the increasing importance of high-performance machine vision lenses as advancements in camera sensor technology outpace optical capabilities. As industries adopt higher-resolution imaging for AI-enabled inspection, robotics, semiconductor manufacturing, electronics, and automated quality control, lens performance has become a critical factor influencing overall system accuracy. Consequently, manufacturers are investing in precision optics with higher resolving power, lower distortion, and enhanced imaging quality, driving innovation and growth in the machine vision lens market.
Investment Opportunities
Where Are Capital Inflows Concentrating in the Machine Vision Lens Market?
Capital inflows are concentrating in telecentric optics manufacturing capacity and custom design engineering services, segments commanding above-average CAGR through 2035. Investment is also flowing into semiconductor fabrication ecosystems, where each new facility generates recurring demand for matched inspection optics across the equipment's operating lifetime.
How Significant Is Infrastructure Investment in Supporting Market Growth?
Infrastructure investment in regional coating, assembly, and calibration facilities is significant, particularly across Asia-Pacific, where camera OEMs are localizing lens sourcing to shorten supply chains. Government-backed semiconductor capacity programs in the U.S. and select Asia-Pacific economies are indirectly catalyzing this infrastructure buildout by guaranteeing multi-year inspection equipment demand.
What ESG Considerations Are Shaping Investment Decisions?
Environmental, Social, and Governance considerations increasingly influence supplier selection, with buyers favoring lens manufacturers that disclose responsibly sourced optical glass and reduced-hazard coating processes. Social governance considerations extend to workforce certification programs, such as vision and imaging professional certification pathways, which buyers increasingly reference when qualifying long-term optics suppliers.
Key Benefits for Stakeholders
How Does This Report Benefit Industry Leaders?
Industry leaders gain access to reconciled segmentation, regional, and competitive data that supports capacity planning and product roadmap decisions. The report's forecasts and segmentation analysis help manufacturing and system integration leaders benchmark portfolio exposure against the fastest-growing lens formats and end use industries through 2035.
How Does This Report Benefit Investors and Financial Analysts?
Investors and financial analysts benefit from a reconciled market-sizing model spanning 2025 to 2035, enabling direct comparison of segment-level growth rates when evaluating acquisition targets or capital allocation across the optics value chain. The competitive landscape and latest developments sections support diligence on strategic positioning among the twenty profiled companies.
How Does This Report Benefit Technology Vendors and Product Teams?
Technology vendors and product teams benefit from segmentation detail across sensor format, resolution tier, and spectral band, supporting roadmap alignment with camera OEM sensor transitions. Regional outlook data further helps product teams prioritize localization investment where technology adoption and competitive intensity are shifting fastest.
Key Market Segments
By Lens Type
-
Fixed Focal Length
-
Standard
-
Wide Angle
-
Telephoto
-
Macro
-
-
Telecentric
-
Object Side
-
Bi Telecentric
-
Image Side
-
-
Zoom and Varifocal
-
Manual Zoom
-
Motorized Zoom
-
Varifocal
-
-
Line Scan
-
Standard Line Scan
-
Large Format Line Scan
-
-
Specialty
-
Liquid Lens
-
360 Degree Lens
-
Custom OEM
-
Other Specialty
-
By Sensor Format
-
One Third Inch
-
One Half Inch
-
Two Thirds Inch
-
One Inch
-
1.1 Inch
-
Four Thirds Inch
-
Large Format
By Spectral Band
-
UV
-
Visible
-
NIR
-
SWIR
-
Multispectral
By Mount
-
S Mount
-
C Mount
-
CS Mount
-
F Mount
-
M42
-
M58
-
Custom Mount
By Resolution Tier
-
Up to 3 MP
-
4 to 5 MP
-
6 to 12 MP
-
13 to 25 MP
-
Above 25 MP
By Ruggedness
-
Standard
-
Ruggedized
-
High Vibration
-
Cleanroom and Vacuum
By Channel
-
Direct Sales
-
Distributor
-
E-commerce
By Buyer Type
-
Camera OEM
-
Vision System Integrator
-
Industrial OEM
-
End User
By Revenue Type
-
Standard Catalog
-
Custom OEM
-
Private Label
-
Services
By End Use Industry
-
Electronics and Semiconductor
-
Automotive and Transportation
-
Food and Packaging
-
Pharma and Medical Devices
-
Logistics and Warehousing
-
Aerospace and Defence
-
Other Manufacturing
By Region
-
North America: U.S., Canada, Mexico
-
Europe: UK, Germany, France, Italy, Spain, Sweden, Denmark, Finland, Netherlands, Rest of Europe
-
Asia-Pacific: China, India, Japan, South Korea, Taiwan, Indonesia, Vietnam, Australia, Philippines, Malaysia, Rest of APAC
-
Middle East & Africa: Saudi Arabia, UAE, Egypt, Israel, Turkey, Nigeria, South Africa, Rest of MEA
-
Latin America: Brazil, Argentina, Chile, Colombia, Rest of LATAM
Conclusion & Recommendations
What Is the Long-Term Outlook for the Machine Vision Lens Market?
The long-term outlook remains structurally positive, with the market expanding from USD 1.34 Billion in 2026 to USD 3.43 Billion by 2035 as inspection automation deepens across electronics, automotive, and pharmaceutical manufacturing. Our assessment indicates that resolution and precision requirements will continue rising faster than unit volume, sustaining premium pricing power for manufacturers with strong telecentric and custom optics capability.
What Strategic Positioning Should Manufacturers Pursue?
Manufacturers should prioritize expanding custom OEM design capacity and application engineering support, since integrators increasingly select optics partners during early system design rather than after camera specification. Next Move Strategy Consulting's analysis indicates that manufacturers combining catalog breadth with fast custom-design turnaround are best positioned to capture share from single-format specialists.
How Attractive Is the Machine Vision Lens Market for Investment?
Investment attractiveness is elevated in telecentric, SWIR, and large-format optics, where above-average CAGR reflects genuine technology adoption rather than cyclical demand. We found that investors evaluating the space should weigh the fragmented competitive structure, which limits pricing power for standard catalog products relative to precision and custom segments.
What Market Shifts and Key Risks Should Stakeholders Monitor?
Stakeholders should monitor export-control classification changes affecting cross-border shipment of high-magnification optics, alongside pricing pressure from low-cost catalog suppliers expanding distributor-channel reach. Our findings suggest that supply concentration in Asia-Pacific for certain optical glass and coating inputs represents a structural risk warranting supplier diversification planning.
What Are the Clearest Growth Pathways Through 2035?
The clearest growth pathways run through semiconductor packaging inspection, pharmaceutical serialization compliance, and robotics guidance optics, each combining above-average CAGR with structurally rising per-unit optical content. Manufacturers aligning product roadmaps with these three pathways stand to outpace the market's overall 11.0% CAGR through 2035.
About the Author
 Saista Faiyaz
— Saista Faiyaz is Research Associate at Next Move Strategy Consulting, where she has covered consumer markets and healthcare technologies for 3 years. Her work includes primary interview review, secondary-source validation, market sizing, and structured analysis of company and industry data. She supports research by comparing evidence across sources, organizing findings into market narratives, and documenting assumptions used in analysis. Her scope includes cross-market benchmarking, and reports.
Saista Faiyaz
— Saista Faiyaz is Research Associate at Next Move Strategy Consulting, where she has covered consumer markets and healthcare technologies for 3 years. Her work includes primary interview review, secondary-source validation, market sizing, and structured analysis of company and industry data. She supports research by comparing evidence across sources, organizing findings into market narratives, and documenting assumptions used in analysis. Her scope includes cross-market benchmarking, and reports.
About the Reviewer
 Supradip Baul
— Supradip Baul is an accomplished business consultant and strategist with over a decade of rich experience in market intelligence, strategy, technology, and business transformation. His work has included rigorous qualitative and quantitative analysis across multiple industries, helping clients shape investment decisions and long-term roadmaps. Earlier in his career, he was associated with Gartner, where he contributed to industry-leading reports and market share analyses. He has worked with leading global companies and holds an MBA with a dual specialization in Marketing and Finance.
Supradip Baul
— Supradip Baul is an accomplished business consultant and strategist with over a decade of rich experience in market intelligence, strategy, technology, and business transformation. His work has included rigorous qualitative and quantitative analysis across multiple industries, helping clients shape investment decisions and long-term roadmaps. Earlier in his career, he was associated with Gartner, where he contributed to industry-leading reports and market share analyses. He has worked with leading global companies and holds an MBA with a dual specialization in Marketing and Finance.
At Next Move Strategy Consulting, we understand that insightful market research is the cornerstone of successful business decisions. That's why we employ a robust and multifaceted approach, combining various methodologies to deliver the most accurate and actionable data for our clients.

Research Landscape
We navigate the world of research with two primary approaches:
Qualitative Approach
Our qualitative research methodologies involve immersive techniques such as in-depth interviews, focus groups, and observational studies. By engaging directly with individuals and stakeholders, we uncover valuable insights that quantitative data alone may overlook.

Quantitative Research
In tandem with qualitative methodologies, NMSC leverages the power of Quantitative Research to provide a robust foundation of numerical insights. Through systematic data collection and analysis, we quantify patterns, preferences, and market trends, offering a comprehensive view of the business landscape.
Our quantitative research approach employs diverse tools, including surveys, experiments, and statistical modelling. These methodologies enable us to gather data from a large and representative sample, ensuring the statistical significance of our findings. By employing structured questionnaires and standardized data collection methods, we guarantee the reliability and validity of the information we present to our clients.
Quantitative research is particularly effective in measuring the prevalence of trends, assessing market size, and gauging the impact of various factors on consumer behavior. The numerical precision attained through this approach equips our clients with actionable insights, facilitating data-driven decision-making and strategy formulation.


Our Specialized Toolbox for Industry-Specific Market Research
We deploy a specialized arsenal of techniques tailored to meet your unique requirements. Here's a glimpse into our comprehensive toolbox:

Information Procurement
The stage entails acquiring market data or relevant information through various sources and methodologies.


Market Research Approach
We utilize both top-down and bottom-up approaches in market research analysis to achieve a comprehensive understanding of the market dynamics, leveraging the broad perspective of industry trends and macroeconomic factors alongside detailed insights from specific segments and individual companies.

Porters Five Forces Analysis
We conduct Porter's Five Forces analysis to evaluate the competitive landscape of an industry, providing us with insights into factors that affect profitability and strategic positioning.

SWOT Analysis

Forecasting
We utilize a forecasting model to predict future consumption by considering parameters like population, economics, regulations, market competition, drivers, constraints, technology, and pricing. We also employ statistical techniques such as multilinear regression, exponential smoothing, moving average, ARIMA, and Monte Carlo simulations for accurate predictions. In econometric forecasting, we analyzed short-term and long-term event impacts, attributing values based on regulatory frameworks, economic factors, and market events.





 Speak to Our Analyst