AI Cloud Infrastructure Market Global Industry Analysis and Forecast (2026–2035)

The global AI Cloud Infrastructure Market size was valued at USD 69.87 billion in 2025 and is estimated at USD 100.35 billion in 2026, forecast to reach USD 374.63 billion by 2035, expanding at a 15.76% CAGR between 2026 and 2035. North America leads with approximately 46% share, while AI Compute dominates all other segments with approximately 66% share.

Download Free Sample PDF
Base Year (2025)
$69.87 Billion
Forecast (2035)
$374.63 Billion
CAGR (2026-2035)
15.8%
Top Region
North America

What Is the AI Cloud Infrastructure Market Size?

The global AI Cloud Infrastructure Market was valued at USD 69.87 Billion in 2025 and is estimated at USD 100.35 Billion in 2026. It is forecast to reach USD 374.63 Billion by 2035, growing at a 15.76% CAGR from 2026 to 2035. North America leads with about 46% share in 2026, while AI compute holds about 66%.

Our analysis shows that compute, inference demand, and Middle East growth define the headline outcomes of the forecast period.

AI Cloud Infrastructure Market Global Industry Analysis and Forecast (2026–2035) Revenue Forecast

Values in USD Billion

2025 $69.87 Billion
2025
2026 $100.35 Billion
2026
2027 $116.17 Billion
2027
2028 $134.47 Billion
2028
2029 $155.67 Billion
2029
2030 $180.20 Billion
2030
2031 $208.60 Billion
2031
2032 $241.47 Billion
2032
2033 $279.53 Billion
2033
2034 $323.58 Billion
2034
2035 $374.63 Billion
2035

Key Takeaways

By Offering: AI compute held the largest share, expanding from USD 46.12 Billion in 2025 to USD 228.53 Billion by 2035; Managed AI platform services is the fastest growing at 18.86% CAGR from 2026–2035.

By Workload: Model training held the largest share in 2025, at USD 36.33 billion, and is forecast to reach USD 116.13 billion by 2035. Inference and serving is the fastest-growing workload at a 21.10% CAGR from 2026 to 2035, reaching USD 213.54 billion by 2035 and becoming the largest workload segment.

By End User: AI labs and AI developers held the largest share, expanding from USD 33.54 Billion in 2025 to USD 157.34 Billion by 2035; Enterprises is the fastest growing at 17.90% CAGR from 2026–2035.

Dominant Region: North America, expanding from USD 33.19 Billion in 2025 to USD 149.10 Billion by 2035.

Fastest-Growing Region: Middle East & Africa at 20.16% CAGR from 2026–2035.

Dominant Country: U.S., expanding from USD 29.54 Billion in 2025 to USD 131.21 Billion by 2035.

Fastest-Growing Country: Saudi Arabia at 23.24% CAGR from 2026–2035.

The market presents an absolute investment opportunity of USD 274.28 Billion between 2026 and 2035, rewarding early capacity investors.

According to NMSC analysis, disclosed multiyear backlog at Oracle, Alphabet and CoreWeave disclosed forward commitments and backlog figures totaling approximately USD 1.26 trillion under their respective reporting definitions. These measures include different mixes of cloud services and contractual commitments, so they should not be interpreted as AI infrastructure revenue alone. Nevertheless, the figures indicate substantial contracted demand, while providers' ability to energize and deliver capacity remains a key determinant of revenue recognition.

What Does the AI Cloud Infrastructure Market Encompass?
The AI Cloud Infrastructure Market covers cloud-delivered compute, storage, networking, and managed platform services that customers rent to train, tune, and run artificial intelligence models. It includes GPU, TPU and custom accelerator instances, AI-optimised storage tiers, and managed training and inference platforms sold by hyperscalers and specialised GPU clouds. The scope excludes on-premises hardware sales, general-purpose cloud workloads, colocation leasing, and per-seat AI applications, which keeps the analysis free of double counting.
Structural evolution is visible in how buyers contract capacity. Frontier labs now sign multiyear commitments measured in gigawatts, while enterprises move from pilot credits to production inference budgets. Regulation shapes scope too, because the EU AI Act, export controls on advanced accelerators and national data residency rules influence where capacity is built and who may use it. Technology adoption centres on liquid cooled racks, custom silicon and fast network fabrics that raise utilisation.

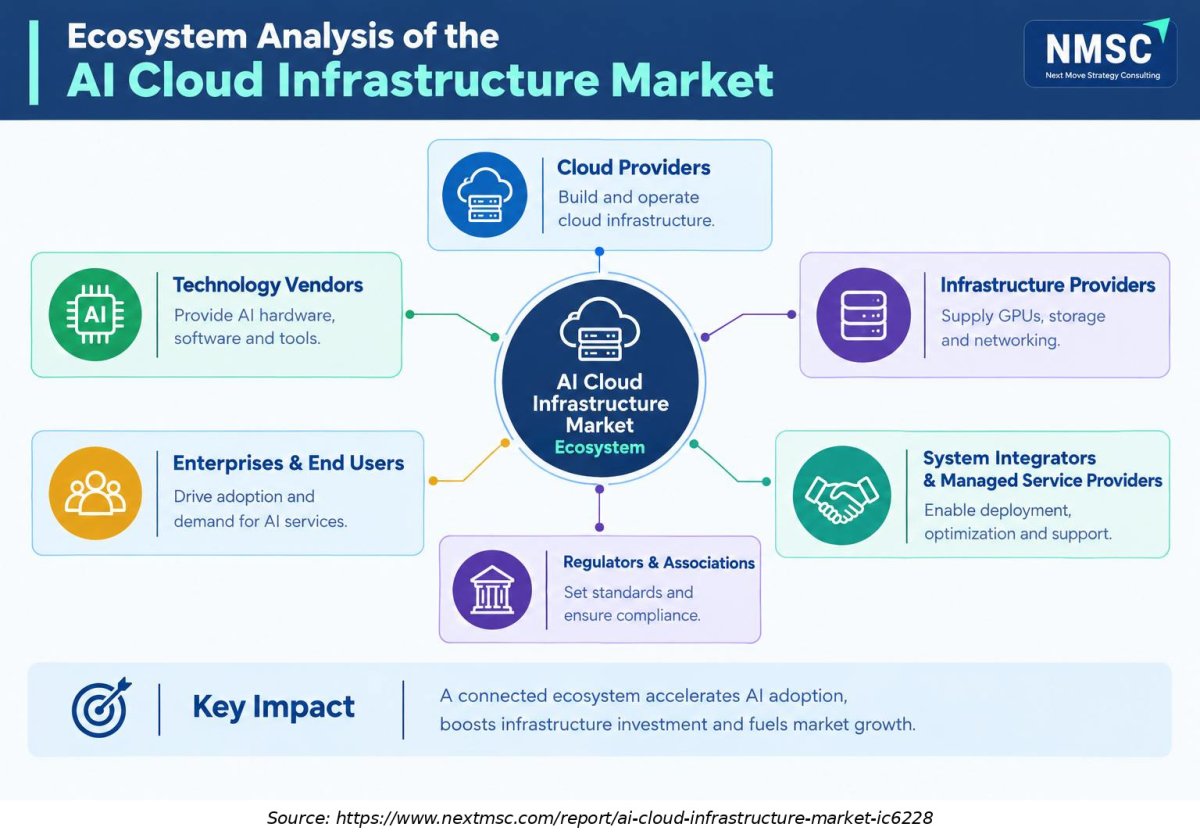
Ecosystem Analysis of the AI Cloud Infrastructure Market
The AI cloud infrastructure market ecosystem includes cloud providers, technology vendors, infrastructure suppliers, enterprises, system integrators, managed service providers, and regulatory bodies. These stakeholders collectively support AI workload deployment through computing hardware, storage, networking, software, and cloud services. Their coordination influences infrastructure scalability, operational efficiency, service reliability, and investment decisions as organizations expand AI adoption across business functions.

Market Drivers & Dynamics

Interactive Dataset
Contracted multiyear backlog at hyperscalers and neoclouds driver +3.2% Global, led by North America 2026–2031
Enterprise shift from pilots to production inference driver +2.6% Global 2026–2033
Custom accelerators lowering cost per token driver +1.8% Global 2026–2032
Sovereign AI capacity programmes driver +1.4% Middle East & Africa, Asia-Pacific, Europe 2026–2033
Power and grid connection constraints restraint −2.4% North America, Europe 2026–2031
Accelerator and memory supply shortages restraint −1.7% Global 2026–2028
Export controls and regulatory fragmentation restraint −1.2% China, Middle East & Africa 2026–2030
Capital intensity and customer concentration restraint −1.1% Global 2026–2032
Source: Next Move Strategy Consulting

Growth Drivers

What Is the Primary Growth Driver in the AI Cloud Infrastructure Market?

Contracted multiyear demand from frontier labs and enterprises is the primary growth driver. Oracle reported remaining performance obligations of USD 638 Billion at the end of fiscal 2026, Alphabet reported a cloud backlog of USD 514 Billion, and CoreWeave reported a backlog of about USD 104 Billion. We found that these commitments convert to revenue only as data centre capacity energises, which explains why providers describe demand as exceeding supply.

How Is Enterprise Adoption of Production AI Driving Market Growth?

Enterprises are moving from experiments to workloads that run continuously. Microsoft reported more than 30 million paid Microsoft 365 Copilot seats, and each deployed assistant or agent creates recurring inference demand on cloud accelerators. During our market evaluation, we noticed that managed platform services grow faster than raw compute because buyers prefer governed model hosting. Industrial users add a digital twin or simulation workload, which consumes further GPU hours.

Growth Inhibitors

What Is Restraining the AI Cloud Infrastructure Market?

Electric power and grid connection capacity are the main restraints. Global data centre electricity consumption is projected to rise from 415 TWh in 2024 to about 945 TWh by 2030, and demand from AI optimised data centres is projected to more than quadruple. Microsoft and Alphabet both said in mid 2026 that demand exceeded available capacity. Based on research conducted by NMSC, we found that energisation delays can shift revenue recognition by several quarters.

What Are the Growth Opportunities?

Can Managed Inference Platforms Capture the Shift From Training to Serving?

Providers that bundle optimised serving stacks, autoscaling, and observability can monetise the 21.10% CAGR in inference and serving. CoreWeave reported that booked annual recurring revenue for its managed inference platform exceeded USD 100 million within the first few months after launch, indicating early customer uptake of hosted inference services. Enterprises and AI native application builders benefit most, because they avoid cluster operations while paying only for tokens consumed.

Does Sovereign Cloud Create a Premium Segment for Regulated Buyers?

Government and research institutions grow at 16.89% CAGR to USD 44.96 Billion by 2035, and regulated buyers pay premiums for in country operations and certified security. Amazon announced general availability of AWS Secret Cloud for Industry in 2026, which shows hyperscalers extending classified grade environments to private sector customers. Regional providers in the Middle East and Asia can pair local ownership with accelerator access.

Can Industrial and Robotics Workloads Open a New Demand Pool?

Factories, logistics operators and robot makers are starting to offload perception, simulation and fleet learning to cloud accelerators. Cloud robotics deployments need low latency regional capacity and large simulation clusters, which favours providers with dense metro footprints. Enterprises are the fastest growing end user at 17.90% CAGR, and industrial buyers add accelerator hours that sit outside chatbot demand.

Segmentation Analysis

2025 (USD Billion)
2035 (USD Billion)
AI compute 2025: $46.12 Billion | 2035: $228.53 Billion
AI compute
AI storage and data infrastructure 2025: $9.78 Billion | 2035: $48.70 Billion
AI storage a
Managed AI platform services 2025: $13.97 Billion | 2035: $97.40 Billion
Managed AI p
AI compute $46.12 Billion $228.53 Billion 14.75%
AI storage and data infrastructure $9.78 Billion $48.70 Billion 15.27%
Managed AI platform services $13.97 Billion $97.40 Billion 18.86%

Which Offering Leads the AI Cloud Infrastructure Market?

AI compute leads with USD 46.12 Billion in 2025 and USD 228.53 Billion by 2035, because every training run and inference request consumes accelerator hours. Managed AI platform services grow fastest at 18.86% CAGR from 2026 to 2035, as buyers pay for hosted model serving, orchestration, and governance instead of assembling clusters. AI storage and data infrastructure grows at 15.27% as checkpoints, vector indexes and training corpora multiply.

2025 (USD Billion)
2035 (USD Billion)
AI compute
AI storage a
Managed AI p
Model traini
Inference an
Segment Item 2025 (USD Billion) 2035 (USD Billion) CAGR
AI compute $10.0 USD Billion $40.0 USD Billion 21.0%
AI storage and data infrastructure $17.1 USD Billion $51.1 USD Billion 23.0%
Managed AI platform services $24.2 USD Billion $62.2 USD Billion 25.0%
Model training $31.3 USD Billion $73.3 USD Billion 11.0%
Inference and serving $38.4 USD Billion $84.4 USD Billion 24.0%

Segment-wise data is locked

Unlock complete segment-wise numbers for By Workload.

Unlock Full Data
2025 (USD Billion)
2035 (USD Billion)
AI compute
AI storage a
Managed AI p
Model traini
Inference an
Segment Item 2025 (USD Billion) 2035 (USD Billion) CAGR
AI compute $10.0 USD Billion $40.0 USD Billion 26.0%
AI storage and data infrastructure $17.1 USD Billion $51.1 USD Billion 16.0%
Managed AI platform services $24.2 USD Billion $62.2 USD Billion 18.0%
Model training $31.3 USD Billion $73.3 USD Billion 8.0%
Inference and serving $38.4 USD Billion $84.4 USD Billion 23.0%

Segment-wise data is locked

Unlock complete segment-wise numbers for By End user.

Unlock Full Data

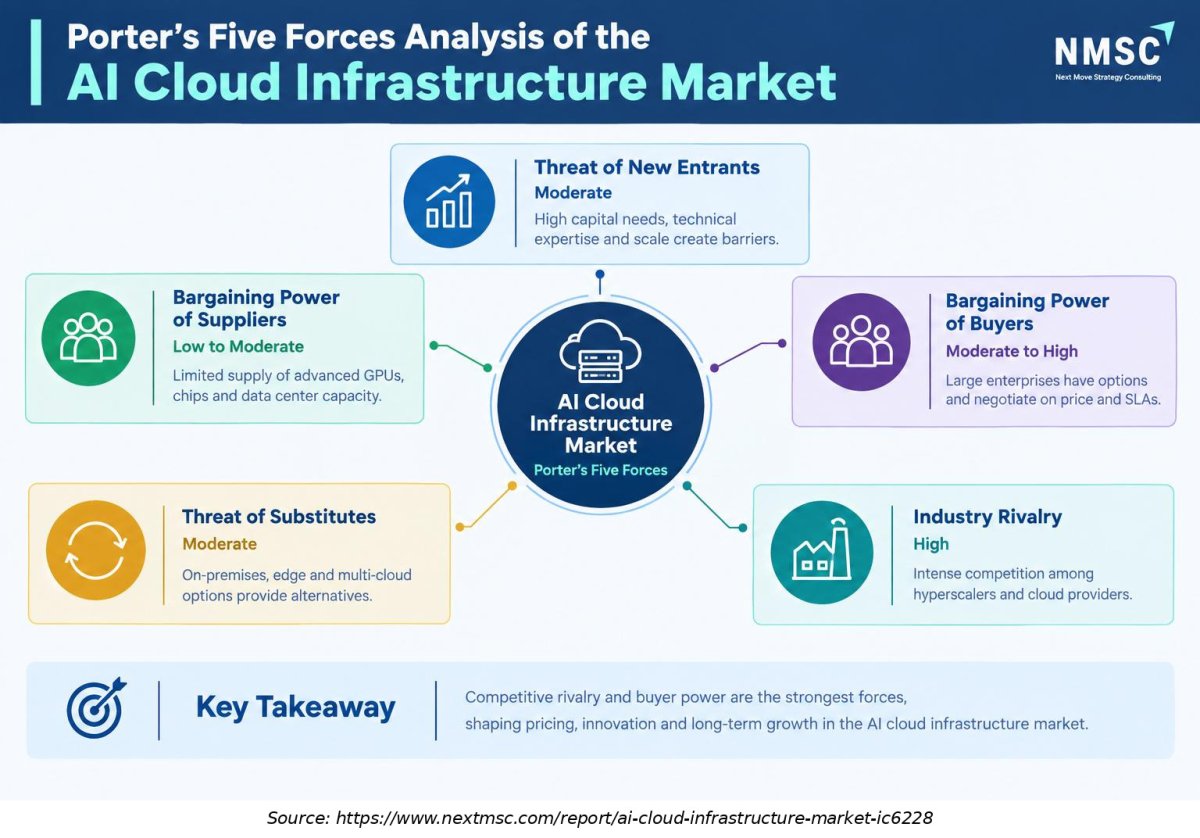
Porter’s Five Forces Analysis of the AI Cloud Infrastructure Market
Porter’s Five Forces analysis assesses competitive rivalry, supplier bargaining power, buyer bargaining power, the threat of new entrants, and substitute solutions in the AI cloud infrastructure market. High capital requirements, advanced GPU availability, infrastructure capacity, and technical expertise shape competitive positioning. Meanwhile, enterprise purchasing power, alternative deployment models, and competition among cloud providers influence pricing, service differentiation, innovation, and long-term profitability.

Growth Opportunities

Our analysis shows that three whitespace opportunities are positioned to generate outsized returns during the forecast period.

Can Managed Inference Platforms Capture the Shift From Training to Serving?

Providers that bundle optimised serving stacks, autoscaling, and observability can monetise the 21.10% CAGR in inference and serving. CoreWeave reported that booked annual recurring revenue for its managed inference platform exceeded USD 100 million within the first few months after launch, indicating early customer uptake of hosted inference services. Enterprises and AI native application builders benefit most, because they avoid cluster operations while paying only for tokens consumed.

Does Sovereign Cloud Create a Premium Segment for Regulated Buyers?

Government and research institutions grow at 16.89% CAGR to USD 44.96 Billion by 2035, and regulated buyers pay premiums for in country operations and certified security. Amazon announced general availability of AWS Secret Cloud for Industry in 2026, which shows hyperscalers extending classified grade environments to private sector customers. Regional providers in the Middle East and Asia can pair local ownership with accelerator access.

Can Industrial and Robotics Workloads Open a New Demand Pool?

Factories, logistics operators and robot makers are starting to offload perception, simulation and fleet learning to cloud accelerators. Cloud robotics deployments need low latency regional capacity and large simulation clusters, which favours providers with dense metro footprints. Enterprises are the fastest growing end user at 17.90% CAGR, and industrial buyers add accelerator hours that sit outside chatbot demand.

Regional Outlook

2025 (USD Billion)
2035 (USD Billion)
North Americ
Europe
Asia-Pacific
Middle East
Latin Americ
Region 2025 (USD Billion) 2035 (USD Billion) CAGR (%)
North America $10.0 USD Billion $40.0 USD Billion 9.0%
Europe $17.1 USD Billion $51.1 USD Billion 27.0%
Asia-Pacific $24.2 USD Billion $62.2 USD Billion 25.0%
Middle East & Africa $31.3 USD Billion $73.3 USD Billion 23.0%
Latin America $38.4 USD Billion $84.4 USD Billion 12.0%

Regional data is locked

Unlock complete regional numbers for this market.

Unlock Full Data

Competitive Landscape

Our findings suggest that scale in power, silicon and capital separates leaders from followers.

Dimension Description
Market Structure Concentrated among hyperscalers, with GPU specialists and Chinese platform clouds holding meaningful share.
Innovation Focus Custom accelerators, liquid cooling, gigawatt campuses and managed inference platforms.
M&A Activity Financing, capacity contracts and equity stakes in AI labs outweigh acquisitions.

How Do Companies Compete in the AI Cloud Infrastructure Market?

Providers compete on accelerator availability, power access, contract terms and regional footprint. Tencent cited a more favourable pricing environment in its second quarter results, and Nebius said it closed its largest AI cloud deals on its strongest terms to date. Geographic expansion follows customer demand and sovereignty rules. Pricing discipline matters because capacity is scarce, so long term contracts with prepayments replace on demand pricing for large buyers.

Which Company Archetypes Dominate the AI Cloud Infrastructure Market?

Three archetypes dominate. Full stack hyperscalers such as Amazon, Microsoft, Alphabet and Oracle combine silicon, cloud and model ecosystems. Neoclouds such as CoreWeave, Nebius and Lambda sell dense accelerator capacity with fast deployment. Chinese platform clouds such as Alibaba, Tencent, Baidu and Huawei serve a domestic market on local stacks. Differentiation themes include silicon ownership, energised capacity, model access and regulatory fit.

What Drives Innovation and Differentiation Strategy?

Innovation focuses on custom accelerators, managed inference and broader platform services. CoreWeave reported annualised recurring revenue above USD 0.40 Billion from storage, CPU, networking and software offerings that sit beside its GPU capacity. Oracle reported global GPU utilisation of 97.5%, which shows how operational efficiency supports margins. Providers differentiate through cooling design, network fabrics and developer tooling that cut time to deployment.

How Active Is M&A in the AI Cloud Infrastructure Market?

Financing and equity stakes outweigh classic acquisitions. Amazon recorded USD 53.40 Billion of non operating income in the June 2026 quarter, mainly from its Anthropic investment, and Microsoft booked gains on its OpenAI stake. Oracle sold its investment in Ampere Computing during fiscal 2026, recording a gain on the transaction as it focused on expanding its cloud infrastructure business and adopting a chip-neutral sourcing strategy.

Key Market Players

Based on research conducted by NMSC, we validated the following companies as leading providers on the basis of official filings and company disclosures.

Amazon.com, Inc. Microsoft Corporation Alphabet Inc. Oracle Corporation CoreWeave, Inc. Alibaba Group Holding Limited Tencent Holdings Limited Baidu, Inc. Nebius Group N.V. Huawei Technologies Co., Ltd. Lambda, Inc.

Latest Developments

We observed that company disclosures between June and August 2026 confirm accelerating demand and heavy capital commitments.

Date Event
July 2026 Amazon reported second-quarter AWS revenue of USD 42.2 billion, up 37% year over year, while its AI business and semiconductor business each exceeded an annualized revenue run rate of USD 25 billion.
July 2026 Microsoft reported that Azure surpassed USD 100 billion in annual revenue for fiscal 2026, with Azure and other cloud services revenue growth reaching 43% in the fourth quarter.
July 2026 Alphabet reported second-quarter Google Cloud revenue of USD 24.8 billion, up 82% year over year, and a Google Cloud revenue backlog of approximately USD 514 billion. The company also began recognizing revenue from TPU system sales.
June 2026 Oracle reported fiscal 2026 fourth-quarter cloud infrastructure revenue of USD 5.8 billion, up 93% year over year, while remaining performance obligations reached USD 638 billion, driven largely by demand for AI cloud infrastructure.

Investment Opportunities

Where Is Capital Flowing Into AI Cloud Capacity?

Capital is flowing mainly into data centres, accelerators and power. Alphabet spent USD 44.90 Billion on capital expenditure in the second quarter of 2026, with most of it directed to AI technical infrastructure, and Nebius spent about USD 5.66 Billion in the same quarter. Tencent raised its capital expenditure by 176% year over year. Investors favour providers with contracted backlog because it supports debt financing.

Which Infrastructure Investments Offer the Strongest Returns?

Returns concentrate in energised capacity, efficient cooling and custom silicon. Oracle reported GPU utilisation of 97.5%, and Alphabet said operating income in its cloud segment rose from USD 2.80 Billion to USD 8.80 Billion as scale improved. Power infrastructure, high speed networking and storage tiers that keep accelerators busy also earn attractive returns. Our findings suggest that delivery speed matters more than list price.

What ESG Considerations Shape Investment in AI Cloud Capacity?

Electricity use is the central environmental issue. Data centres consumed about 415 TWh in 2024, roughly 1.5% of global electricity, and that figure is projected to more than double by 2030. Providers respond with renewable power contracts, nuclear and gas supply agreements, water efficient cooling and chip efficiency gains. Investors increasingly require transparent reporting of power sourcing, which can lower financing costs for credible operators.

Key Benefits for Stakeholders

What Do Enterprise and Industry Leaders Gain From This Report?

Enterprise and industry leaders gain a view of how capacity, pricing and managed services will evolve from USD 100.35 Billion in 2026 to USD 374.63 Billion by 2035. The analysis shows where inference demand grows fastest at 21.10% CAGR, which supports workload placement and vendor selection. Regional and country insights help buyers align sovereignty requirements with provider footprints and negotiate multiyear commitments.

What Do Investors and Financial Analysts Gain?

Investors and financial analysts gain segment level growth rates, regional contrasts and an assessment of backlog quality. The forecast separates compute, storage and platform services, so capital can be matched to the fastest growing pockets such as managed platforms at 18.86%. Risk commentary on power, supply and customer concentration supports credit and equity underwriting across hyperscalers and neoclouds.

What Do Technology Vendors and Product Teams Gain?

Technology vendors and product teams gain a clear picture of buyer priorities, including latency, utilisation, governance and cost per token. The competitive analysis identifies three provider archetypes and their differentiation themes. Product teams can use the workload and end user segmentation to prioritise features, partner with the right capacity owners and design pricing that fits training, tuning and serving demand.

Key Market Segments Evaluated

By Offering

  • AI compute
  • AI storage and data infrastructure
  • Managed AI platform services

By Workload

  • Model training
  • Inference and serving
  • Fine tuning and data preparation

By End user

  • Enterprises
  • AI labs and AI developers
  • Government and research institutions

By Region

  • North America 
    • U.S.
    • Canada
    • Mexico
  • Europe 
    • UK
    • Germany
    • France
    • Italy
    • Spain
    • Sweden
    • Denmark
    • Finland
    • Netherlands
    • Rest of Europe
  • Asia-Pacific 
    • China
    • India
    • Japan
    • South Korea
    • Taiwan
    • Indonesia
    • Vietnam
    • Australia
    • Philippines
    • Malaysia
    • Rest of APAC
  • Middle East & Africa 
    • Saudi Arabia
    • UAE
    • Egypt
    • Israel
    • Turkey
    • Nigeria
    • South Africa
    • Rest of MEA
  • Latin America 
    • Brazil
    • Argentina
    • Chile
    • Colombia
    • Rest of LATAM

Conclusion & Recommendations

The long term outlook is strongly positive, with revenue rising from USD 100.35 Billion in 2026 to USD 374.63 Billion by 2035. Growth moderates from the 2026 ramp as capacity catches up with contracted demand, yet a 15.76% CAGR still implies the market almost quadruples. Inference, enterprise adoption and sovereign programmes replace frontier training as the main engines of expansion.

What Strategic Positioning Recommendations Does NMSC Offer?

NMSC recommends that providers secure energised capacity early, invest in custom silicon and build managed inference platforms. Neoclouds should diversify customers and lock in financing, while hyperscalers should widen sovereign regions. Enterprises should negotiate flexible multiyear contracts and avoid dependence on a single accelerator supply chain. Vendors should target regulated industries that pay premiums for compliance.

What Is the Investment Attractiveness of the AI Cloud Infrastructure Market?

Attractiveness is high but uneven across the value chain. Contracted backlog, rising utilisation and improving cloud margins support returns for scaled operators. Leverage, power delays and customer concentration reduce attractiveness for smaller entrants. Our analysis shows that managed platforms, storage tiers and power adjacent infrastructure offer more resilient returns than pure capacity rental, especially for investors who value contracted cash flows.

What Are the Market Shifts and Key Risks Through 2035?

Key shifts include inference overtaking training, custom silicon gaining share and regional capacity fragmenting under sovereignty rules. Key risks include grid constraints, accelerator and memory shortages, export controls and a slowdown in lab funding. We observed that these risks affect timing more than direction, so delays are more likely than a collapse in demand.

What Are the Primary Growth Pathways Through 2035?

Primary pathways include managed inference platforms, sovereign and regional clouds, and industrial workloads. Middle East & Africa and Asia-Pacific supply the fastest regional growth at 20.16% and 17.49% CAGR. Enterprises add USD 133.19 Billion of revenue between 2026 and 2035, which makes them the most important new buyer group for providers planning capacity and services ahead of demand.

FAQs

About the Author

Mihul Sharma

Mihul Sharma

Mihul Sharma is Research Associate at Next Move Strategy Consulting, where he has covered technology, industrial, and healthcare markets for 3 years. His work applies structured business research, market analysis, and secondary-source review to assess market trends, competitive developments, and growth opportunities. He supports report development by fully synthesizing industry data, company information, and market signals into concise findings for strategy and investment-focused research teams.

About the Reviewer

Supradip Baul

Supradip Baul

Supradip Baul is an accomplished business consultant and strategist with over a decade of rich experience in market intelligence, strategy, technology, and business transformation. His work has included rigorous qualitative and quantitative analysis across multiple industries, helping clients shape investment decisions and long-term roadmaps. Earlier in his career, he was associated with Gartner, where he contributed to industry-leading reports and market share analyses. He has worked with leading global companies and holds an MBA with a dual specialization in Marketing and Finance.

Download Free Sample

Amos Chang

AMOS CHANG

Strategy Consultant

Kardex Group

I have bought the intralogistics market reports from NMSC two times so far. Joseph and his team are always very helpful and flexible in responding to any customization requirements on the report. Their expertise in market reports really helps us steer the day-to-day business. I will definitely recommend and come back myself whenever there is a need.

Nishant Awate

NISHANT AWATE

Business Development Global Sales

Zehnder Group Deutschland GmbH

Our experience working with Next Move Strategy Consulting was positive. The team was responsive, professional, and open to incorporating our specific requirements throughout the project. The India AHU market study was comprehensive and well structured, covering market value and volume forecasts, product and application segments, and key industry trends. The inclusion of both AHU and residential MVHR market insights made the study particularly relevant for our strategic market assessment. Overall, the report provides a solid foundation for evaluating market potential, identifying priority segments, and supporting business-development decisions in India.

Kevin Coker

KEVIN COKER

Founder, CEO and Board Diector

Proxima Clinical Research

I have been using Next MSC reports for product positioning in a new geography for a long time. They have by far the best reports I have found and the price is reasonable too!

Kishu Kanda

KISHU KANDA

Strategy Analyst

Accenture

We purchased the AI Consumer Market Report from this company. Not only did they customize the report to meet our specific requirements, but they also showed great flexibility in accommodating our budget. The report we received fully met our expectations. Additionally, they provided prompt and thorough responses to both our pre-purchase and follow-up questions. We look forward to working with this company again in the future.

Henri Knyphausen

HENRI KNYPHAUSEN

Partner at Singulier [Ex-BCG]

Singulier

I recently engaged NEXTMSC.com for a commercial due diligence project within the intralogistics sector, and I am pleased to provide a reference based on my experience. In utilizing NEXTMSC.com's services, I found their report to offer valuable insights into market dynamics and key industry players. The initial report provided a solid foundation for our analysis. However, as we were investigating a smaller target in the market, and I had specific customization requests requiring additional research. These requests included detailed information on product portfolios of various players and sub-market sizes, both inclusive and exclusive of certain product categories. NEXTMSC.com demonstrated commendable responsiveness and agility in accommodating these customization requests. Within a timeframe of 1-2 weeks, they delivered a revised report that met our specific needs. Furthermore, they were receptive to my follow-up inquiries, ensuring clarity and understanding of the data provided. The final deliverable significantly contributed to our due diligence efforts. One of NEXTMSC.com's notable strengths lies in their qualitative research capabilities. However, for future engagements, I would recommend the inclusion of a quantified market model in Excel format. Such a model would offer the ability to conduct in-depth analyses and explore various market segments, including country-specific data and subcomponent breakdowns. Based on my positive experience, I would not hesitate to work with NEXTMSC.com again. Their responsiveness, willingness to accommodate customization requests, and commitment to delivering actionable insights make them a reliable partner for commercial research projects.

Custom Market Research Services

We will customize the research for you if the listed report does not fully match your requirements.

Get 30% Free Customization

Select License

This website uses cookies to ensure you get the best experience on our website. Learn more

✖