Cloud Data Centers Market Global Industry Analysis and Forecast (2026–2035)

The Cloud Data Centers Market grew to USD 410.00 Billion in 2025 and is forecast to reach USD 1,520.00 Billion by 2035, advancing at a 9.0% CAGR from 2026 to 2035 on AI capacity demand, with North America leading.
Download Free Sample PDF
Base Year (2025)
$410.00 Billion
Forecast (2035)
$1,520.00 Billion
CAGR (2026-2035)
9.0%
Top Region
North America

What Is the Cloud Data Centers Market Size?
The global Cloud Data Centers Market reached USD 410.00 Billion in 2025 and is estimated at USD 700.00 Billion in 2026, advancing to USD 1,520.00 Billion by 2035 at a 9.0% CAGR from 2026 to 2035. In 2026, North America leads the global market with a 56% share, while hyperscale cloud facilities account for 72% of total market spending.
NMSC's analysis indicates that scale buyers, secured power and AI workloads set the pace of spending in every segment.

The annual market size is projected to increase by USD 820.00 Billion between 2026 and 2035. Operators that secure reliable power and grid connections early may be better positioned to capture demand.

Reported backlog and remaining performance obligations at major cloud and AI infrastructure providers indicate strong future demand. However, these measures differ by company and should not be treated as equivalent to committed data center investment.

Cloud Data Centers Market Global Industry Analysis and Forecast (2026–2035) Revenue Forecast
Values in USD Billion

2025 $410.00 Billion
2025
2026 $700.00 Billion
2026
2027 $763.00 Billion
2027
2028 $831.67 Billion
2028
2029 $906.52 Billion
2029
2030 $988.11 Billion
2030
2031 $1,077.04 Billion
2031
2032 $1,173.97 Billion
2032
2033 $1,279.63 Billion
2033
2034 $1,394.79 Billion
2034
2035 $1,520.00 Billion
2035

Key Takeaways

Market Size 2025: USD 410.00 Billion

Market Size 2026 (Estimated): USD 700.00 Billion

Market Size 2035 (Forecast): USD 1,520.00 Billion

CAGR 2026–2035: 9.0%

Dominant Region: North America held the largest share, expanding from USD 237.80 Billion in 2025 to USD 775.20 Billion by 2035.

Fastest-Growing Region: Middle East & Africa, at 12.2% CAGR from 2026 to 2035, rising from USD 16.40 Billion to USD 98.80 Billion.

Dominant Country: U.S., growing from USD 226.00 Billion in 2025 to USD 730.00 Billion by 2035.

Fastest-Growing Country: India, at 15.7% CAGR from 2026 to 2035, rising from USD 7.00 Billion to USD 52.00 Billion.

By Facility Type: Hyperscale cloud facilities held the largest share, rising from USD 307.50 Billion in 2025 to USD 1,056.40 Billion by 2035; colocation and wholesale facilities grow fastest at 10.2% CAGR.

By Component: Servers and compute held the largest share, rising from USD 205.00 Billion to USD 714.40 Billion; power and cooling grows fastest at 10.9% CAGR.

By Workload: AI and accelerated computing held the largest share, rising from USD 196.80 Billion to USD 957.60 Billion, and is also the fastest growing at 10.7% CAGR.

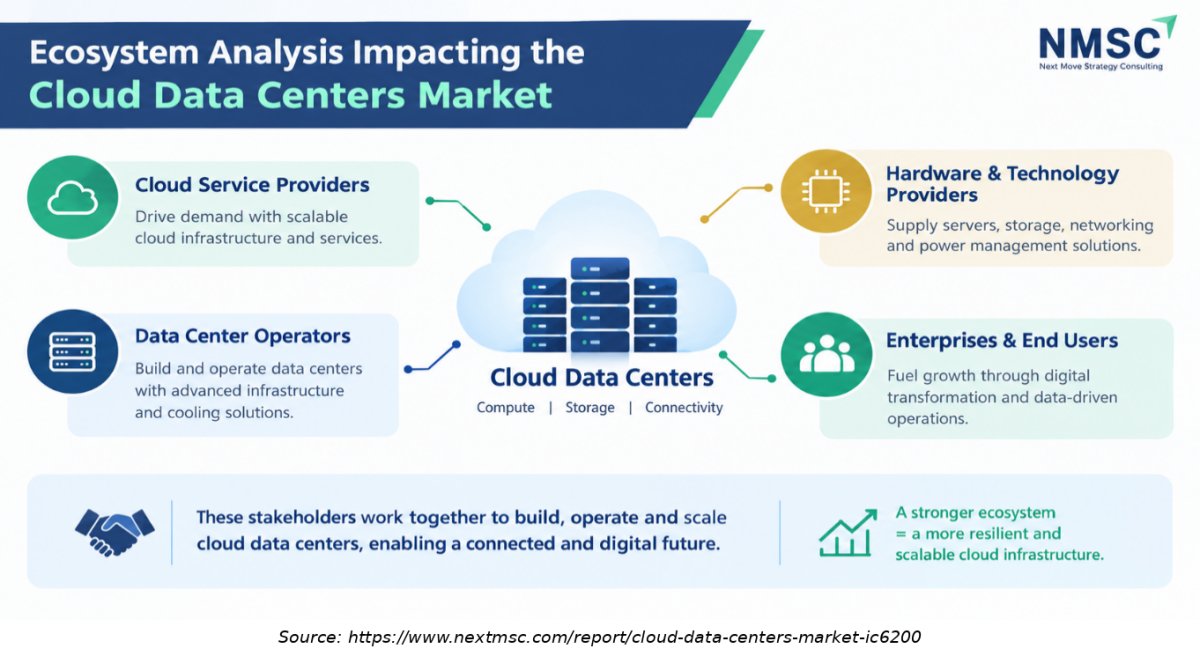
Ecosystem Analysis Impacting the Cloud Data Centers Market
The cloud data centers Market ecosystem brings together cloud service providers, data center operators, hardware suppliers, technology partners, and enterprises. These stakeholders collaborate to deliver scalable infrastructure, reliable cloud services, and efficient digital operations.

What Does the Cloud Data Centers Market Encompass?

This study covers purpose-built facilities and the servers, storage, networking, power and cooling systems that host public, private and hybrid cloud services. Facilities may be owned by hyperscale providers, leased from colocation and wholesale developers or operated at enterprise and edge sites. Market value reflects annual investment in construction, equipment and related services, measured when capital is deployed and expressed in USD Billion for a single global scope.

Structurally, the industry has moved from megawatt halls to gigawatt programs, with dedicated AI halls, liquid cooling and on-site generation now common. Regulation is tightening in parallel. The European Union requires data centers above 500 kW to report energy performance, and it has adopted a rating scheme that labels energy and water efficiency. In the United States, federal estimates show data centers used 4.4% of national electricity in 2023.

Market Drivers & Dynamics

Interactive Dataset
AI and hyperscale capacity commitments driver +2.4% Global, led by North America 2026–2030
Backlog conversion from multiyear cloud contracts driver +1.3% North America, Asia-Pacific 2026–2029
Enterprise migration and sovereign cloud mandates driver +1.1% Europe, Middle East, India 2026–2032
Liquid cooling and higher rack density efficiency driver +0.6% Global 2026–2032
Grid interconnection and power availability limits restraint −1.8% North America, Europe, Japan 2026–2031
Memory and component price inflation restraint −0.7% Global 2026–2028
Efficiency reporting and rating rules restraint −0.4% Europe 2027–2030
Source: Next Move Strategy Consulting

Growth Drivers

What Is the Primary Growth Driver of the Cloud Data Centers Market?

The primary driver is AI workload demand. Global data center electricity demand is projected to more than double by 2030 to around 945 TWh, and demand from AI optimized data centers is projected to more than quadruple. Providers confirm the signal through contracted backlog, with Oracle reporting remaining performance obligations of USD 638 Billion in June 2026. Capacity, not customer interest, is the binding limit.

How Is Enterprise Cloud Adoption Driving Market Growth?

Enterprise migration keeps general purpose cloud computing capacity growing alongside AI. Azure revenue passed USD 100 Billion in Microsoft's fiscal 2026, and AWS sales rose 37% in the June 2026 quarter. In the United States, data centers used about 4.4% of electricity in 2023, and federal projections put the share at 6.7% to 12% by 2028. We found that renewals and new migrations both lift demand for servers, storage and networking.

Growth Inhibitors

What Is Restraining the Cloud Data Centers Market?

Power access is the main restraint. Rising data center electricity demand is expected to increase pressure on grid capacity and interconnection timelines, making power availability a significant constraint on new facility development. Memory and storage price inflation, cited by Amazon management in July 2026, adds cost, and European reporting and rating rules add compliance work. Operators respond with on-site generation and backup power, though these measures raise capital needs.

What Are the Growth Opportunities?

Where Does Green Data Center Development Create Value?

Efficiency rules in Europe and corporate carbon targets reward operators that cut energy and water use. Heat reuse, renewable power contracts and high efficiency cooling can turn compliance into a pricing advantage, since tenants increasingly screen sites by rating. We project that green datacenter designs capture a rising share of new colocation leasing, particularly in Germany, France and the Nordic region through 2030.

How Large Is the Sovereign AI Infrastructure Opportunity?

National programs in the Gulf, India and Europe are funding domestic AI capacity so that models and data remain under local control. Saudi Arabia and the UAE are the clearest examples, supported by abundant energy and state backed investment. We estimate that sovereign AI infrastructure projects add several percentage points to regional growth, creating anchor demand for operators able to deliver certified, secure facilities.

Why Does Network Capacity Offer a Second Wave of Demand?

Cluster scale training and inference depend on dense optical and Ethernet fabrics, and campus to campus links are growing as workloads are spread across sites. Networking rises from USD 63.00 Billion in 2026 to USD 152.00 Billion by 2035 in our model. Vendors of switches, optics and interconnect services gain, as does any operator with strong carrier neutral connectivity inside its datacenternetworking footprint.

Segmentation Analysis

2025 (USD Billion)
2035 (USD Billion)
Hyperscale cloud facilities 2025: $307.50 Billion | 2035: $504.00 Billion
Hyperscale c
Colocation and wholesale facilities 2025: $69.70 Billion | 2035: $140.00 Billion
Colocation a
Enterprise and edge cloud facilities 2025: $32.80 Billion | 2035: $56.00 Billion
Enterprise a
Hyperscale cloud facilities $307.50 Billion $504.00 Billion 1,056.40
Colocation and wholesale facilities $69.70 Billion $140.00 Billion 334.40
Enterprise and edge cloud facilities $32.80 Billion $56.00 Billion 129.20

Why Do Hyperscale Cloud Facilities Dominate the Market?

Hyperscale providers fund their own campuses because scale lowers unit cost and protects control over custom silicon and network design. Google Cloud revenue rose 82% to USD 24.8 Billion in the June 2026 quarter, and Alibaba reported AI cloud and compute revenue growth of 45%. These results sustain internal build programs, so the segment moves from USD 307.50 Billion in 2025 to USD 1,056.40 Billion by 2035. Leased capacity from colocation developers supplement owned sites.

2025 (USD Billion)
2035 (USD Billion)
Servers and
Storage
Networking
Power and co
Facility con
Segment Item 2025 (USD Billion) 2035 (USD Billion) CAGR
Servers and compute $10.0 USD Billion $40.0 USD Billion 13.0%
Storage $17.1 USD Billion $51.1 USD Billion 19.0%
Networking $24.2 USD Billion $62.2 USD Billion 13.0%
Power and cooling $31.3 USD Billion $73.3 USD Billion 11.0%
Facility construction and services $38.4 USD Billion $84.4 USD Billion 12.0%

Segment-wise data is locked

Unlock complete segment-wise numbers for By Component.

Unlock Full Data
2025 (USD Billion)
2035 (USD Billion)
AI and accel
General clou
Data storage
backup and a
Segment Item 2025 (USD Billion) 2035 (USD Billion) CAGR
AI and accelerated computing $10.0 USD Billion $40.0 USD Billion 21.0%
General cloud and enterprise applications $17.1 USD Billion $51.1 USD Billion 23.0%
Data storage $24.2 USD Billion $62.2 USD Billion 25.0%
backup and analytics $31.3 USD Billion $73.3 USD Billion 11.0%

Segment-wise data is locked

Unlock complete segment-wise numbers for By Workload.

Unlock Full Data

Growth Opportunities

We identified three opportunity areas where capital, policy and demand overlap most closely through 2035.

Where Does Green Data Center Development Create Value?

Efficiency rules in Europe and corporate carbon targets reward operators that cut energy and water use. Heat reuse, renewable power contracts and high efficiency cooling can turn compliance into a pricing advantage, since tenants increasingly screen sites by rating. We project that green datacenter designs capture a rising share of new colocation leasing, particularly in Germany, France and the Nordic region through 2030.

How Large Is the Sovereign AI Infrastructure Opportunity?

National programs in the Gulf, India and Europe are funding domestic AI capacity so that models and data remain under local control. Saudi Arabia and the UAE are the clearest examples, supported by abundant energy and state backed investment. We estimate that sovereign AI infrastructure projects add several percentage points to regional growth, creating anchor demand for operators able to deliver certified, secure facilities.

Why Does Network Capacity Offer a Second Wave of Demand?

Cluster scale training and inference depend on dense optical and Ethernet fabrics, and campus to campus links are growing as workloads are spread across sites. Networking rises from USD 63.00 Billion in 2026 to USD 152.00 Billion by 2035 in our model. Vendors of switches, optics and interconnect services gain, as does any operator with strong carrier neutral connectivity inside its datacenternetworking footprint.

Regional Outlook

2025 (USD Billion)
2035 (USD Billion)
North Americ
Europe
Asia-Pacific
Middle East
Latin Americ
Region 2025 (USD Billion) 2035 (USD Billion) CAGR (%)
North America $10.0 USD Billion $40.0 USD Billion 9.0%
Europe $17.1 USD Billion $51.1 USD Billion 27.0%
Asia-Pacific $24.2 USD Billion $62.2 USD Billion 25.0%
Middle East & Africa $31.3 USD Billion $73.3 USD Billion 23.0%
Latin America $38.4 USD Billion $84.4 USD Billion 12.0%

Regional data is locked

Unlock complete regional numbers for this market.

Unlock Full Data

Competitive Landscape

Our review shows a two-tier structure of self-building hyperscale’s and capacity developers, with AI specialists forming a third group.

How Concentrated Is the Cloud Data Centers Market?

Spending is concentrated among a handful of providers. Amazon, Microsoft and Alphabet together account for the majority of owned capacity, and Oracle, Alibaba and Tencent add large programs in the United States and China. Colocation developers such as Equinix and Digital Realty fragment the leased segment across many metros. The largest hyperscale cloud providers exert significant influence on data center investment. Any quantified estimate of their combined spending share should be supported by a consistent and traceable calculation.

How Are Mergers and Partnerships Reshaping the Landscape?

Capital partnerships and acquisitions are broadening the set of capacity providers. On June 22, 2026, Digital Realty announced an agreement to acquire Columbia Capital. Core Weave reported revenue backlog of approximately USD 104 Billion as of June 30, 2026. NTT DATA has committed USD 10 Billion through 2027. These moves show that specialist and infrastructure investors increasingly fund capacity alongside the large cloud platforms.

Where Are New Entrants and Specialists Finding Room?

AI focused providers such as Core Weave show that specialist clouds can win large contracts by offering dense GPU capacity quickly. Regional operators in India, the Gulf and Europe find openings through sovereignty rules and local partnerships. Entrants still face obstacles in power access, equipment lead times and financing costs, so many pair with established developers or secure anchor customers before breaking ground.

Key Market Players

Our analysis profiles ten companies validated from official filings and press releases:

Amazon.com, Inc. (Amazon Web Services) Microsoft Corporation Alphabet Inc. (Google Cloud) Oracle Corporation Alibaba Group Holding Limited Tencent Holdings Limited Equinix, Inc. Digital Realty Trust, Inc. Core Weave, Inc. Nippon Telegraph and Telephone Corporation (NTT DATA)

Latest Developments

Recent company and policy events show how quickly capacity commitments are growing:

Date Event
July 2026 Microsoft reported fiscal 2026 results, with Azure revenue surpassing USD 100 Billion for the first time.
July 2026 Equinix raised its 2026 guidance and lifted full year capital spending expectations to USD 5 Billion to USD 6 Billion.
July 2026 Amazon reported AWS net sales up 37% to USD 42.2 Billion in the June 2026 quarter, its fastest growth in 18 quarters.
August 2026 Core Weave reported record second quarter 2026 revenue and contracted backlog of about USD 104 Billion.
June 2026 Oracle reported fiscal 2026 fourth quarter results with remaining performance obligations of USD 638 Billion.

Expert Insights

John Dinsdale

Chief Analyst | Synergy Research Group

"“The number of operational hyperscale data centers continues to grow inexorably, having doubled over the past five years.”"

Analyst Interpretation

The statement highlights the continued expansion of hyperscale data centers supporting cloud computing and digital services. Growing cloud adoption and AI workloads are increasing the importance of large-scale computing infrastructure. This trend supports investment in hyperscale facilities, expanded computing capacity, and infrastructure designed to accommodate increasingly demanding cloud and AI workloads

Investment Opportunities

Which Investment Segments Offer the Strongest Returns?

Power and cooling and AI workloads show the strongest growth in our model, at 10.9% and 10.7% CAGR from 2026. Suppliers of electrical gear, liquid cooling and optical networking are exposed to every new campus regardless of which provider wins the tenant. Developers with energized land hold a scarcity advantage that supports leasing prices.

Which Regions Present the Best Entry Points?

Middle East and Africa at 12.2% and Asia-Pacific at 10.6% CAGR from 2026 grow fastest, led nationally by India at 15.7%. North America remains the deepest pool of capital and tenants, while Europe offers stable returns for efficient, compliant sites. Investors can balance risk by pairing mature hubs with selected emerging markets.

How Should Investors Manage Power and Supply Risk?

Securing grid interconnection, equipment slots and renewable supply early reduce schedule risk and protects returns. Long term power contracts, on site generation and phased construction help match capacity to tenant demand. Investors should also test exposure to memory and storage price swings, since component inflation can shift project economics even when leasing demand is strong.

Key Benefits for Stakeholders

How Do Cloud Providers Benefit from This Report?

Cloud providers gain a benchmark of spending by facility type, component and workload, which helps them test build plans against peers. The regional and country detail highlights were sovereign rules and power conditions Favor new regions. Planning teams can use the segment growth rates to prioritize cooling, networking and storage investments across the forecast period.

How Do Developers and Equipment Suppliers Benefit?

Colocation developers and equipment makers can size demand pools by component and region, then align production and land plans accordingly. The study identifies where AI workloads lift power and cooling needs fastest and where enterprise adoption sustains general purpose capacity. Suppliers can also gauge how procurement may shift toward liquid cooling and higher voltage distribution.

How Do Investors and Policymakers Benefit?

Investors receive a clear view of growth, risk and entry points across 16 national markets, while policymakers see how energy and efficiency rules interact with capacity planning. The analysis shows that grid access, rather than demand, limits growth in several regions. That insight supports decisions on incentives, permitting and long-term power infrastructure.

Key Market Segments Evaluated

By Facility Type

  • Hyperscale cloud facilities
  • Colocation and wholesale facilities
  • Enterprise and edge cloud facilities

By Component

  • Servers and compute
  • Storage
  • Networking
  • Power and cooling
  • Facility construction and services

By Workload

  • AI and accelerated computing
  • General cloud and enterprise applications
  • Data storage, backup and analytics

By Region

  • North America 
    • U.S.
    • Canada
    • Mexico
  • Europe 
    • UK
    • Germany
    • France
  • Asia-Pacific 
    • China
    • India
    • Japan
    • South Korea
    • Australia
  • Middle East & Africa 
    • UAE
    • Saudi Arabia
    • South Africa
  • Latin America 
    • Brazil
    • Argentina

Conclusion & Recommendations

The Cloud Data Centers Market is set to grow from USD 700.00 Billion in 2026 to USD 1,520.00 Billion by 2035, a 9.0% CAGR. Growth stays strong through 2030 as AI capacity is delivered, then moderates as energy limits and efficiency gains slow the rate of additions. Backlog at leading providers gives unusual visibility into the next several years of spending.

What Strategic Positioning Recommendations Does NMSC Offer?

We recommend that operators prioritize secured power, flexible designs that can switch between air and liquid cooling, and diversified tenant bases. Equipment suppliers should align capacity with long lead orders from the largest buyers. Regional players can differentiate through sovereign compliance and strong interconnection, rather than competing on scale with the global platforms.

How Does Investment Attractiveness Look for the Cloud Data Centers Market?

Investment attractiveness is high, supported by USD 820.00 Billion of incremental spending between 2026 and 2035 and by long dated customer commitments. Returns are most secure where land, power and tenants are aligned in advance. Valuation and financing conditions require care, since heavy borrowing by some providers raises sensitivity to interest rates and delivery delays.

What Are the Market Shifts and Key Risks in the Cloud Data Centers Market?

Key shifts include the move to gigawatt campuses, rising liquid cooling adoption and growth in sovereign capacity. Main risks are grid delays, component price inflation, tightening efficiency rules and the possibility that AI demand grows more slowly than contracted plans assume. Diversified portfolios and phased builds reduce exposure to any single risk.

What Are the Primary Growth Pathways Through 2035?

Growth pathways include AI and accelerated computing, which reaches USD 957.60 Billion by 2035, expansion of colocation and wholesale capacity at 10.2% CAGR, and rapid build out in Middle East and Africa and India. Each pathway depends on timely power delivery, which remains the decisive factor for realized growth and the main variable separating leaders from laggards.

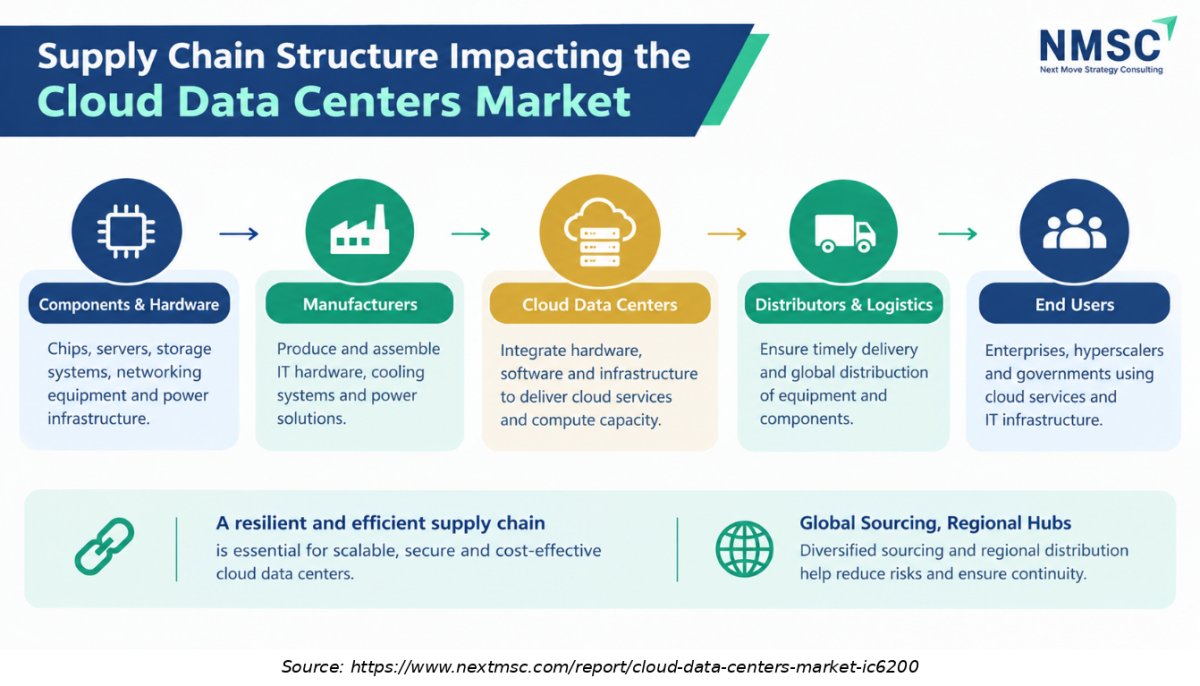
Supply Chain Structure Impacting the Cloud Data Centers Market

The cloud data center supply chain connects component suppliers, hardware manufacturers, distributors, logistics providers, and data center operators. Each stage ensures the timely availability of critical equipment, supporting reliable operations and the expansion of cloud infrastructure

FAQs

Liquid cooling helps manage heat generated by high-density AI racks. Demand for power distribution and advanced cooling infrastructure is expected to increase as rack densities rise

Sources & References

1.

International Energy Agency: Energy and AI

iea.org
2.

Lawrence Berkeley National Laboratory: 2024 U.S. Data Center Energy Usage Report

energyanalysis.lbl.gov
3.

U.S. Department of Energy: Data center electricity demand report

energy.gov
4.

European Commission: Energy performance of data centres

energy.ec.europa.eu
5.

European Commission: Rating scheme for data centres calls for feedback

energy.ec.europa.eu
6.

Amazon.com, Inc.: official filing or press release

sec.gov
7.

Microsoft Corporation: official filing or press release

sec.gov
8.

Alphabet Inc.: official filing or press release

abc.xyz
9.

Oracle Corporation: official filing or press release

oracle.com
10.

Alibaba Group Holding Limited: official filing or press release

sec.gov
11.

Tencent Holdings Limited: official filing or press release

tencent.com
12.

Equinix, Inc.: official filing or press release

newsroom.equinix.com
13.

Digital Realty Trust, Inc.: official filing or press release

investor.digitalrealty.com/node/30551/pdf
14.

CoreWeave, Inc.: official filing or press release

investors.coreweave.com
15.

NTT DATA: global data center footprint announcement

nttdata.com

About the Author

Mihul Sharma

Mihul Sharma

Mihul Sharma is Research Associate at Next Move Strategy Consulting, where he has covered technology, industrial, and healthcare markets for 3 years. His work applies structured business research, market analysis, and secondary-source review to assess market trends, competitive developments, and growth opportunities. He supports report development by fully synthesizing industry data, company information, and market signals into concise findings for strategy and investment-focused research teams.

About the Reviewer

Supradip Baul

Supradip Baul

Supradip Baul is an accomplished business consultant and strategist with over a decade of rich experience in market intelligence, strategy, technology, and business transformation. His work has included rigorous qualitative and quantitative analysis across multiple industries, helping clients shape investment decisions and long-term roadmaps. Earlier in his career, he was associated with Gartner, where he contributed to industry-leading reports and market share analyses. He has worked with leading global companies and holds an MBA with a dual specialization in Marketing and Finance.

Download Free Sample

Robert Sean Trevino

ROBERT SEAN TREVINO

Sr. Director, Head of Strategic Insights & Analytics

Foundation Medicine

I realized that it was a reliable source of information. These days, there are many people who are looking for authentic data, and this is one of the only sources that can offer them with what they need;

Mohit Agarwal

MOHIT AGARWAL

Chief Manager

DryChem India Pvt. Ltd.

Next Move Strategy Consulting is an amazing team of consultants. We required a market study report for our investors on top priority and the team went above and beyond our expectations to deliver the same with ample supporting data within a short time span enabling us to secure the investments and keep our project timeline maintained. Their professionalism, attention to detail, and timely delivery of actionable recommendations have left a lasting impression on our organization.

Amos Chang

AMOS CHANG

Strategy Consultant

Kardex Group

I have bought the intralogistics market reports from NMSC two times so far. Joseph and his team are always very helpful and flexible in responding to any customization requirements on the report. Their expertise in market reports really helps us steer the day-to-day business. I will definitely recommend and come back myself whenever there is a need.

Ross J Mckenzie

ROSS J MCKENZIE

Business Insight Manager

Staysure Group

“Next MSC have been incredibly helpful in providing detailed & robust information on our market, alongside quantifying growth by different segments. The process to procure was simple and easy, with sample reports and regular contact to ensure we had what we needed. Succinct detail on their sources & methodologies is also greatly received, allowing transparency in this respect helps build trust in the detail you pay for. Joseph in particular was fantastic, and helped ensure efficient provision of the insight pack – thank you NMSC!”.

Melanie Samko

MELANIE SAMKO

Director of Marketing

TOSOH BIOSCIENCE, INC.

The information provided by NMSC is incredibly valuable, thank you so much for such a excellent work. I really appreciate it. I will make sure to reference all of it, in my summary document.

Custom Market Research Services

We will customize the research for you if the listed report does not fully match your requirements.

Get 30% Free Customization

Select License

This website uses cookies to ensure you get the best experience on our website. Learn more

✖