Bioactive Ingredients Market Analysis and Forecast (2026–2035)

Rising ageing populations, preventive health spending and fermentation-based innovation lift the global Bioactive Ingredients Market from USD 24.80 Billion in 2025 to USD 50.20 Billion by 2035, a 7.3% CAGR over 2026–2035, with North America leading and Asia-Pacific growing fastest.

Download Free Sample PDF
Base Year (2025)
$24.80 Billion
Forecast (2035)
$50.20 Billion
CAGR (2026-2035)
7.3%
Top Region
North America

What Is the Bioactive Ingredients Market Size?

The global Bioactive Ingredients Market reached USD 24.80 Billion in 2025 and is estimated at USD 26.60 Billion in 2026. It is forecast to reach USD 50.20 Billion by 2035, expanding at a 7.3% CAGR from 2026 to 2035. North America leads with about 33% share, while plant extracts and botanicals dominate the type segment with about 33% share.

We observed that demand is shifting from general nutrition toward ingredients that carry clinical evidence, strain or extract specific identity and a defined mechanism of action. Suppliers that own trial data and control fermentation, extraction or peptide processing capacity earn pricing power with brand owners. This evidence led purchasing pattern explains why revenue concentrates in branded ingredients while commodity forms face margin pressure.

Our assessment indicates that probiotics, prebiotics and peptides deliver the largest absolute gains.

Bioactive Ingredients Market Analysis and Forecast (2026–2035) Revenue Forecast

Values in USD Billion

2025 $24.80 Billion
2025
2026 $26.60 Billion
2026
2027 $28.54 Billion
2027
2028 $30.63 Billion
2028
2029 $32.86 Billion
2029
2030 $35.26 Billion
2030
2031 $37.83 Billion
2031
2032 $40.60 Billion
2032
2033 $43.56 Billion
2033
2034 $46.74 Billion
2034
2035 $50.20 Billion
2035

Key Takeaways

By Type: Plant extracts and botanicals held the largest share, expanding from USD 8.10 Billion in 2025 to USD 15.30 Billion by 2035; Probiotics is the fastest growing at 8.6% CAGR from 2026–2035.

By Source: Plant sourced held the largest share, expanding from USD 9.90 Billion in 2025 to USD 19.00 Billion by 2035; Microbial is the fastest growing at 8.3% CAGR from 2026–2035.

By Application: Dietary supplements and nutraceuticals held the largest share, expanding from USD 11.20 Billion in 2025 to USD 22.50 Billion by 2035; Pharmaceuticals is the fastest growing at 8.4% CAGR from 2026–2035.

Dominant Region: North America held about 32.5% share in 2026, growing from USD 8.10 Billion in 2025 to USD 14.30 Billion by 2035.

Fastest-Growing Region: Asia-Pacific is projected to grow at 9.5% CAGR from 2026–2035, reaching USD 17.50 Billion by 2035.

Dominant Country: U.S. accounted for USD 7.00 Billion in 2025 and is projected to reach USD 12.20 Billion by 2035.

Fastest-Growing Country: India is projected to grow at 11.7% CAGR from 2026–2035, reaching USD 2.70 Billion by 2035.

Between 2026 and 2035, the Bioactive Ingredients Market offers an absolute opportunity of about USD 23.60 Billion for investors.
According to NMSC analysis, microbial sourced ingredients gain share fastest because fermentation lowers dependence on agricultural and marine raw materials, which shortens supply chains and improves batch consistency. This shift lets suppliers publish stable clinical dosing and defend premium prices against botanical extracts that vary by harvest, origin and processing method across seasons.

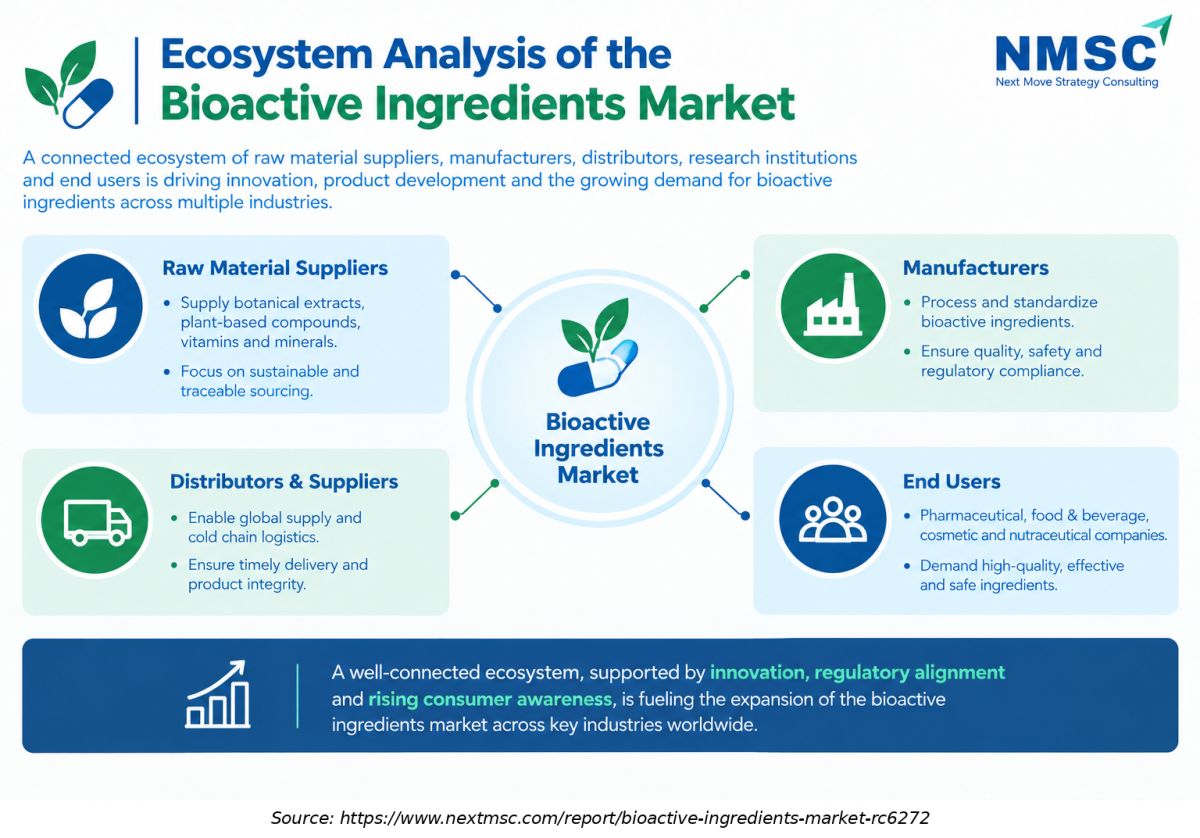
Ecosystem Analysis of the Bioactive Ingredients Market

The infographic outlines the Ecosystem Analysis of the Bioactive Ingredients Market, highlighting key stakeholders such as raw material suppliers, manufacturers, distributors, and end-users across pharmaceutical, food and beverage, cosmetic, and nutraceutical industries. It emphasizes how sustainable sourcing, product quality, efficient distribution, regulatory alignment, and consumer awareness contribute to innovation, supply chain efficiency, and market growth

What Does the Bioactive Ingredients Market Encompass?

The bioactive ingredients market covers purified or standardised compounds, live cultures and extracts that deliver a measurable physiological benefit beyond basic nutrition. Our scope includes probiotics, prebiotics, plant extracts and botanicals, omega-3 and functional lipids, and proteins and bioactive peptides sold into dietary supplements, food and beverages, pharmaceuticals, personal care and animal nutrition. Commodity vitamins, bulk minerals and standalone enzymes sit outside the definition to prevent double counting with adjacent markets.

Regulation shapes commercial scope. In the European Union, Regulation (EC) No 1924/2006 requires that health claims are authorised and listed in the EU Register before use, which rewards suppliers with robust clinical files. Technology adoption centres on fermentation, standardised extraction and delivery systems that improve stability and bioavailability. Clinical substantiation, standardised ingredient specifications and manufacturing consistency may help suppliers differentiate their products. Any claim that these capabilities command a pricing premium should be supported by company disclosures, customer evidence or documented industry research.

Market Drivers & Dynamics

Interactive Dataset
Ageing population and chronic condition prevention driver +1.4% Global, strongest in Asia-Pacific and Europe 2026–2035
Rising dietary supplement penetration driver +1.1% North America, Europe, Asia-Pacific 2026–2032
Fermentation and precision biotechnology scale up driver +0.9% Europe, North America, China 2026–2033
Pharmaceutical and medical nutrition adoption driver +0.7% North America, Europe, Japan 2027–2035
Health claim authorisation and substantiation cost restraint −0.8% Europe, North America 2026–2031
Price pressure in commoditised lipids and collagen grades restraint −0.6% Global 2026–2029
Botanical raw material volatility and adulteration risk restraint −0.5% Asia-Pacific, Latin America 2026–2030
Source: Next Move Strategy Consulting

Growth Drivers

What Is the Primary Growth Driver in the Bioactive Ingredients Market?

Population ageing is the primary driver of the bioactive ingredients market. The World Health Organization projects that one in six people worldwide will be aged 60 years or over by 2030, rising to 1.4 billion people, and to 2.1 billion by 2050. Supplement use rises with age, and U.S. survey data show that 75.9% of adults aged 60 and older used a supplement in the latest period. Older consumers buy joint, cognitive, gut and cardiovascular ingredients with proven benefit.

How Is Preventive Healthcare Demand Driving Bioactive Ingredients Market Growth?
Preventive health spending is lifting repeat purchase of evidence-backed ingredients. The U.S. National Center for Health Statistics reports that 60.2% of adults used a dietary supplement and 38.7% used two or more between August 2021 and August 2023. Kerry recorded 8% pharma and other volume growth in 2025, and ADM reported higher human nutrition sales in the fourth quarter of 2025. Growth in demand also widens pharmaceutical-grade production.

Growth Inhibitors

What Is Restraining the Bioactive Ingredients Market?

Regulatory substantiation and price pressure restrain returns. EU rules require health claims to be authorised and entered in the EU Register before use, so suppliers fund trials before they can market a benefit. BASF reported that its Nutrition & Health division's sales declined 11.8% in 2025 and volumes declined 4.2%; the company attributed part of the volume weakness to vitamin A, vitamin E and carotenoid products affected by the 2024 isophytol-plant fire. This is a company-specific supply-disruption example, not direct evidence of market-wide price pressure in bioactive lipids or collagen peptides. Smaller suppliers without clinical files find premium channels harder to enter.

What Are the Growth Opportunities?

Can Targeted Probiotics and Postbiotics Unlock Pharmaceutical-grade Demand?

Pharmaceutical and medical nutrition buyers pay for strain level evidence, controlled manufacturing and stable dosing. Suppliers that convert supplement strains into trial backed adjunct products can lift price per kilogram and secure multiyear supply contracts. Contract fermentation specialists and strain owners benefit most, and the bioactive ingredients market gains a higher margin channel that dilutes supplement seasonality.

Does Personalised Nutrition Open a Premium Channel for Standardised Botanicals?

Brands building personalized nutrition programmes need standardised, dose-consistent extracts that can be recombined by genotype, microbiome or biomarker profile. Botanical suppliers with certificates of analysis and clinical dosing ranges become preferred partners. Digital health platforms and contract formulators benefit first, because they can bundle subscriptions with traceable ingredients across supplement and food channels.

Will Algal and Fermentation Derived Lipids Replace Constrained Marine Supply?

Algal lipids avoid fish stock variability and meet vegetarian positioning in infant and adult nutrition, which broadens addressable demand. dsm-firmenich reported strong growth in algal lipid solutions during 2025, which confirms demand beyond fish oil. Algae oil producers that scale fermentation capacity can serve brand owners seeking sustainable, concentrated omega-3 supply for premium products.

Segmentation Analysis

2025 (USD Billion)
2035 (USD Billion)
Probiotics 2025: $5.90 Billion | 2035: $13.60 Billion
Probiotics
Prebiotics 2025: $3.90 Billion | 2035: $8.20 Billion
Prebiotics
Plant extracts and botanicals 2025: $8.10 Billion | 2035: $15.30 Billion
Plant extrac
Omega-3 and functional lipids 2025: $4.20 Billion | 2035: $7.60 Billion
Omega-3 and
Proteins and bioactive peptides 2025: $2.70 Billion | 2035: $5.50 Billion
Proteins and
Probiotics $5.90 Billion $13.60 Billion 8.6%
Prebiotics $3.90 Billion $8.20 Billion 7.7%
Plant extracts and botanicals $8.10 Billion $15.30 Billion 6.5%
Omega-3 and functional lipids $4.20 Billion $7.60 Billion 6.1%
Proteins and bioactive peptides $2.70 Billion $5.50 Billion 7.6%

Which Type Segment Leads the Bioactive Ingredients Market?

Plant extracts and botanicals lead with about 32.5% of 2026 revenue, supported by broad use in supplements, beverages and personal care and by established standardised extracts. Probiotics grow fastest at 8.6% CAGR from 2026 to 2035 because strain-specific evidence and postbiotic launches widen pharmaceutical and infant nutrition use. During our market evaluation, we noticed that prebiotics gain share where human milk oligosaccharides reach infant formula, while omega-3 lipids grow steadily on algal supply.

2025 (USD Billion)
2035 (USD Billion)
Category A
Category B
Category C
Category D
Segment Item 2025 (USD Billion) 2035 (USD Billion) CAGR
Category A $10.0 USD Billion $40.0 USD Billion 21.0%
Category B $17.1 USD Billion $51.1 USD Billion 23.0%
Category C $24.2 USD Billion $62.2 USD Billion 21.0%
Category D $31.3 USD Billion $73.3 USD Billion 15.0%

Segment-wise data is locked

Unlock complete segment-wise numbers for By Source.

Unlock Full Data
2025 (USD Billion)
2035 (USD Billion)
Category A
Category B
Category C
Category D
Segment Item 2025 (USD Billion) 2035 (USD Billion) CAGR
Category A $10.0 USD Billion $40.0 USD Billion 18.0%
Category B $17.1 USD Billion $51.1 USD Billion 16.0%
Category C $24.2 USD Billion $62.2 USD Billion 22.0%
Category D $31.3 USD Billion $73.3 USD Billion 12.0%

Segment-wise data is locked

Unlock complete segment-wise numbers for By Application.

Unlock Full Data

Growth Opportunities

Our analysis shows that three whitespace opportunities are positioned to deliver disproportionate returns.

Can Targeted Probiotics and Postbiotics Unlock Pharmaceutical-grade Demand?

Pharmaceutical and medical nutrition buyers pay for strain level evidence, controlled manufacturing and stable dosing. Suppliers that convert supplement strains into trial backed adjunct products can lift price per kilogram and secure multiyear supply contracts. Contract fermentation specialists and strain owners benefit most, and the bioactive ingredients market gains a higher margin channel that dilutes supplement seasonality.

Does Personalised Nutrition Open a Premium Channel for Standardised Botanicals?

Brands building personalized nutrition programmes need standardised, dose-consistent extracts that can be recombined by genotype, microbiome or biomarker profile. Botanical suppliers with certificates of analysis and clinical dosing ranges become preferred partners. Digital health platforms and contract formulators benefit first, because they can bundle subscriptions with traceable ingredients across supplement and food channels.

Will Algal and Fermentation Derived Lipids Replace Constrained Marine Supply?

Algal lipids avoid fish stock variability and meet vegetarian positioning in infant and adult nutrition, which broadens addressable demand. dsm-firmenich reported strong growth in algal lipid solutions during 2025, which confirms demand beyond fish oil. Algae oil producers that scale fermentation capacity can serve brand owners seeking sustainable, concentrated omega-3 supply for premium products.

Regional Outlook

2025 (USD Billion)
2035 (USD Billion)
North Americ
Europe
Asia-Pacific
Middle East
Latin Americ
Region 2025 (USD Billion) 2035 (USD Billion) CAGR (%)
North America $10.0 USD Billion $40.0 USD Billion 9.0%
Europe $17.1 USD Billion $51.1 USD Billion 27.0%
Asia-Pacific $24.2 USD Billion $62.2 USD Billion 25.0%
Middle East & Africa $31.3 USD Billion $73.3 USD Billion 23.0%
Latin America $38.4 USD Billion $84.4 USD Billion 12.0%

Regional data is locked

Unlock complete regional numbers for this market.

Unlock Full Data

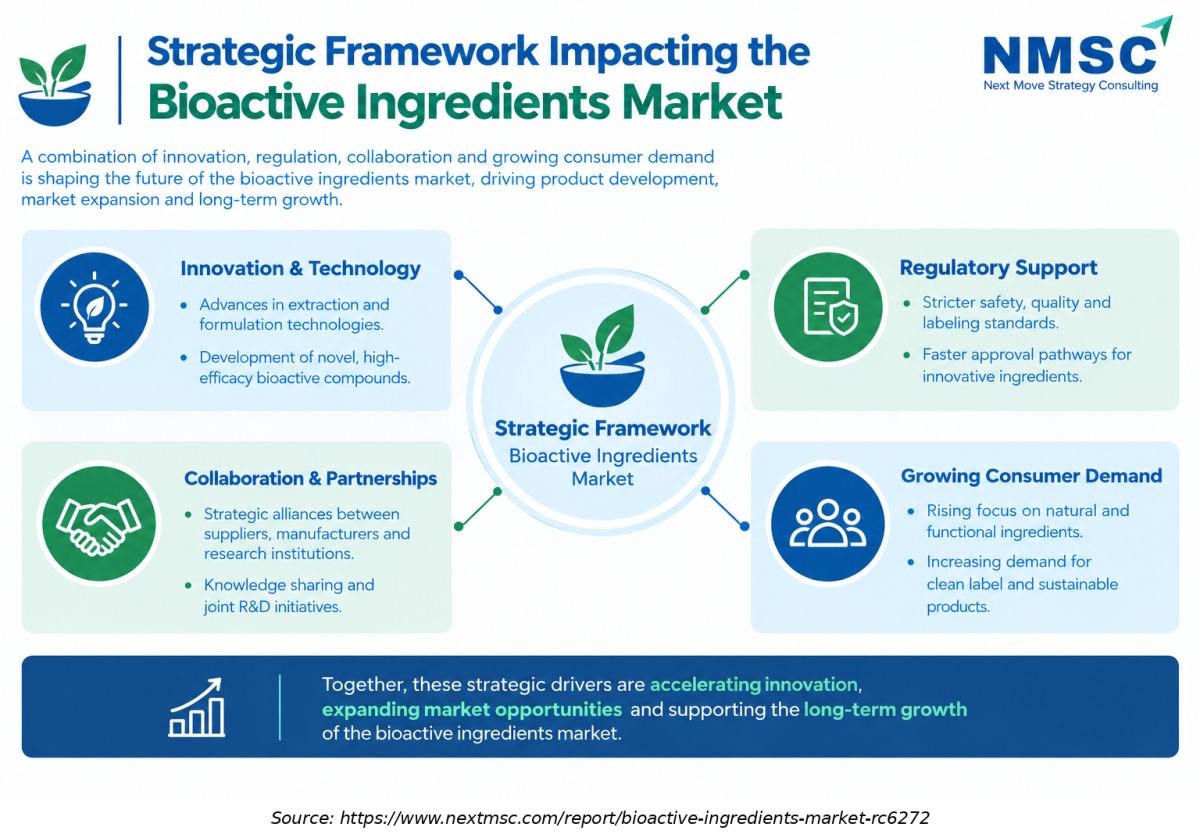
Strategic Framework Impacting the Bioactive Ingredients Market

Strategic Framework Impacting the Bioactive Ingredients Market
The infographic highlights the Strategic Framework Impacting the Bioactive Ingredients Market, focusing on innovation and technology, regulatory support, collaboration and partnerships, and growing consumer demand. It illustrates how advanced extraction technologies, product development, quality standards, strategic alliances, and increasing demand for natural and functional ingredients support market expansion and long-term growth.

Competitive Landscape

Our findings suggest that competition in the global bioactive ingredients industry rewards owned clinical evidence over scale alone.

How Do Companies Compete in the Bioactive Ingredients Industry?

Suppliers compete on clinical evidence, strain or extract identity, supply security and regulatory support rather than price alone. Large groups bundle ingredients with application expertise for food and beverage customers, while specialists sell branded actives into supplements. Pricing is firmest where trials and patents exist and weakest in commoditised lipid and collagen grades, which pushes producers toward differentiated, higher value lines.

Which Competitor Archetypes Dominate the Market?

Three archetypes dominate. Integrated nutrition groups such as dsm-firmenich, BASF and Kerry combine breadth with customer reach, biosolutions leaders such as Novonesis compete through fermentation and strain science, and agricultural processors such as ADM and Darling Ingredients leverage raw material access. Balchem competes through specialised nutrient and ingredient systems. Differentiation themes are clinical proof, sustainable sourcing and formulation support.

How Are Companies Differentiating Through Innovation?

Innovation spending targets postbiotics, human milk oligosaccharides, algal lipids and peptides with specific metabolic claims. Kerry invested heavily in research, and Darling Ingredients secured a U.S. patent for a glucose-focused collagen peptide. Geographic expansion follows manufacturing investments in Asia-Pacific, and pricing strategies reward branded science with premiums while commoditised grades face contract pricing pressure.

How Active Is M&A in the Bioactive Ingredients Industry?

Transactions reshape portfolios. dsm-firmenich agreed to divest Animal Nutrition & Health, Lonza classified its Capsules & Health Ingredients unit as discontinued operations, and SuanNutra agreed to acquire IFF natural ingredient businesses. Lallemand added BIO-CAT in 2026, and Vivify bought AuNutra. We found that buyers prioritise owned science, extraction capacity and customer relationships over standalone volume.

Key Market Players

Based on research conducted by NMSC, we found that eight companies with verifiable official disclosures lead supply in the market, ranked qualitatively below.

dsm-firmenich AG BASF SE Kerry Group plc Novonesis Group International Flavors & Fragrances Inc. Archer-Daniels-Midland Company Darling Ingredients Inc. Balchem Corporation

Latest Developments

We observed that 2025 and 2026 announcements concentrate on portfolio reshaping, fermentation science and botanical consolidation.

Date Event
July 2025 Darling Ingredients announced Nextida, a collagen and gelatin joint venture aimed at health and wellness markets.
January 2026 Lonza reported its Capsules & Health Ingredients business as discontinued operations during divestment.
July 2026 SuanNutra signed an agreement to acquire a portfolio of IFF specialty natural ingredients businesses, closing expected by end of 2026.
October 2026 Vivify Specialty Ingredients, backed by Gryphon Investors, acquired botanical extract supplier AuNutra Industries.

Expert Insights

Mayuresh Bedekar

Mayuresh Bedekar

Director of Product Strategy, Bioactives | Glanbia Nutritionals

"One is the efficacy at a particular dose, and the second thing is the safety at that particular dose in the target consumer base."

Analyst Interpretation

The statement highlights efficacy and safety assessment as essential considerations in bioactive ingredient development. Manufacturers must evaluate whether a specific ingredient delivers its intended function at an appropriate dose and is suitable for the target population. This supports demand for scientific validation, dose optimization, safety assessment, and evidence-based ingredient development across functional foods and dietary supplements.

Investment Opportunities

Where Are Capital Inflows Concentrating?

Capital is flowing to strain science, fermentation capacity and branded botanical platforms. Private equity buyers are assembling ingredient groups, and strategic buyers are pruning non-core assets to fund nutrition and health. Investors should favour suppliers with owned trials and recurring contracts, because those assets protect margins as the bioactive ingredients market expands toward the 2035 forecast.

Which Infrastructure Investments Offer the Strongest Returns?

Fermentation, spray drying, extraction and peptide hydrolysis capacity determine cost and quality for most bioactives. Balchem noted new capacity additions across human nutrition during 2025, and BASF is concentrating omega-3 production on high concentration oils. Facilities near Asia-Pacific demand centres and qualified for pharmaceutical standards earn longer contracts and higher utilisation.

How Do ESG Considerations Shape Investment Decisions?

Sustainable sourcing, traceability and lower carbon production increasingly decide supplier selection. Algal lipids and fermentation derived actives reduce pressure on fish stocks and agricultural land, and co product valorisation improves resource use at collagen processors. Investors that screen for supplier audits, organic and fair sourcing certificates and verified emission targets reduce regulatory and reputational risk across portfolios.

Key Benefits for Stakeholders

How Does the Report Support Enterprise and Industry Leaders?

Executives gain a reconciled view of size, share and growth across type, source, application and region, with country detail for 15 markets. The segmentation shows where margins sit, and the competitive analysis shows how peers invest. Leaders can align portfolio, capacity and clinical programmes to the fastest growing sub segments through 2035.

How Does the Report Support Investors and Financial Analysts?

Investors receive a transparent forecast with a base year, a CAGR defined from 2026 and an absolute opportunity of USD 23.60 Billion. The matrix of drivers and restraints quantifies risk, and the development log tracks transactions that reset valuations. Analysts can test scenarios using the stated assumptions and verified company disclosures.

How Does the Report Support Technology Vendors and Product Teams?

Product teams can identify strains, extracts, lipids and peptides with the strongest evidence momentum and the most attractive applications. Technology vendors serving fermentation, extraction and delivery systems can size equipment demand by region. The report links formulation trends to claim regulation, which shortens development planning and reduces launch risk. Teams also gain a clear view of regional regulatory differences.

Key Market Segments Evaluated

By Type

  • Probiotics
  • Prebiotics
  • Plant extracts and botanicals
  • Omega-3 and functional lipids
  • Proteins and bioactive peptides

By Source

  • Plant sourced
  • Microbial
  • Animal sourced
  • Marine sourced

By Application

  • Dietary supplements and nutraceuticals
  • Food and beverages
  • Pharmaceuticals
  • Personal care and cosmetics
  • Animal nutrition

By Region

  • North America 
    • U.S., Canada, Mexico
  • Europe 
    • UK, Germany, France, Italy, Spain, Sweden, Denmark, Finland, Netherlands, Rest of Europe
  • Asia-Pacific 
    • China, India, Japan, South Korea, Taiwan, Indonesia, Vietnam, Australia, Philippines, Malaysia, Rest of APAC
  • Middle East & Africa 
    • Saudi Arabia, UAE, Egypt, Israel, Turkey, Nigeria, South Africa, Rest of MEA
  • Latin America 
    • Brazil, Argentina, Chile, Colombia, Rest of LATAM

Conclusion & Recommendations

The outlook is constructive. Revenue is expected to double from USD 26.60 Billion in 2026 to USD 50.20 Billion in 2035 as ageing demand, clinical evidence and fermentation scale reinforce each other. Growth moderates in mature regions and accelerates in Asia-Pacific. Our assessment indicates that evidence owning suppliers will outgrow the average while commodity forms converge toward single digit price pressure.

What Strategic Positioning Recommendations Does NMSC Offer?

Suppliers should anchor portfolios in strains, extracts and peptides with owned clinical files, and invest in pharmaceutical-grade quality systems. Brand owners should secure multiyear supply for fast growing sub segments such as probiotics and postbiotics. Regional players should localise dossiers in Asia-Pacific, were regulatory diversity rewards early registration and local partnerships.

What Does Investment Attractiveness Look Like for the Bioactive Ingredients Market?

Attractiveness is highest in microbial platforms, algal lipids and branded botanical groups, where margins, recurring contracts and intellectual property align. Commodity lipids and generic collagen grades are less attractive because volumes soften and prices compress. Diligence should test clinical file ownership, capacity utilisation and customer concentration before committing capital. Selectivity matters more than breadth in this market.

What Are the Market Shifts and Key Risks to Watch?

Key shifts include consolidation among botanical suppliers; portfolio exits by large groups and wider use of fermentation. Key risks include claim authorisation delays, raw material volatility, adulteration scandals and price pressure in commodity grades. Companies should hedge sourcing, document traceability and maintain a pipeline of trials that supports future claims.

What Are the Primary Growth Pathways Through 2035?

Growth pathways include pharmaceutical adoption, early life and healthy ageing nutrition, personalised programmes and emerging market expansion. Probiotics, prebiotics and peptides offer the fastest paths, while algal lipids unlock sustainable omega-3 supply. Asia-Pacific supplies the largest absolute increase, and India offers the highest country growth rate in this report.

Delivered Customizations

We have successfully delivered the following deep-dive customizations:

Client Request Customization Delivered Value Adds
Country-Level Trade Flow Assessment
  • Country-wise import and export analysis of bioactive ingredients by HS-coded type, 2020-2025, with trade flow mapping.
  • Identifies key sourcing hubs and import-dependent markets to guide entry and sourcing decisions.
Historical Market Growth Analysis
  • Historical revenue and volume analysis of bioactive ingredients by type, source, and application, forming the base for the 2026-2035 forecast.
  • Establishes a credible growth baseline and highlights the fastest-growing ingredient categories.
Company-Level Ingredient Portfolio Share
  • Company-level revenue share by bioactive ingredient type and source for leading ingredient suppliers.
  • Reveals competitive concentration and portfolio white spaces for partnership or M&A targeting.
Application-Level Demand Mapping by Source
  • Mapping of plant, microbial, marine, and animal-derived bioactives to food, supplement, pharma, cosmetic, and feed applications with demand volumes.
  • Prioritizes source-application pairings with the highest growth and pricing headroom.
Regulatory Permissibility Assessment
  • Country-wise review of approval status and listing pathways such as novel food, GRAS, dietary supplement, and cosmetic ingredient rules for key bioactive types.
  • Flags market-entry barriers and sets realistic launch timing by application and region.
Feedstock and Production Capacity Assessment
  • Mapping of production capacity and raw-material sourcing for extraction, fermentation, and synthesis routes by source type, based on company disclosures and government data.
  • Shows supply constraints and sourcing risks to inform capacity investment and supplier decisions.

FAQs

Sources & References

1.

Novonesis, Full Year 2025 Highlights

backend.novonesis.com
2.

Novonesis, Q1 2025 Roadshow Presentation

backend.novonesis.com
3.

dsm-firmenich, Full Year 2025 Press Release

dsm-firmenich.com
4.

dsm-firmenich, Full Year 2025 Investor Presentation

dsm-firmenich.com
5.

dsm-firmenich, Q1 2025 Press Release

dsm-firmenich.com
6.

BASF, Report 2025, Nutrition & Care Segment

report.basf.com
7.

Kerry Group, Preliminary Results 2025

kerry.com
8.

IFF, Fourth Quarter and Full Year 2025 Results

ir.iff.com/node/39811
9.

ADM, Fourth Quarter and Full Year 2025 Results

businesswire.com
10.

ADM, Deerland Probiotics & Enzymes Acquisition Release

businesswire.com
11.

Darling Ingredients, Form 10-K for Fiscal Year 2025

sec.gov
12.

Darling Ingredients, Second Quarter 2025 Press Release

sec.gov
13.

Balchem, Q4 and Full Year 2025 Earnings Release

balchem.com
14.

Lonza, Full Year 2025 Announcement

lonza.com
15.

CDC National Center for Health Statistics, Data Brief No. 561, Dietary Supplement Use 2021–2023

cdc.gov
16.

World Health Organization, Ageing and Health Fact Sheet

who.int
17.

European Commission, EU Register on Nutrition and Health Claims

ec.europa.eu
18.

Food Safety Authority of Ireland, Nutrition and Health Claims

fsai.ie

About the Author

Mayurima Roy

Mayurima Roy

Mayurima Roy is Research Analyst at Next Move Strategy Consulting, where she has spent 4 years working across the firm's full industry coverage rather than a single fixed vertical. Her work centers on structured research, ongoing trend tracking, competitive assessment, and insight-led content development, translating complex market data into clear, decision-ready narratives that support informed client decision-making across diverse global industries, market sectors, and world regions every day.

About the Reviewer

Supradip Baul

Supradip Baul

Supradip Baul is an accomplished business consultant and strategist with over a decade of rich experience in market intelligence, strategy, technology, and business transformation. His work has included rigorous qualitative and quantitative analysis across multiple industries, helping clients shape investment decisions and long-term roadmaps. Earlier in his career, he was associated with Gartner, where he contributed to industry-leading reports and market share analyses. He has worked with leading global companies and holds an MBA with a dual specialization in Marketing and Finance.

Download Free Sample

Rishabh Jogani

RISHABH JOGANI

Strategy Analyst

Accenture Japan

We are incredibly impressed with the market report on the real estate market in India provided by Next Move Strategy Consulting. The report was thorough, insightful, and well-structured, offering deep analysis and actionable recommendations. It not only captured the current trends and dynamics but also provided a forward-looking perspective that has been invaluable for our strategic planning. Their team demonstrated exceptional professionalism, attention to detail, and a profound understanding of the industry. The data-driven insights and clarity of presentation exceeded our expectations, making complex market trends easy to understand. We highly recommend Next Move Strategy Consulting to anyone looking for reliable and comprehensive market research services. Their expertise has given us the confidence to navigate the complexities of the Indian real estate market with clarity and foresight.

Gustaf Hummel Burstrom

GUSTAF HUMMEL BURSTROM

Founder

Revline Tools AB

Joseph and the team at Next Move Strategy Consulting have been excellent to work with, in supplying us with relevant market data and forecasts for our specific category. We had some special requirements and they were able to do a custom package to suit our needs. We would definitely recommend them to any other company needing market data and forecasts

Pratyush Kumar Das

PRATYUSH KUMAR DAS

Assistant Manager

Polycab India Limited

We would like to express our appreciation for the data and insights provided by nextmsc. We are very pleased with the quality and depth of the information, which has proven to be highly valuable and beneficial for our business decision-making.

Ross J Mckenzie

ROSS J MCKENZIE

Business Insight Manager

Staysure Group

“Next MSC have been incredibly helpful in providing detailed & robust information on our market, alongside quantifying growth by different segments. The process to procure was simple and easy, with sample reports and regular contact to ensure we had what we needed. Succinct detail on their sources & methodologies is also greatly received, allowing transparency in this respect helps build trust in the detail you pay for. Joseph in particular was fantastic, and helped ensure efficient provision of the insight pack – thank you NMSC!”.

Henri Knyphausen

HENRI KNYPHAUSEN

Partner at Singulier [Ex-BCG]

Singulier

I recently engaged NEXTMSC.com for a commercial due diligence project within the intralogistics sector, and I am pleased to provide a reference based on my experience. In utilizing NEXTMSC.com's services, I found their report to offer valuable insights into market dynamics and key industry players. The initial report provided a solid foundation for our analysis. However, as we were investigating a smaller target in the market, and I had specific customization requests requiring additional research. These requests included detailed information on product portfolios of various players and sub-market sizes, both inclusive and exclusive of certain product categories. NEXTMSC.com demonstrated commendable responsiveness and agility in accommodating these customization requests. Within a timeframe of 1-2 weeks, they delivered a revised report that met our specific needs. Furthermore, they were receptive to my follow-up inquiries, ensuring clarity and understanding of the data provided. The final deliverable significantly contributed to our due diligence efforts. One of NEXTMSC.com's notable strengths lies in their qualitative research capabilities. However, for future engagements, I would recommend the inclusion of a quantified market model in Excel format. Such a model would offer the ability to conduct in-depth analyses and explore various market segments, including country-specific data and subcomponent breakdowns. Based on my positive experience, I would not hesitate to work with NEXTMSC.com again. Their responsiveness, willingness to accommodate customization requests, and commitment to delivering actionable insights make them a reliable partner for commercial research projects.

Custom Market Research Services

We will customize the research for you if the listed report does not fully match your requirements.

Get 30% Free Customization

Select License

This website uses cookies to ensure you get the best experience on our website. Learn more

✖