Blockchain Technology Market Global Industry Analysis and Forecast (2026–2035)

Blockchain Technology Market size was USD 41.96 Billion in 2025, projected to reach USD 4,377.18 Billion by 2035, growing at a CAGR of 27.97% from 2026 to 2035. Key drivers include stablecoin regulation, tokenization of financial assets and settlement modernization, with North America leading the market.

Download Free Sample PDF
Base Year (2025)
$41.96 Billion
Forecast (2035)
$4,377.18 Billion
CAGR (2026-2035)
28.0%
Top Region
North America

What Is the Blockchain Technology Market Size?
The global Blockchain Technology Market was valued at USD 41.96 Billion in 2025 and is estimated at USD 475.48 Billion in 2026, rising to USD 4,377.18 Billion by 2035 at a CAGR of 27.97% from 2026 to 2035. North America led with approximately 36% share in 2025, and Blockchain Applications led offerings with approximately 32% share.

Our analysis shows that growth concentrates in regulated settlement, tokenization and compliance workloads across every segmentation axis tracked here.

Blockchain Technology Market Global Industry Analysis and Forecast (2026–2035) Revenue Forecast

Values in USD Billion

2025 $41.96 Billion
2025
2026 $475.48 Billion
2026
2027 $608.47 Billion
2027
2028 $778.66 Billion
2028
2029 $996.45 Billion
2029
2030 $1,275.16 Billion
2030
2031 $1,631.82 Billion
2031
2032 $2,088.24 Billion
2032
2033 $2,672.33 Billion
2033
2034 $3,419.78 Billion
2034
2035 $4,377.18 Billion
2035

Key Takeaways

By Offering: Blockchain Applications held the largest share and is also the fastest growing at 32.13% CAGR from 2026–2035, expanding from USD 13.33 Billion in 2025 to USD 1,925.96 Billion by 2035.

By Network Governance: Network-Independent Technology held the largest share, expanding from USD 17.90 Billion in 2025 to USD 1,575.78 Billion by 2035; Public Permissionless Networks is the fastest growing at 30.52% CAGR from 2026–2035.

By Network Scope: Network-Independent Technology held the largest share, expanding from USD 17.90 Billion in 2025 to USD 1,575.78 Billion by 2035; Multi-Network Systems is the fastest growing at 35.98% CAGR from 2026–2035.

By Deployment Architecture: Provider Cloud held the largest share, expanding from USD 15.57 Billion in 2025 to USD 2,013.50 Billion by 2035; Hybrid Environment is the fastest growing at 32.85% CAGR from 2026–2035.

By Management Model: Provider Managed held the largest share, expanding from USD 16.55 Billion in 2025 to USD 1,969.73 Billion by 2035; Shared Managed is the fastest growing at 31.41% CAGR from 2026–2035.

By Use Case: Tokenisation and Digital Assets held the largest share, expanding from USD 8.07 Billion in 2025 to USD 1,181.83 Billion by 2035; Capital Markets is the fastest growing at 35.45% CAGR from 2026–2035.

By End User Industry: Banking, Financial Services and Insurance held the largest share, expanding from USD 14.81 Billion in 2025 to USD 1,838.41 Billion by 2035; Government and Public Sector is the fastest growing at 33.87% CAGR from 2026–2035.

By Revenue Model: Recurring Subscription held the largest share, expanding from USD 12.72 Billion in 2025 to USD 1,181.84 Billion by 2035; Transaction-Based is the fastest growing at 34.31% CAGR from 2026–2035.

Dominant Region: North America held the largest share in 2025 at USD 15.25 Billion, rising to USD 1,444.47 Billion by 2035.

Fastest-Growing Region: Asia-Pacific is the fastest growing at 30.18% CAGR from 2026–2035 and overtakes North America by 2035.

Dominant Country: The U.S. led in 2025 at USD 12.23 Billion, projected to reach USD 1,126.69 Billion by 2035.

Fastest-Growing Country: India is the fastest growing at 35.32% CAGR from 2026–2035.

The Blockchain Technology Market presents an absolute investment opportunity of approximately USD 3,901.70 Billion between 2026 and 2035.

According to NMSC analysis, regulated production settlement rather than experimental pilots now anchors institutional budgets through 2035.

Ecosystem Analysis of the Blockchain Technology Industry

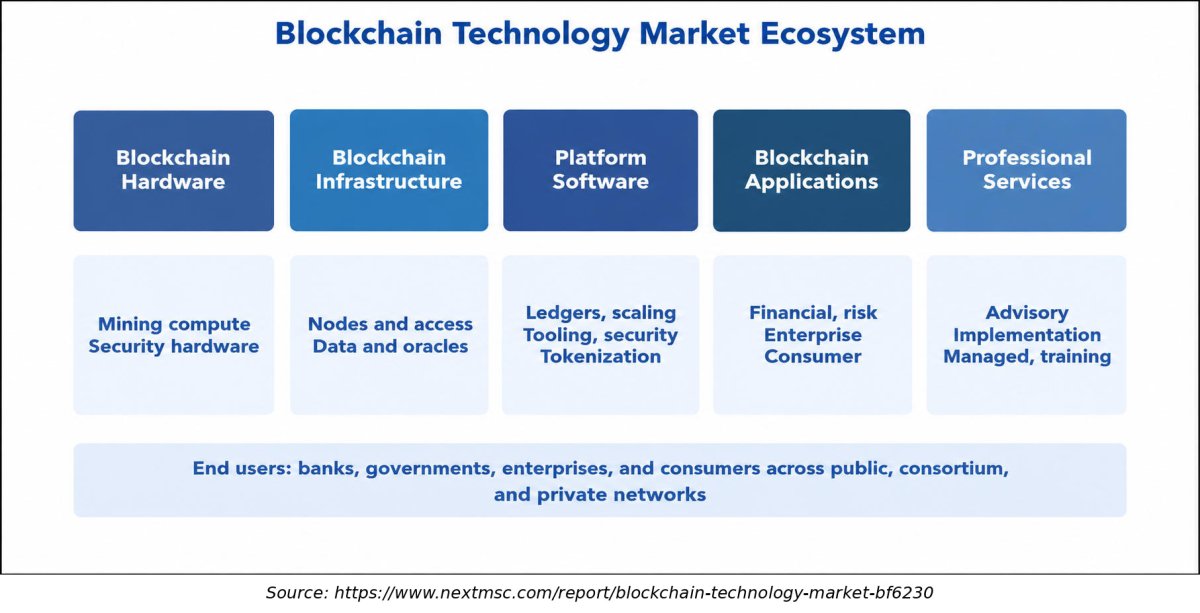
The above infographic presents the Blockchain Technology Market ecosystem in a simpler format, focusing on five layers: hardware, infrastructure, platform software, applications and professional services. Hardware and infrastructure providers supply the physical and network foundations, platform vendors supply ledgers, scaling, tooling and security, and application and services providers convert those foundations into regulated financial, enterprise and consumer workflows delivered to end users.
What does the Blockchain Technology Market Encompass?
The Blockchain Technology Market covers hardware, infrastructure, platform software, applications and professional services that build, operate, secure and use distributed ledgers. Revenue reflects vendor sales, subscriptions, usage fees, transaction fees and project fees across public permissionless networks, private single organization networks, private consortium networks and network independent technology. It excludes token prices, trading volumes, mining rewards and staking yields, which measure digital asset value rather than technology spending.
Regulation shapes structural evolution more than any other factor. The United States set a federal payment stablecoin framework through the GENIUS Act, the European Union ended MiCA transitional periods on 1 July 2026, and the European Central Bank scheduled Pontes to link distributed ledger platforms with central bank money. Technology adoption is moving from pilots toward production, as DTCC processed tokenization trades in a live environment in July 2026 ahead of its October 2026 service launch.

Market Drivers & Dynamics

Interactive Dataset
Regulatory clarity for stablecoins and digital asset service providers driver +4.6% North America, Europe 2026–2030
Institutional tokenization of collateral, funds and securities driver +5.2% Global 2026–2035
Central bank money access for distributed ledger settlement driver +2.1% Europe, Asia-Pacific 2026–2031
Enterprise demand for managed node, custody and key management services driver +1.9% Global 2026–2033
Fragmented standards and limited interoperability across networks restraint −2.4% Global 2026–2032
Illicit finance concerns and uneven supervision of virtual asset providers restraint −1.8% Global 2026–2035
Smart contract and key management security incidents restraint −1.3% Global 2026–2034
Legacy system integration cost and skills shortages restraint −1.1% Global 2026–2030
Source: Next Move Strategy Consulting

Growth Drivers

What Is the Primary Growth Driver in the Blockchain Technology Market?

Regulatory clarity is the primary driver of the Blockchain Technology Market. The GENIUS Act, signed in July 2025, bars issuing payment stablecoins in the United States without a federal or state license once it takes effect on 18 January 2027. In Europe, the MiCA transitional period ended on 1 July 2026, so only authorized providers can serve clients. Clear licensing converts pilots into budgeted programs, and we estimate it adds approximately 4.6% to the CAGR.

How Is Institutional Tokenization Driving the Market Growth?

Institutional tokenization drives demand for issuance, custody, oracle and settlement software. DTCC reported that its industry working group has grown to more than 100 members and partners, and its tokenization service is scheduled to launch in October 2026. Tokenisation and Digital Assets is the largest use case at USD 8.07 Billion in 2025 and expands to USD 1,181.83 Billion by 2035. Based on NMSC econometric modeling, tokenized collateral infrastructure is projected to contribute an estimated 5.2% to the overall market CAGR through 2035.

Growth Inhibitors

What Is Restraining the Blockchain Technology Market?

Fragmented standards and illicit finance risk restrain adoption. FATF's 2026 targeted update reports that most identified on chain illicit activity now involves stablecoins, and it flags offshore providers, decentralized finance and unhosted wallets as priority risk areas. It also found that 83% of surveyed jurisdictions have legislated the Travel Rule, up from 73% in 2025. Banks therefore demand stronger monitoring before scaling, and we estimate that interoperability gaps, supervisory gaps and smart contract security incidents together reduce the CAGR by approximately 5.5%.

Segmentation Analysis

2025 (USD Billion)
2035 (USD Billion)
Blockchain Hardware 2025: $3.59 Billion | 2035: $131.32 Billion
Blockchain H
Blockchain Infrastructure 2025: $6.38 Billion | 2035: $569.04 Billion
Blockchain I
Blockchain Platform Software 2025: $13.02 Billion | 2035: $1,356.92 Billion
Blockchain P
Blockchain Applications 2025: $13.33 Billion | 2035: $1,925.96 Billion
Blockchain A
Blockchain Professional Services 2025: $5.64 Billion | 2035: $393.94 Billion
Blockchain P
Blockchain Hardware $3.59 Billion $131.32 Billion 14.76%
Blockchain Infrastructure $6.38 Billion $569.04 Billion 25.95%
Blockchain Platform Software $13.02 Billion $1,356.92 Billion 27.97%
Blockchain Applications $13.33 Billion $1,925.96 Billion 32.13%
Blockchain Professional Services $5.64 Billion $393.94 Billion 22.85%

Segment Sizing: By Offering

2025 (USD Billion)
2035 (USD Billion)
Category A
Category B
Category C
Category D
Segment Item 2025 (USD Billion) 2035 (USD Billion) CAGR
Category A $10.0 USD Billion $40.0 USD Billion 25.0%
Category B $17.1 USD Billion $51.1 USD Billion 11.0%
Category C $24.2 USD Billion $62.2 USD Billion 25.0%
Category D $31.3 USD Billion $73.3 USD Billion 11.0%

Segment-wise data is locked

Unlock complete segment-wise numbers for By Network Governance.

Unlock Full Data
2025 (USD Billion)
2035 (USD Billion)
Category A
Category B
Category C
Category D
Segment Item 2025 (USD Billion) 2035 (USD Billion) CAGR
Category A $10.0 USD Billion $40.0 USD Billion 27.0%
Category B $17.1 USD Billion $51.1 USD Billion 9.0%
Category C $24.2 USD Billion $62.2 USD Billion 19.0%
Category D $31.3 USD Billion $73.3 USD Billion 17.0%

Segment-wise data is locked

Unlock complete segment-wise numbers for By Network Scope.

Unlock Full Data
2025 (USD Billion)
2035 (USD Billion)
Category A
Category B
Category C
Category D
Segment Item 2025 (USD Billion) 2035 (USD Billion) CAGR
Category A $10.0 USD Billion $40.0 USD Billion 14.0%
Category B $17.1 USD Billion $51.1 USD Billion 24.0%
Category C $24.2 USD Billion $62.2 USD Billion 22.0%
Category D $31.3 USD Billion $73.3 USD Billion 12.0%

Segment-wise data is locked

Unlock complete segment-wise numbers for By Deployment Architecture.

Unlock Full Data
2025 (USD Billion)
2035 (USD Billion)
Category A
Category B
Category C
Category D
Segment Item 2025 (USD Billion) 2035 (USD Billion) CAGR
Category A $10.0 USD Billion $40.0 USD Billion 24.0%
Category B $17.1 USD Billion $51.1 USD Billion 22.0%
Category C $24.2 USD Billion $62.2 USD Billion 20.0%
Category D $31.3 USD Billion $73.3 USD Billion 22.0%

Segment-wise data is locked

Unlock complete segment-wise numbers for By Management Model.

Unlock Full Data
2025 (USD Billion)
2035 (USD Billion)
Category A
Category B
Category C
Category D
Segment Item 2025 (USD Billion) 2035 (USD Billion) CAGR
Category A $10.0 USD Billion $40.0 USD Billion 23.0%
Category B $17.1 USD Billion $51.1 USD Billion 9.0%
Category C $24.2 USD Billion $62.2 USD Billion 19.0%
Category D $31.3 USD Billion $73.3 USD Billion 13.0%

Segment-wise data is locked

Unlock complete segment-wise numbers for By Use Case.

Unlock Full Data
2025 (USD Billion)
2035 (USD Billion)
Category A
Category B
Category C
Category D
Segment Item 2025 (USD Billion) 2035 (USD Billion) CAGR
Category A $10.0 USD Billion $40.0 USD Billion 21.0%
Category B $17.1 USD Billion $51.1 USD Billion 23.0%
Category C $24.2 USD Billion $62.2 USD Billion 25.0%
Category D $31.3 USD Billion $73.3 USD Billion 15.0%

Segment-wise data is locked

Unlock complete segment-wise numbers for By End-User Industry.

Unlock Full Data
2025 (USD Billion)
2035 (USD Billion)
Category A
Category B
Category C
Category D
Segment Item 2025 (USD Billion) 2035 (USD Billion) CAGR
Category A $10.0 USD Billion $40.0 USD Billion 9.0%
Category B $17.1 USD Billion $51.1 USD Billion 23.0%
Category C $24.2 USD Billion $62.2 USD Billion 9.0%
Category D $31.3 USD Billion $73.3 USD Billion 23.0%

Segment-wise data is locked

Unlock complete segment-wise numbers for By Revenue Model.

Unlock Full Data

Supply Chain Analysis of the Blockchain Technology Industry

Supply Chain Analysis of the Blockchain Technology Industry
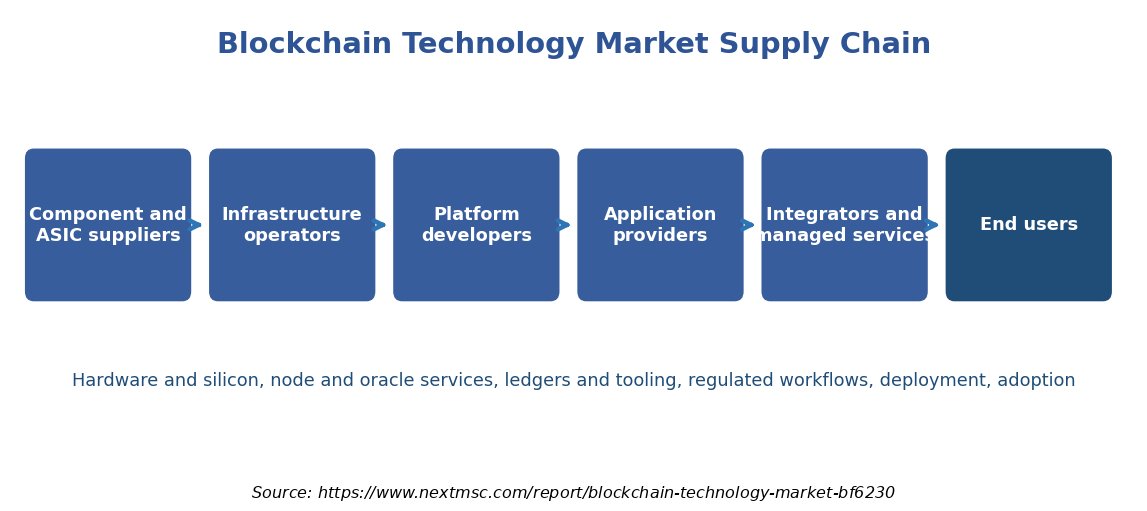
The above infographic maps the Blockchain Technology Market supply chain across component and hardware suppliers, infrastructure operators, platform developers, application providers and service integrators, ending with enterprise, institutional and consumer users. Semiconductor and ASIC designers feed mining and security hardware, node and oracle operators supply access and data, platform vendors provide ledgers and tooling, and integrators deploy solutions inside regulated workflows.

Growth Opportunities

Our analysis shows that three whitespace opportunities should generate disproportionate revenue between 2026 and 2035.

Can Tokenized Capital Markets Infrastructure Become the Largest Revenue Pool?

Capital Markets is the fastest growing use case at 35.45% CAGR from 2026 to 2035. Clearing houses, custodians and asset managers need issuance platforms, token lifecycle tools, oracle data and institutional custody to run collateral, repo and fund workflows on ledgers. Vendors that integrate with existing post trade systems and central bank money access gain a durable position, and Tokenization Platforms are the main beneficiary segment.

Does Regulated Stablecoin Payment Orchestration Create a New Bank Technology Layer?

Banks, payment service providers and fintechs need wallet infrastructure, key policy controls and compliance monitoring to accept and settle regulated stablecoins. Transaction Based revenue is the fastest growing revenue model at 34.31% CAGR from 2026 to 2035, which rewards platforms priced per settled payment. Providers that combine custody, screening and treasury integration serve issuers and distributors preparing for GENIUS Act and MiCA compliance.

Can Government and Public Sector Programs Open a Distinct Credentialing Market?

Government and Public Sector is the fastest growing end user industry at 33.87% CAGR from 2026 to 2035. Agencies pursue verifiable credentials, registries and wholesale settlement pilots, and decentralized identity standards give them portable proofs without central databases. Identity and Credentials grows at 32.13% CAGR, so identity wallet, key management and consortium network vendors benefit most.

Regional Outlook

2025 (USD Billion)
2035 (USD Billion)
North Americ
Europe
Asia-Pacific
Middle East
Latin Americ
Region 2025 (USD Billion) 2035 (USD Billion) CAGR (%)
North America $10.0 USD Billion $40.0 USD Billion 9.0%
Europe $17.1 USD Billion $51.1 USD Billion 27.0%
Asia-Pacific $24.2 USD Billion $62.2 USD Billion 25.0%
Middle East & Africa $31.3 USD Billion $73.3 USD Billion 23.0%
Latin America $38.4 USD Billion $84.4 USD Billion 12.0%

Regional data is locked

Unlock complete regional numbers for this market.

Unlock Full Data

Competitive Landscape

Our assessment indicates that five archetypes compete: hardware makers, hyperscale clouds, platform vendors, digital asset specialists and integrators.

Dimension Description
Market Structure Fragmented by layer; hardware is concentrated, while platform, infrastructure and services layers include many specialists and large integrators.
Innovation Focus Tokenization platforms, cross chain messaging, institutional custody, privacy preserving settlement and compliance analytics.
M&A Activity Infrastructure leaders are acquiring payment, treasury and wallet specialists to build full stack stablecoin and custody offerings.

How Do Companies Compete in the Blockchain Technology Market?

Companies compete on regulatory standing, security assurance, network coverage and integration depth. Hyperscale providers such as Amazon Web Services, Inc., Microsoft Corporation and Oracle Corporation compete on managed access, cloud computing scale and enterprise integration, while Chainlink Labs Inc., Fireblocks Inc., Chainalysis, Inc. and Blockdaemon Inc. compete on depth in oracles, custody, analytics and node services. Pricing is shifting toward usage and transaction models, and geographic expansion follows licensing approvals.

Which Competitive Archetypes Dominate the Blockchain Technology Market?

Five archetypes dominate. BITMAIN Technologies Holding Company and Canaan Inc. lead mining hardware, while International Business Machines Corporation, Alibaba Group Holding Limited and Huawei Technologies Co., Ltd. offer enterprise platforms. Accenture plc, Tata Consultancy Services Limited, Infosys Limited and Wipro Limited dominate integration. Consensys Software Inc., R3 LLC, Ripple Labs Inc. and Digital Asset Holdings, LLC differentiate through ledger design, privacy and institutional connectivity.

What Innovation and Differentiation Strategies Are Companies Pursuing?

We observed that leading vendors differentiate through assurance, privacy and compliance automation. Chainlink Labs secured an independent SOC 2 Type 2 examination for core products, Fireblocks launched stablecoin acceptance infrastructure, and Digital Asset builds Canton Network for privacy controlled institutional settlement. Chainalysis extends transaction analytics that support digital risk management for banks and regulators, which turns compliance into a product feature.

What M&A and Partnership Activity Is Shaping the Market?

Our findings suggest that consolidation is moving toward full stack offerings. Ripple Labs acquired Hidden Road, GTreasury and Rail to extend prime brokerage, treasury and stablecoin payment capabilities, and Fireblocks added Dynamic and Tres Finance in wallet and finance operations. DTCC became co chair of the Canton governance foundation alongside Euroclear, which signals partnership between market infrastructures and technology providers.

Key Market Players

Based on research conducted by NMSC, the following 20 companies represent the validated leadership set across the Blockchain Technology Market.

BITMAIN Technologies Holding Company International Business Machines Corporation Oracle Corporation Microsoft Corporation Amazon Web Services, Inc. Accenture plc Tata Consultancy Services Limited Alibaba Group Holding Limited Infosys Limited Wipro Limited Huawei Technologies Co., Ltd. Canaan Inc. Consensys Software Inc. Chainlink Labs Inc. R3 LLC Ripple Labs Inc. Fireblocks Inc. Chainalysis, Inc. Blockdaemon Inc. Digital Asset Holdings, LLC

Latest Developments

During our market evaluation, we noticed that 2025–2026 activity reflects regulatory implementation, production tokenization and stablecoin infrastructure launches.

Date Event
Sep 2026 The Eurosystem launched Pontes, a settlement solution connecting market ledger platforms with TARGET Services to enable the settlement of tokenized wholesale financial transactions in central bank money.
Aug 2026 The U.S. Department of the Treasury issued a proposed rule defining the issuance, offering, and sale of payment stablecoins under the GENIUS Act, establishing a 60-day public comment period ahead of full 2027 enforcement.
Jul 2026 The Financial Action Task Force (FATF) published its seventh targeted update on virtual assets and virtual asset service providers, reporting that stablecoins account for most identified on-chain illicit activity.
Jul 2026 DTCC processed live production trades using tokenized assets held by the Depository Trust Company, marking progress toward the planned October 2026 launch of its Tokenization Service.
Jun 2026 Fireblocks launched Fireblocks Flow, a stablecoin payment acceptance solution designed to help payment service providers and fintech companies accept stablecoin payments and streamline settlement.

Expert Insights

Markus Infanger

Senior Vice President | RippleX, Ripple

"“We’re at a tipping point where tokenization is evolving from experimentation to production in global financial markets. Institutions are no longer asking if blockchain technology can support regulated financial products, they’re asking how they can deploy them at scale.”"

Analyst Interpretation

Infanger's statement highlights the growing adoption of blockchain technology across institutional financial markets, particularly for tokenization of real-world assets such as bonds, commercial paper, and other regulated financial instruments. As financial institutions move beyond pilot projects toward large-scale implementation, demand is increasing for enterprise-grade blockchain platforms that support secure transactions, regulatory compliance, interoperability, and efficient settlement. This transition is creating opportunities for blockchain technology providers, smart contract developers, digital asset infrastructure companies, and financial institutions seeking to modernize traditional financial processes. The scalability of these solutions, together with regulatory clarity and integration with existing financial systems, will be critical to sustaining long-term market growth.

Investment Opportunities

Where Are Capital Inflows Concentrating in the Blockchain Technology Market?

Capital concentrates in tokenization platforms, institutional custody, oracle data and compliance analytics, where regulated demand is visible. DTCC targets an October 2026 service launch with an industry working group above 100 members and partners, and Chainlink Labs reported Canton Network adoption of its standards. Consumer demand for gaming assets and non fungibletoken collectables remains small, so investors favor institutional infrastructure over speculative applications.

How Is Infrastructure Investment Shaping Market Capacity?

Infrastructure investment is shifting toward validator and node capacity, oracle networks, connectivity to central bank money and secure key storage. The Eurosystem Pontes launch requires ledger operators to build interfaces to TARGET Services, and institutional signing appliances and hardware security modules protect keys for custodians and banks. These projects raise recurring demand for managed services and security platforms.

What ESG Considerations Are Influencing Market Investment?

Environmental scrutiny focuses on the energy intensity of proof of work mining, which favors efficient hardware and validator based networks. Social considerations include consumer protection and financial inclusion through lower cost payments. Governance considerations center on FATF Travel Rule compliance, independent control audits and transparent reserves. Investors increasingly screen vendors on these factors, which rewards providers with assured controls.

Key Benefits for Stakeholders

How Does This Report Benefit Enterprise and Industry Leaders?

Enterprise and industry leaders gain segment level forecasts across offerings, deployment architectures, management models and end user industries, which support build, buy or partner decisions across regulated and unregulated markets. Executives evaluating blockchain for business applications can compare network governance models and revenue models, and benchmark regional regulatory readiness and vendor landscapes before committing budgets or signing partnerships.

How Does This Report Benefit Investors and Financial Analysts?

Investors and financial analysts gain a reconciled sizing model that moves from USD 41.96 Billion in 2025 to USD 4,377.18 Billion by 2035. Segment CAGRs, regional shares and country projections reveal where growth outpaces the 27.97% market average, including Capital Markets and Asia-Pacific, and the growth catalyst matrix quantifies how regulation, tokenization and security risk change returns.

How Does This Report Benefit Technology Vendors and Product Teams?

Vendors and product teams gain visibility into which layers monetize fastest, how Multi-Network Systems and Shared Managed models are expanding, and which compliance features buyers require. The competitive analysis and development timeline help teams prioritize interoperability, custody assurance and licensing support when planning product roadmaps, regional launches and strategic partnerships over the next decade.

Key Market Segments Evaluated

By Offering

  • Blockchain Hardware 
    • Mining Compute Hardware
      • ASIC Mining Servers
      • Other Purpose-Built Mining Compute
    • Digital Asset Security Hardware
      • Consumer Hardware Wallets
      • Institutional Signing Appliances
  • Blockchain Infrastructure 
    • Node and Access Infrastructure
      • General Node Hosting
      • Validator Node Hosting
      • RPC and Gateway Services
    • Blockchain Data Infrastructure
      • Indexing and Query Services
      • Blockchain Data APIs
    • Oracle Infrastructure
      • Market and Reference Data
      • External Data and Computation
  • Blockchain Platform Software 
    • Ledger Platforms
      • Permissioned DLT Platforms
      • Public Blockchain Platforms
    • Scaling Platforms
      • Optimistic Rollup Platforms
      • Zero-Knowledge Rollup Platforms
    • Developer Tooling
      • SDKs and Development Environments
      • Smart Contract Lifecycle Tools
      • Smart Contract Security Tools
    • Validator and Staking Software
      • Validator Management Software
      • Staking Management APIs
    • Interoperability Middleware
      • Cross-Chain Messaging
      • Blockchain Integration Middleware
    • Digital Asset Security Platforms
      • Wallet Infrastructure
      • Key Management and Transaction Policy
      • Institutional Custody Infrastructure
    • Tokenization Platforms
      • Asset Issuance Platforms
      • Token Lifecycle Platforms
  • Blockchain Applications 
    • Financial Applications
      • Payments and Settlement
      • Capital Markets
    • Risk and Compliance Applications
      • Transaction Monitoring
      • Investigations and Forensics
    • Enterprise Applications
      • Supply Chain and Traceability
      • Identity and Credentials
      • Data Sharing and Records
      • Other Enterprise Workflows
    • Consumer Applications
      • Gaming and Digital Ownership
      • Loyalty and Digital Collectables
  • Blockchain Professional Services 
    • Advisory Services
      • Strategy and Feasibility
      • Architecture and Operating Model
    • Implementation Services
      • Application Development
      • Network Integration
      • Legacy System Integration
    • Managed Services
      • Network Operations
      • Application Support
      • Security and Compliance Support
    • Training and Enablement
      • Developer and Administrator Training
      • Certification and Enablement

By Network Governance

  • Public Permissionless Networks
  • Private Single-Organization Networks
  • Private Consortium Networks
  • Network-Independent Technology

By Network Scope

  • Single-Network Systems
  • Multi-Network Systems
  • Network-Independent Technology

By Deployment Architecture

  • Provider Cloud
  • Customer Cloud
  • On-Premises
  • Hybrid Environment
  • Physical Hardware
  • Not Applicable

By Management Model

  • Provider Managed
  • Customer Managed
  • Shared Managed
  • Not Applicable

By Use Case

  • Network Infrastructure
  • Developer Infrastructure
  • Validator and Staking Operations
  • Tokenisation and Digital Assets
  • Payments and Settlement
  • Capital Markets
  • Supply Chain and Traceability
  • Identity and Credentials
  • Compliance and Investigation
  • Data Sharing and Records
  • Consumer Blockchain Applications
  • Other Enterprise Workflows

By End-User Industry

  • Banking, Financial Services and Insurance
  • Government and Public Sector
  • Manufacturing
  • Transportation and Logistics
  • Retail and Consumer Goods
  • Healthcare and Life Sciences
  • Energy and Utilities
  • Technology, Media and Telecommunications
  • Professional and Business Services
  • Travel and Hospitality
  • Real Estate and Construction
  • Agriculture and Food
  • Consumer and Personal Use
  • Other Industries

By Revenue Model

  • Upfront Purchase
  • Recurring Subscription
  • Usage-Based
  • Transaction-Based
  • Project-Based

By Region

  • North America 
    • U.S.
    • Canada
    • Mexico
  • Europe 
    • UK
    • Germany
    • France
    • Italy
    • Spain
    • Sweden
    • Denmark
    • Finland
    • Netherlands
    • Rest of Europe
  • Asia-Pacific 
    • China
    • India
    • Japan
    • South Korea
    • Taiwan
    • Indonesia
    • Vietnam
    • Australia
    • Philippines
    • Malaysia
    • Rest of APAC
  • Middle East & Africa 
    • Saudi Arabia
    • UAE
    • Egypt
    • Israel
    • Turkey
    • Nigeria
    • South Africa
    • Rest of MEA
  • Latin America 
    • Brazil
    • Argentina
    • Chile
    • Colombia
    • Rest of LATAM

Conclusion & Recommendations

The long term outlook is strongly positive, with revenue multiplying roughly 9.2 times between 2026 and 2035 as regulated settlement, tokenization and compliance workloads reach production scale. Asia-Pacific overtakes North America by 2035, and Blockchain Applications becomes the largest offering at USD 1,925.96 Billion. The Blockchain Technology Market therefore shifts from infrastructure build out toward application led revenue.

What Strategic Positioning Recommendations Does NMSC Offer?

Vendors should prioritize regulatory licensing, independent security assurance and interoperability with existing post trade and payment systems. Platform and infrastructure providers should package custody, key policy and monitoring controls for banks, while hardware makers should emphasize institutional signing appliances over commodity mining capacity. Integrators should build repeatable tokenization and stablecoin delivery kits for regulated clients.

How Strong Is Investment Attractiveness in the Blockchain Technology Market?

Investment attractiveness is high, supported by an absolute growth opportunity of USD 3,901.70 Billion and recurring revenue from custody, node, oracle and managed services. Risk adjusted returns favor providers with regulated clients and assured controls, while Capital Markets and Government and Public Sector offer the steepest growth at 35.45% and 33.87% CAGR respectively.

What Are the Market Shifts and Key Risks in the Blockchain Technology Market?

Key shifts include the move from pilots to production, from public experimentation to licensed institutional use, and from single network systems to multi network operations. Key risks include fragmented standards, supervisory gaps highlighted by FATF, security incidents in smart contracts and key management, and delays in final stablecoin rules. Vendors that diversify across regions and layers manage these risks best.

What Are the Growth Pathways Through 2035?

Primary growth pathways include tokenized collateral and securities infrastructure, regulated stablecoin payment orchestration, government credential programs and managed services for banks entering production. Blockchain in healthcare records sharing and supply chain traceability add smaller but steady enterprise pathways, while Asia-Pacific and the Middle East & Africa provide the fastest regional expansion for new vendors.

Delivered Customizations

We have successfully delivered the following deep-dive customizations:

Client Request Customization Delivered Value Adds
Historical Blockchain Market Revenue Analysis
  • Historical blockchain revenue analysis by offering, use case, and end-user industry, with growth trends across major segments.
  • Identifies the fastest-growing offerings and use cases to prioritize product and investment focus.
Company-Level Blockchain Revenue Split
  • Company-level revenue benchmarking across blockchain-attributable offerings and business lines, where publicly disclosed.
  • Shows which vendors earn meaningful blockchain revenue and where competitive positions are strongest.
Segmented Blockchain Market Sizing (TAM/SAM/VAM)
  • Total, serviceable, and obtainable market sizing by offering, deployment architecture, and end-user industry through 2035.
  • Quantifies addressable opportunity by segment to guide market entry and expansion sequencing.
Enterprise Network Architecture Adoption Mapping
  • Mapping of public versus permissioned and hybrid network adoption by end-user industry and use case, based on enterprise deployment announcements and filings.
  • Shows which industries are moving to permissioned architectures, guiding platform and partnership strategy.
Blockchain-as-a-Service Revenue Model and Pricing Benchmarking
  • Benchmarking of transaction-fee, subscription, licensing, and managed-service revenue models and pricing across leading providers.
  • Supports pricing design and revenue model selection for platform and service offerings.
Jurisdictional Regulatory Readiness and Use Case Opportunity Mapping
  • Country-level mapping of digital asset, tokenization, and distributed ledger regulations against priority blockchain use cases.
  • Pinpoints regions where regulatory clarity supports near-term deployment and geographic expansion.

FAQs

About the Author

Mihul Sharma

Mihul Sharma

Mihul Sharma is Research Associate at Next Move Strategy Consulting, where he has covered technology, industrial, and healthcare markets for 3 years. His work applies structured business research, market analysis, and secondary-source review to assess market trends, competitive developments, and growth opportunities. He supports report development by fully synthesizing industry data, company information, and market signals into concise findings for strategy and investment-focused research teams.

About the Reviewer

Supradip Baul

Supradip Baul

Supradip Baul is an accomplished business consultant and strategist with over a decade of rich experience in market intelligence, strategy, technology, and business transformation. His work has included rigorous qualitative and quantitative analysis across multiple industries, helping clients shape investment decisions and long-term roadmaps. Earlier in his career, he was associated with Gartner, where he contributed to industry-leading reports and market share analyses. He has worked with leading global companies and holds an MBA with a dual specialization in Marketing and Finance.

Download Free Sample

Amos Chang

AMOS CHANG

Strategy Consultant

Kardex Group

I have bought the intralogistics market reports from NMSC two times so far. Joseph and his team are always very helpful and flexible in responding to any customization requirements on the report. Their expertise in market reports really helps us steer the day-to-day business. I will definitely recommend and come back myself whenever there is a need.

Kevin Coker

KEVIN COKER

Founder, CEO and Board Diector

Proxima Clinical Research

I have been using Next MSC reports for product positioning in a new geography for a long time. They have by far the best reports I have found and the price is reasonable too!

Rishabh Jogani

RISHABH JOGANI

Strategy Analyst

Accenture Japan

We are incredibly impressed with the market report on the real estate market in India provided by Next Move Strategy Consulting. The report was thorough, insightful, and well-structured, offering deep analysis and actionable recommendations. It not only captured the current trends and dynamics but also provided a forward-looking perspective that has been invaluable for our strategic planning. Their team demonstrated exceptional professionalism, attention to detail, and a profound understanding of the industry. The data-driven insights and clarity of presentation exceeded our expectations, making complex market trends easy to understand. We highly recommend Next Move Strategy Consulting to anyone looking for reliable and comprehensive market research services. Their expertise has given us the confidence to navigate the complexities of the Indian real estate market with clarity and foresight.

Nishant Awate

NISHANT AWATE

Business Development Global Sales

Zehnder Group Deutschland GmbH

Our experience working with Next Move Strategy Consulting was positive. The team was responsive, professional, and open to incorporating our specific requirements throughout the project. The India AHU market study was comprehensive and well structured, covering market value and volume forecasts, product and application segments, and key industry trends. The inclusion of both AHU and residential MVHR market insights made the study particularly relevant for our strategic market assessment. Overall, the report provides a solid foundation for evaluating market potential, identifying priority segments, and supporting business-development decisions in India.

Mohit Agarwal

MOHIT AGARWAL

Chief Manager

DryChem India Pvt. Ltd.

Next Move Strategy Consulting is an amazing team of consultants. We required a market study report for our investors on top priority and the team went above and beyond our expectations to deliver the same with ample supporting data within a short time span enabling us to secure the investments and keep our project timeline maintained. Their professionalism, attention to detail, and timely delivery of actionable recommendations have left a lasting impression on our organization.

Custom Market Research Services

We will customize the research for you if the listed report does not fully match your requirements.

Get 30% Free Customization

Select License

This website uses cookies to ensure you get the best experience on our website. Learn more

✖