Blockchain in Banking and Finance Market Global Industry Analysis and Forecast (2026–2035)

Tokenized deposits, repo settlement and stablecoin regulation lift revenue from USD 7.60 Billion in 2025 to USD 62.50 Billion by 2035, a 22.9% CAGR over 2026–2035, with North America leading adoption.

Download Free Sample PDF
Base Year (2025)
$7.60 Billion
Forecast (2035)
$62.50 Billion
CAGR (2026-2035)
22.9%
Top Region
North America

What Is the Blockchain in Banking and Finance Market Size?

The Blockchain in Banking and Finance Market was valued at USD 7.60 Billion in 2025 and is estimated at USD 9.80 Billion in 2026. It is forecast to reach USD 62.50 Billion by 2035, growing at a 22.9% CAGR from 2026 to 2035. North America leads with about 36% share, while platforms and infrastructure hold about 41%.

Our analysis shows that tokenized deposits, repo settlement and stablecoin rails now anchor most spending across the Blockchain in Banking and Finance Market.

Blockchain in Banking and Finance Market Global Industry Analysis and Forecast (2026–2035) Revenue Forecast

Values in USD Billion

2025 $7.60 Billion
2025
2026 $9.80 Billion
2026
2027 $12.04 Billion
2027
2028 $14.80 Billion
2028
2029 $18.19 Billion
2029
2030 $22.36 Billion
2030
2031 $27.48 Billion
2031
2032 $33.77 Billion
2032
2033 $41.50 Billion
2033
2034 $51.01 Billion
2034
2035 $62.50 Billion
2035

Key Takeaways

By Component: Platforms and infrastructure held the largest share, expanding from USD 3.10 Billion in 2025 to USD 22.00 Billion by 2035; Solutions and applications is the fastest growing at 24.1% CAGR from 2026–2035.

By Application: Payments and settlement held the largest share, expanding from USD 2.80 Billion in 2025 to USD 19.00 Billion by 2035; Tokenization and capital markets is the fastest growing at 26.2% CAGR from 2026–2035.

By Network type: Private permissioned held the largest share, expanding from USD 3.60 Billion in 2025 to USD 20.00 Billion by 2035; Public and hybrid is the fastest growing at 29.5% CAGR from 2026–2035.

Dominant Region: North America led with USD 2.75 Billion in 2025 and is projected to reach USD 20.30 Billion by 2035.

Fastest-Growing Region: Middle East & Africa is expected to grow at 26.0% CAGR from 2026–2035, rising from USD 0.55 Billion in 2025 to USD 6.00 Billion by 2035.

Dominant Country: U.S. led with USD 2.30 Billion in 2025 and is projected to reach USD 17.20 Billion by 2035.

Fastest-Growing Country: India is expected to grow at 29.7% CAGR from 2026–2035, rising from USD 0.20 Billion in 2025 to USD 2.90 Billion by 2035.

This Blockchain in Banking and Finance market offers an absolute opportunity of approximately USD 52.70 Billion between 2026 and 2035, a clear investment signal for banks and vendors.

Bank-issued deposit tokens and regulated payment stablecoins are emerging settlement mechanisms. Their relative shares of regulated settlement value through 2030 have not been established by the cited sources.

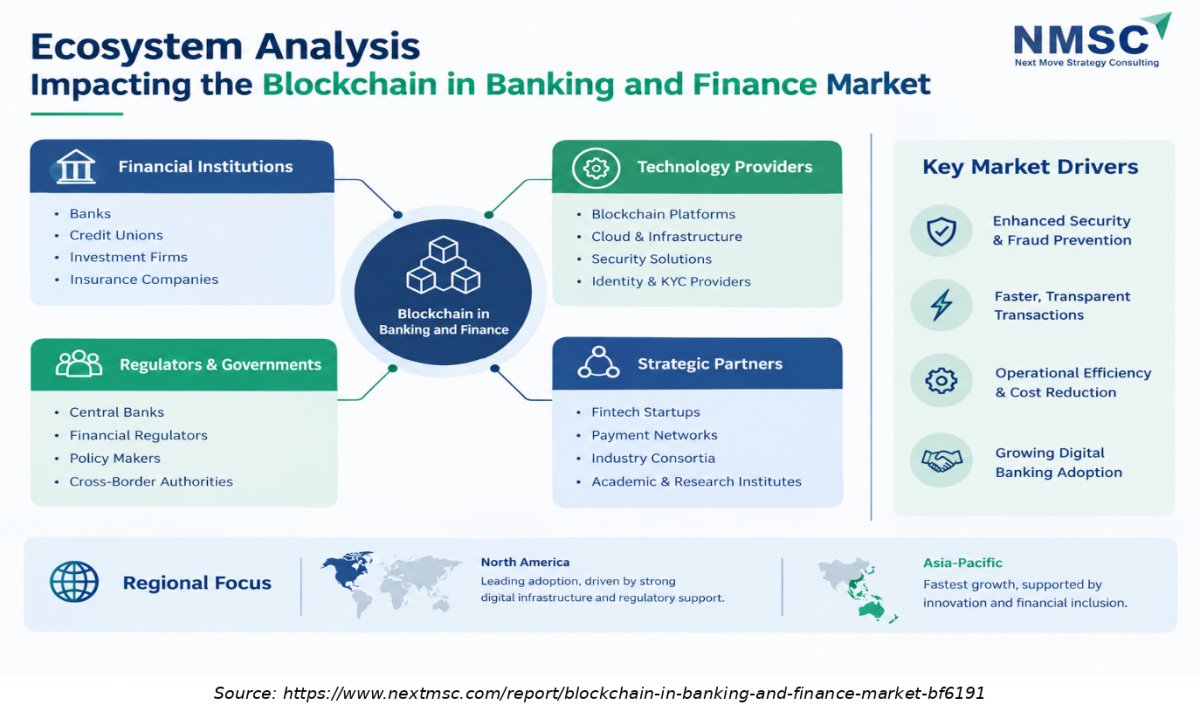
Ecosystem Analysis Impacting the Blockchain in Banking and Finance Market

The infographic highlights the key stakeholders shaping the blockchain in banking and finance market, including financial institutions, technology providers, regulators, and strategic partners. Their collaboration supports secure transactions, greater transparency, improved operational efficiency, and wider digital banking adoption

What Does the Blockchain in Banking and Finance Market Encompass?

The Blockchain in Banking and Finance Market covers distributed ledger platforms, applications and services that banks, brokers, custodians, payment networks and asset managers deploy to settle payments, issue tokenized assets, verify identity and automate credit and trade workflows. Revenue includes platform licences, network and transaction fees, smart contract applications, integration services and managed operations sold into banking and financial services. Cryptocurrency exchange trading revenue, mining income and consumer token speculation sit outside this scope.
Regulation shapes adoption more than technology does. The GENIUS Act, enacted in July 2025, now has a final OCC implementing rule that takes effect on January 18, 2027, while the BIS reported on Project Agora in May 2026 after testing tokenized deposits with central banks. We observed that institutions Favor permissioned ledgers for core settlement and use public networks selectively for distribution, collateral and interoperability pilots.

Market Drivers & Dynamics

Interactive Dataset
Stablecoin and deposit token regulatory clarity driver +2.6% North America, Europe, Asia-Pacific 2026–2030
Tokenized repo and collateral adoption driver +2.2% North America, Europe 2026–2032
Demand for 24/7 cross border settlement driver +1.9% Global 2026–2035
Bank pilots of tokenized funds and Treasuries driver +1.4% North America, Asia-Pacific 2026–2031
Interoperability gaps between proprietary ledgers restraint −1.8% Global 2026–2030
Cybersecurity and smart contract risk restraint −1.1% Global 2026–2035
Legacy core system integration cost restraint −1.0% Europe, Latin America, Middle East & Africa 2026–2032
Source: Next Move Strategy Consulting

Growth Drivers

What Is the Primary Growth Driver?

Regulatory clarity for payment stablecoins and institutional demand for tokenized deposits are potential growth drivers; based on our analysis, we identified that these factors collectively contribute an estimated +2.6% impact to overall CAGR expansion. On October 21, 2026, the Office of the Comptroller of the Currency (OCC) issued Bulletin 2026-50, announcing its final rule implementing the GENIUS Act for payment stablecoins and certain related activities within its jurisdiction. The rule takes effect on January 18, 2027. Nevertheless, evidence is insufficient to establish that banks had previously delayed budgets because of regulatory uncertainty or that the final rule will directly convert exploratory spending into funded projects.

How Is Institutional Scale Driving Blockchain in Banking and Finance Market Growth?

Production volumes show that the technology now carries core financing flows. Broadridge reported USD 7.5 trillion in Distributed Ledger Repo transactions during June 2026, with average daily volume of USD 357 billion. Swift moved its shared ledger into initial use in July 2026 with 17 early adopter institutions. Demand follows proof of resilience, and each new participant raises the value of the network for the next, which supports growth trends across all regions.

Growth Inhibitors

What Is Restraining the Blockchain in Banking and Finance Market?

Fragmentation is the main restraint. Each large bank runs its own token and clearing arrangements, so a deposit token from one issuer cannot settle directly against another. The BIS describes Project Agora as its largest and most complex Innovation Hub effort by geography and participants, which shows how heavy the coordination burden remains. Integration with legacy core systems and cybersecurity add cost. Our findings suggest that interoperability standards will decide whether growth holds near 22.9% or slips lower.

What Are the Growth Opportunities?

Where Does Tokenized, Collateral Create New Revenue?

Intraday repo, sponsored repo and collateral mobility create fee pools that sit on top of existing dealer relationships. Broadridge now publishes aggregated repo data to Bloomberg Terminal subscribers through Kaiko, which improves price transparency and attracts new participants. Vendors that connect tokenized Treasuries and money fund shares to margin workflows benefit most, and clearing banks gain balance sheet relief that funds further investment.

How Can Reusable Identity Lower Onboarding Cost?

Banks repeat know-your-customer (KYC) checks across products and counterparties, which adds cost and delay. Shared credentials built on decentralized identity standards let verified institution reuse evidence across networks while keeping data control. Compliance vendors and consortium operators benefit because verification becomes a recurring service priced per check. Regulators gain auditability, and customers gain faster account opening.

Why Does Private Credit Servicing Offer Growth?

Private credit and loan servicing depend on manual record keeping, which automated workflows can replace. Programmable agreements track covenants, payments and waterfalls in one record, which supports faster audit and secondary trading. Lenders, asset managers and servicers benefit as credit intermediation becomes cheaper per transaction. Lending and credit are forecast to grow at 25.7% CAGR from 2026 to 2035.

Segmentation Analysis

2025 (USD Billion)
2035 (USD Billion)
Platforms and infrastructure 2025: $3.10 Billion | 2035: $22.00 Billion
Platforms an
Solutions and applications 2025: $2.70 Billion | 2035: $24.50 Billion
Solutions an
Services 2025: $1.80 Billion | 2035: $16.00 Billion
Services
Platforms and infrastructure $3.10 Billion $22.00 Billion 21.0%
Solutions and applications $2.70 Billion $24.50 Billion 24.1%
Services $1.80 Billion $16.00 Billion 23.8%

Which Component Segment Leads the Blockchain in Banking and Finance Market?

Platforms and infrastructure led in 2025 with USD 3.10 Billion, or about 41% of revenue, because banks must build ledgers, wallets and custody before applications can run. Solutions and applications are the fastest growing component at 24.1% CAGR from 2026 to 2035 as institutions license readymade tokenization, payments and compliance software. Key management depends on hardware security modules, which keeps infrastructure spend resilient, while services demand tracks integration work.

2025 (USD Billion)
2035 (USD Billion)
Payments and
Tokenization
Trade financ
Identity
KYC and comp
Segment Item 2025 (USD Billion) 2035 (USD Billion) CAGR
Payments and settlement $10.0 USD Billion $40.0 USD Billion 18.0%
Tokenization and capital markets $17.1 USD Billion $51.1 USD Billion 16.0%
Trade finance $24.2 USD Billion $62.2 USD Billion 22.0%
Identity $31.3 USD Billion $73.3 USD Billion 12.0%
KYC and compliance $38.4 USD Billion $84.4 USD Billion 19.0%

Segment-wise data is locked

Unlock complete segment-wise numbers for By Application.

Unlock Full Data
2025 (USD Billion)
2035 (USD Billion)
Private perm
Consortium
Public and h
Segment Item 2025 (USD Billion) 2035 (USD Billion) CAGR
Private permissioned $10.0 USD Billion $40.0 USD Billion 24.0%
Consortium $17.1 USD Billion $51.1 USD Billion 22.0%
Public and hybrid $24.2 USD Billion $62.2 USD Billion 12.0%

Segment-wise data is locked

Unlock complete segment-wise numbers for By Network type.

Unlock Full Data

Growth Opportunities

Our findings suggest that three opportunities offer the clearest path to revenue expansion through 2035.

Where Does Tokenized, Collateral Create New Revenue?

Intraday repo, sponsored repo and collateral mobility create fee pools that sit on top of existing dealer relationships. Broadridge now publishes aggregated repo data to Bloomberg Terminal subscribers through Kaiko, which improves price transparency and attracts new participants. Vendors that connect tokenized Treasuries and money fund shares to margin workflows benefit most, and clearing banks gain balance sheet relief that funds further investment.

How Can Reusable Identity Lower Onboarding Cost?

Banks repeat know-your-customer (KYC) checks across products and counterparties, which adds cost and delay. Shared credentials built on decentralized identity standards let verified institution reuse evidence across networks while keeping data control. Compliance vendors and consortium operators benefit because verification becomes a recurring service priced per check. Regulators gain auditability, and customers gain faster account opening.

Why Does Private Credit Servicing Offer Growth?

Private credit and loan servicing depend on manual record keeping, which automated workflows can replace. Programmable agreements track covenants, payments and waterfalls in one record, which supports faster audit and secondary trading. Lenders, asset managers and servicers benefit as credit intermediation becomes cheaper per transaction. Lending and credit are forecast to grow at 25.7% CAGR from 2026 to 2035.

Regional Outlook

2025 (USD Billion)
2035 (USD Billion)
North Americ
Europe
Asia-Pacific
Middle East
Latin Americ
Region 2025 (USD Billion) 2035 (USD Billion) CAGR (%)
North America $10.0 USD Billion $40.0 USD Billion 9.0%
Europe $17.1 USD Billion $51.1 USD Billion 27.0%
Asia-Pacific $24.2 USD Billion $62.2 USD Billion 25.0%
Middle East & Africa $31.3 USD Billion $73.3 USD Billion 23.0%
Latin America $38.4 USD Billion $84.4 USD Billion 12.0%

Regional data is locked

Unlock complete regional numbers for this market.

Unlock Full Data

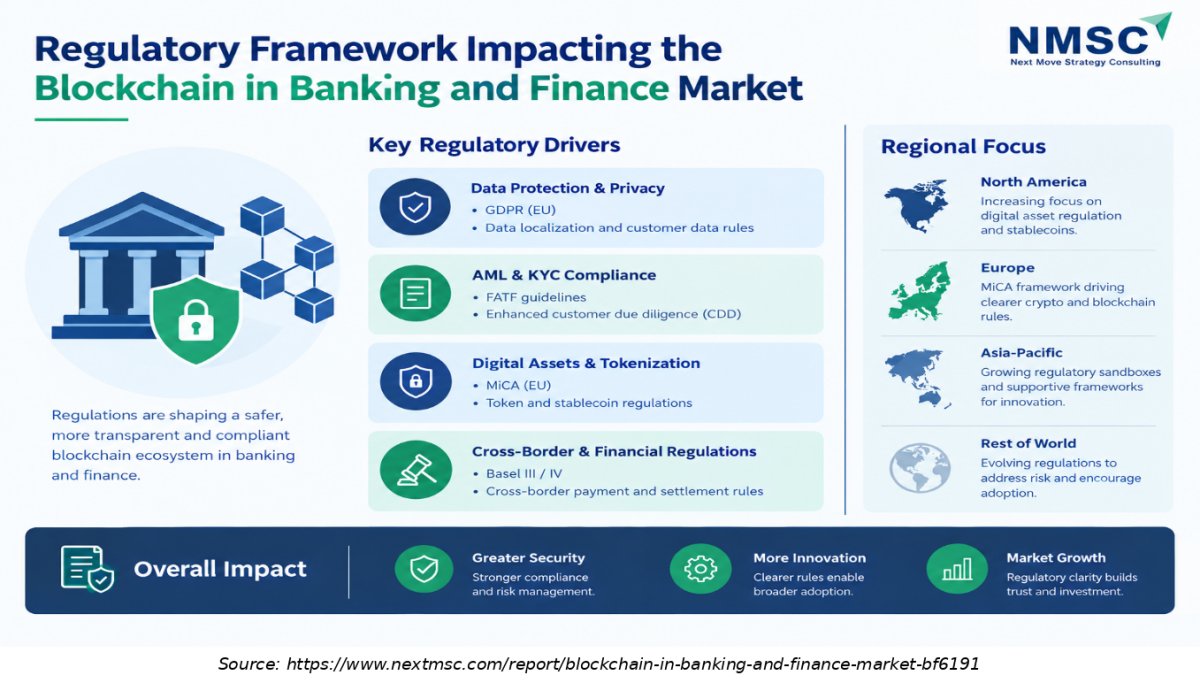
Regulatory Framework Impacting the Blockchain in Banking and Finance Market

The infographic outlines the major regulatory factors influencing blockchain adoption in banking and finance, including data protection, AML and KYC compliance, digital asset regulations, and cross-border financial rules. Clear regulatory frameworks can strengthen security, improve risk management, encourage innovation, and build trust in blockchain-based financial services.

Competitive Landscape

Our assessment indicates that competition in this Industry combines bank led networks, market utilities and technology specialists rather than a single dominant vendor.

How Do Companies Compete in the Blockchain in Banking and Finance Market?

Companies compete on settlement finality, client reach and regulatory standing rather than on price alone. J.P. Morgan leads on payments scale, Broadridge on tokenized repo volume, and Swift on network reach across banks. Pricing combines subscription, per transaction and balance related income, and banks bundle tokenized deposits with existing treasury services to protect margins. Geographic expansion follows client corridors, with HSBC and J.P. Morgan adding markets through 2026.

Which Company Archetypes Dominate?

Four archetypes shape the Blockchain in Banking and Finance Market. Bank led networks, such as J.P. Morgan, HSBC, Citigroup and BNY, differentiate on balance sheet trust. Market infrastructure providers, such as Broadridge and Swift, differentiate on neutrality and scale. Technology specialists, such as Consensus and Digital Asset, differentiate on privacy and developer tooling. Digital asset issuers, such as Circle and Ripple, differentiate on public network liquidity and stablecoin distribution.

What Innovation and Differentiation Strategies Matter Most?

Interoperability is the dominant strategy. Swift built its shared ledger with Consensys on Hyperledger Besu to orchestrate tokenized deposits held on bank ledgers, and Broadridge extends its repo platform toward intraday funding. Banks also invest in programmable payments, tokenized fund flows and privacy preserving networks. We found that vendors who publish transparent operating metrics gain trust faster with risk committees and regulators.

What Is the M&A Activity in This Industry?

Partnerships have outpaced acquisitions. Swift works with Consensys on its ledger, Broadridge collaborates with Kaiko to deliver repo data to Bloomberg Terminal users, and Kinexys and Digital Asset plan to extend JPM Coin to the Canton Network. These alliances give incumbents speed without integration risk. Our analysis shows that consolidation among smaller infrastructure vendors is likely as regulatory capital and compliance costs rise.

Key Market Players

Based on research conducted by NMSC, we identified these leading companies by operating scale and verified activity, ranked in order.

JPMorgan Chase & Co. Broadridge Financial Solutions, Inc. HSBC Holdings plc Citigroup Inc. The Bank of New York Mellon Corporation Society for Worldwide Interbank Financial Telecommunication (Swift) Standard Chartered PLC Consensys Software Inc. Digital Asset Holdings, LLC Circle Internet Group, Inc. Ripple Labs Inc.

Latest Developments

We found that official announcements during 2025–2026 confirm the shift from pilots to production in tokenized settlement.

Date Event
January 2026 Broadridge reported December 2025 Distributed Ledger Repo average daily volume of USD 384 billion and monthly volume near USD 9 trillion.
March 2026 Broadridge reported February 2026 average daily repo volume of USD 362 billion and monthly volume of USD 6.9 trillion.
July 2026 Broadridge reported June 2026 average daily repo volume of USD 357 billion and added repo market data to Bloomberg Terminal through Kaiko.

Expert Insights

Lisa D. Cook

Member of the Board of Governors | Federal Reserve System

"“Tokenization could specifically offer compelling benefits in West Africa and other emerging economies, including potentially faster cross-border payments and better access to capital markets.”"

Analyst Interpretation

The statement highlights blockchain's potential to improve cross-border payment efficiency and expand access to financial markets. Tokenized assets and distributed ledger platforms can streamline transfers, automate settlement, and reduce operational friction. These benefits create opportunities for blockchain-based banking infrastructure, particularly in emerging markets where traditional financial transactions can be costly or slow

Investment Opportunities

Where Are Capital Inflows Concentrated?

Capital flows toward infrastructure that already shows production volume across the Blockchain in Banking and Finance Market. Broadridge’s repo platform, tokenized deposit initiatives, and shared-ledger projects represent primary spending channels, led by proven production transaction volumes across major institutional nodes. Investors also back technology specialists that supply privacy, custody and interoperability tools. Our analysis shows that platforms and infrastructure keep the largest share of spend through 2030 before applications gain ground.

How Will Infrastructure Investment Evolve?

Infrastructure spending is shifting from standalone pilots to shared platforms. Swift's ledger, bank issued deposit tokens and public network bridges require investment in nodes, key management and monitoring. Banks allocate budgets to resilience, since institutional clients expect uptime that matches payment systems. We observed that managed service models lower entry cost and expand the buyer base among mid-sized banks.

What Role Do ESG Considerations Play?

ESG considerations affect network design and capital allocation. Permissioned ledgers use far less energy than proof of work systems, and tokenization supports transparent tracking of green finance instruments. Investors increasingly require disclosure of energy use, governance and custody controls before committing capital. Our assessment indicates that vendors with clear sustainability reporting gain an advantage in institutional procurement.

Key Benefits for Stakeholders

How Do Enterprise and Industry Leaders Benefit?

Banks, corporates and market utilities active in the Blockchain in Banking and Finance Market gain faster settlement, lower reconciliation effort and better collateral use. The forecast detail in this report helps leaders size platform budgets against a USD 62.50 Billion market by 2035. Segment and country analysis identifies where to launch first, and the competitive review clarifies partner choice. Stronger governance, risk and compliance practices follow from programmable controls.

How Do Investors and Financial Analysts Benefit?

Investors receive reconciled forecasts by component, application, network type and region, with CAGR calculated consistently from 2026 to 2035. The analysis separates infrastructure from application revenue, which improves valuation work and highlights where fee income repeats. Readers can compare this segment with the wider blockchain market and judge where regulated adoption creates durable cash flows.

How Do Technology Vendors and Product Teams Benefit?

Vendors gain a map of demand by use case and network design, which guides roadmap choices. The report shows that interoperability, security assurance and compliance integration decide shortlists. Product teams can target the fastest growing segments, such as tokenization and capital markets, and align offerings with enterprise blockchain applications that banks already pilot.

Key Market Segments Evaluated

By Component

  • Platforms and infrastructure
  • Solutions and applications
  • Services

By Application

  • Payments and settlement
  • Tokenization and capital markets
  • Trade finance
  • Identity, KYC and compliance
  • Lending and credit

By Network type

  • Private permissioned
  • Consortium
  • Public and hybrid

By Region

  • North America 
    • U.S.
    • Canada
    • Mexico
  • Europe 
    • UK
    • Germany
    • France
    • Italy
    • Spain
    • Sweden
    • Denmark
    • Finland
    • Netherlands
    • Rest of Europe
  • Asia-Pacific 
    • China
    • India
    • Japan
    • South Korea
    • Taiwan
    • Indonesia
    • Vietnam
    • Australia
    • Philippines
    • Malaysia
    • Rest of APAC
  • Middle East & Africa 
    • Saudi Arabia
    • UAE
    • Egypt
    • Israel
    • Turkey
    • Nigeria
    • South Africa
    • Rest of MEA
  • Latin America 
    • Brazil
    • Argentina
    • Chile
    • Colombia
    • Rest of LATAM

Conclusion & Recommendations

Revenue is projected to rise from USD 9.80 Billion in 2026 to USD 62.50 Billion in 2035, which shows that blockchain is becoming regular financial infrastructure rather than an experiment. Tokenized repo, deposit tokens and shared ledgers already operate at institutional scale. Growth depends on regulatory execution and interoperability, and we expect hybrid networks and tokenized capital markets to gain share steadily.

What Strategic Positioning Recommendations Does NMSC Offer?

Participants in the Blockchain in Banking and Finance Market should anchor strategy on tokenized deposits that connect to shared ledgers, and avoid isolated proprietary tokens. Vendors should invest in interoperability, audited smart contracts and compliance tooling. Market utilities should extend proven products, such as repo, into intraday and collateral use cases. New entrants should partner with chartered institutions to gain distribution and regulatory standing quickly.

How Strong Is the Investment Attractiveness of the Blockchain in Banking and Finance Market?

Investment attractiveness is high but selective. The 22.9% CAGR and the USD 52.70 Billion absolute opportunity between 2026 and 2035 reward exposure to infrastructure and tokenization. Capital should Favor platforms with live volume, regulated clients and clear liability frameworks. Early-stage applications without bank distribution carry greater execution risk and deserve smaller allocations.

What Are the Market Shifts and Key Risks in the Blockchain in Banking and Finance Market?

Three shifts matter most: deposit tokens replacing messaging for settlement, tokenized collateral moving into daily funding, and public networks entering regulated workflows under controls. Key risks include fragmented standards, smart contract failures, cyber incidents and slower rule making outside the United States. Banks that test resilience early reduce the chance that one incident delays wider adoption.

What Are the Primary Growth Pathways Through 2035?

Growth pathways run through cross border corporate treasury, tokenized capital markets and credit servicing. Asia-Pacific and Middle East & Africa add the fastest regional growth, while North America retains scale. Services revenue expands as banks outsource integration and operations. Each pathway depends on dependable settlement finality, and vendors that prove it with published metrics will capture the largest share of new spending.

FAQs

Sources & References

1.

Swift, shared ledger announcement (29 September 2025)

swift.com/fr/node/310352
2.

Swift, collaborative innovation on the shared ledger

swift.com/de/node/310646
3.

Broadridge Financial Solutions, DLR December 2025 release

broadridge.com
4.

Broadridge Financial Solutions, DLR January 2026 release

broadridge.com
5.

Broadridge Financial Solutions, DLR February 2026 release

broadridge.com
6.

Broadridge Financial Solutions, DLR March 2026 release

broadridge.com
7.

Broadridge Financial Solutions, DLR June 2026 release

broadridge.com
8.

Office of the Comptroller of the Currency, Bulletin 2026-50

occ.treas.gov
9.

Office of the Comptroller of the Currency, News Release 2026-9

occ.gov
10.

Bank for International Settlements, Project Agora FAQ

bis.org
11.

JPMorgan Chase & Co. and Corpay, Kinexys Digital Payments release via Business Wire

secure.businesswire.com

About the Author

Mayurima Roy

Mayurima Roy

Mayurima Roy is Research Analyst at Next Move Strategy Consulting, where she has spent 4 years working across the firm's full industry coverage rather than a single fixed vertical. Her work centers on structured research, ongoing trend tracking, competitive assessment, and insight-led content development, translating complex market data into clear, decision-ready narratives that support informed client decision-making across diverse global industries, market sectors, and world regions every day.

About the Reviewer

Supradip Baul

Supradip Baul

Supradip Baul is an accomplished business consultant and strategist with over a decade of rich experience in market intelligence, strategy, technology, and business transformation. His work has included rigorous qualitative and quantitative analysis across multiple industries, helping clients shape investment decisions and long-term roadmaps. Earlier in his career, he was associated with Gartner, where he contributed to industry-leading reports and market share analyses. He has worked with leading global companies and holds an MBA with a dual specialization in Marketing and Finance.

Download Free Sample

Rishabh Jogani

RISHABH JOGANI

Strategy Analyst

Accenture Japan

We are incredibly impressed with the market report on the real estate market in India provided by Next Move Strategy Consulting. The report was thorough, insightful, and well-structured, offering deep analysis and actionable recommendations. It not only captured the current trends and dynamics but also provided a forward-looking perspective that has been invaluable for our strategic planning. Their team demonstrated exceptional professionalism, attention to detail, and a profound understanding of the industry. The data-driven insights and clarity of presentation exceeded our expectations, making complex market trends easy to understand. We highly recommend Next Move Strategy Consulting to anyone looking for reliable and comprehensive market research services. Their expertise has given us the confidence to navigate the complexities of the Indian real estate market with clarity and foresight.

Semih Kavaklioglu

SEMIH KAVAKLIOGLU

Co-Founder & Sales Manager

Decortie

I work a lot in the marketing industry and I know that research is an essential part of any campaign. I have used Market research reports for my own products and I found them to be very informative and well-researched. The team here produces insightful reports for a good price

Henri Knyphausen

HENRI KNYPHAUSEN

Partner at Singulier [Ex-BCG]

Singulier

I recently engaged NEXTMSC.com for a commercial due diligence project within the intralogistics sector, and I am pleased to provide a reference based on my experience. In utilizing NEXTMSC.com's services, I found their report to offer valuable insights into market dynamics and key industry players. The initial report provided a solid foundation for our analysis. However, as we were investigating a smaller target in the market, and I had specific customization requests requiring additional research. These requests included detailed information on product portfolios of various players and sub-market sizes, both inclusive and exclusive of certain product categories. NEXTMSC.com demonstrated commendable responsiveness and agility in accommodating these customization requests. Within a timeframe of 1-2 weeks, they delivered a revised report that met our specific needs. Furthermore, they were receptive to my follow-up inquiries, ensuring clarity and understanding of the data provided. The final deliverable significantly contributed to our due diligence efforts. One of NEXTMSC.com's notable strengths lies in their qualitative research capabilities. However, for future engagements, I would recommend the inclusion of a quantified market model in Excel format. Such a model would offer the ability to conduct in-depth analyses and explore various market segments, including country-specific data and subcomponent breakdowns. Based on my positive experience, I would not hesitate to work with NEXTMSC.com again. Their responsiveness, willingness to accommodate customization requests, and commitment to delivering actionable insights make them a reliable partner for commercial research projects.

Mohit Agarwal

MOHIT AGARWAL

Chief Manager

DryChem India Pvt. Ltd.

Next Move Strategy Consulting is an amazing team of consultants. We required a market study report for our investors on top priority and the team went above and beyond our expectations to deliver the same with ample supporting data within a short time span enabling us to secure the investments and keep our project timeline maintained. Their professionalism, attention to detail, and timely delivery of actionable recommendations have left a lasting impression on our organization.

Gustaf Hummel Burstrom

GUSTAF HUMMEL BURSTROM

Founder

Revline Tools AB

Joseph and the team at Next Move Strategy Consulting have been excellent to work with, in supplying us with relevant market data and forecasts for our specific category. We had some special requirements and they were able to do a custom package to suit our needs. We would definitely recommend them to any other company needing market data and forecasts

Custom Market Research Services

We will customize the research for you if the listed report does not fully match your requirements.

Get 30% Free Customization

Select License

This website uses cookies to ensure you get the best experience on our website. Learn more

✖