Data Center Renewable Energy Procurement Market Analysis and Forecast (2026–2035)

Data Center Renewable Energy Procurement Market size was USD 11,600.00 Million in 2025, projected to reach USD 44,000.00 Million by 2035, growing at a CAGR of 14.0% from 2026 to 2035. Key drivers include AI driven electricity demand, gigawatt scale hyperscaler contracts and storage paired supply, with North America leading the market.

Download Free Sample PDF
Base Year (2025)
$11,600.0 Million
Forecast (2035)
$44,000.0 Million
CAGR (2026-2035)
14.0%
Top Region
North America

What Is the Data Center Renewable Energy Procurement Market Size?

The data center renewable energy procurement market was valued at USD 11,600.00 Million in 2025 and is estimated at USD 13,570.00 Million in 2026. It is projected to reach USD 44,000.00 Million by 2035, growing at a CAGR of 14.0% from 2026 to 2035. North America led with about 58% share in 2025. Physical PPA was the largest sub segment, with about 46% share.

Our analysis shows that contracting is shifting from annual certificate matching toward firm, locally sited supply, on a demand base of about 485 TWh of data center electricity use in 2025.

Data Center Renewable Energy Procurement Market Analysis and Forecast (2026–2035) Revenue Forecast

Values in USD Million

2025 $11,600.0 Million
2025
2026 $13,570.0 Million
2026
2027 $15,469.8 Million
2027
2028 $17,635.6 Million
2028
2029 $20,104.6 Million
2029
2030 $22,919.2 Million
2030
2031 $26,127.9 Million
2031
2032 $29,785.8 Million
2032
2033 $33,955.8 Million
2033
2034 $38,709.6 Million
2034
2035 $44,000.0 Million
2035

Key Takeaways

By Procurement Model: Power Purchase Agreement held the largest share, expanding from USD 9,512.00 Million in 2025 to USD 35,200.00 Million by 2035; Utility Green Tariff is the fastest growing at 15.7% CAGR from 2026–2035.

By Energy Source: Solar held the largest share, expanding from USD 4,872.00 Million in 2025 to USD 17,160.00 Million by 2035; Hybrid Solar and Storage is the fastest growing at 23% CAGR from 2026–2035.

By Revenue Stream: Renewable Electricity held the largest share, expanding from USD 10,556.00 Million in 2025 to USD 39,160.00 Million by 2035; Advisory and Platform Services is the fastest growing at 21.8% CAGR from 2026–2035.

By End User: Hyperscale Cloud Providers held the largest share, expanding from USD 7,888.00 Million in 2025 to USD 29,040.00 Million by 2035; Colocation Providers is the fastest growing at 15% CAGR from 2026–2035.

By Contract Tenor: 10 to 15 Years held the largest share, expanding from USD 5,220.00 Million in 2025 to USD 19,360.00 Million by 2035; Above 15 Years is the fastest growing at 16.8% CAGR from 2026–2035.

Dominant Region: North America held the largest share at USD 6,728.00 Million in 2025, rising to USD 22,000.00 Million by 2035.

Fastest Growing Region: Asia-Pacific is the fastest growing at 20.3% CAGR from 2026–2035.

Dominant Country: The U.S. was the largest at USD 6,055.20 Million in 2025.

Fastest Growing Country: India is the fastest growing at 26.7% CAGR from 2026–2035.

The market is expected to add USD 30,430.00 Million in annual supplier revenue between 2026 and 2035, creating significant opportunities for renewable energy developers, utilities, and procurement service providers.

According to NMSC analysis, value creation will tilt toward suppliers that can bundle storage with generation, because buyers increasingly judge contracts on hourly delivery rather than annual volume.

Ecosystem of the Data Center Renewable Energy Procurement Market

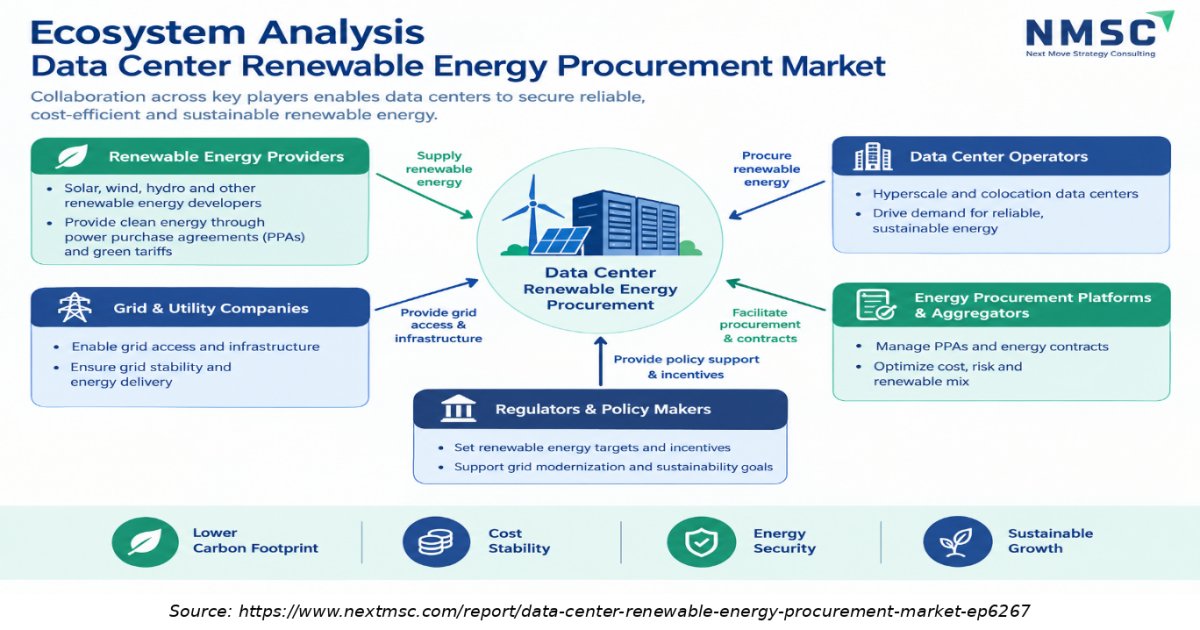
The above infographic shows that value concentrates in the contract layer, where buyers, developers and enablers negotiate structure. Hyperscalers set the pace as demand anchors. Developers with storage and firm supply win larger contracts. Grid operators and carbon accounting bodies shape what counts as eligible supply. Participants should therefore invest in interconnection readiness, storage partnerships and transparent certificate tracking.

What does the Data Center Renewable Energy Procurement Market Encompass?

The data center renewable energy procurement market covers revenue earned by renewable generators, utilities, certificate suppliers and procurement service providers from contracts with data center operators. It includes physical and virtual PPAs, utility green tariffs, unbundled certificates and advisory platforms. The market is measured based on revenue earned by renewable energy generators, utilities, certificate suppliers, and procurement service providers. Nuclear and gas supply, generation equipment sales and transmission are excluded. Our assessment indicates that the market is at the growth stage, supported by increasing hyperscale data center electricity demand, evolving hourly matching requirements, and greater integration of energy storage.

Market Drivers & Dynamics

Interactive Dataset
AI driven data center electricity demand driver +4.2 Global, led by U.S. and China 2026–2035
Gigawatt scale hyperscaler contracting driver +3.1 North America, Europe 2026–2030
Storage paired and hybrid supply maturity driver +1.8 Global 2027–2035
Hourly matching and carbon accounting rules driver +1.2 Global 2027–2035
Grid connection queues and interconnection delays restraint −2.0 U.S., Europe 2026–2030
Tax credit phase out and cost pressure on smaller buyers restraint −1.6 U.S. 2026–2028
Limited corporate market access in emerging economies restraint −1.1 Asia-Pacific, Middle East & Africa 2026–2032
Source: Next Move Strategy Consulting

Growth Drivers

What Is Driving Demand for Renewable Supply from Data Centers?

Electricity demand is the base driver. Half of the global growth in data center demand is expected to be met by renewables. This ties procurement volume directly to AI server deployment. Operators that sign early lock in supply and price visibility, while suppliers gain contracted revenue to finance new projects. IEA data shows datacenterconsumption rising from about 485 TWh in 2025 to 945 TWh in 2030.

Why Are Hyperscaler Commitments Scaling to Gigawatts?

Hyperscalers now contract in gigawatts rather than megawatts. Google reports a clean energy portfolio above 23 GW across more than 170 agreements since 2010. Meta and DESRI added 850 MW of agreements in May 2026, lifting their U.S. portfolio to 2.5 GW. Such large-scale commitments can provide developers with greater offtake certainty and support the financing of multi-year renewable energy project pipelines. The risk for smaller buyers is crowding out, since large contracts absorb limited project supply.

Growth Inhibitors

How Do Grid Connection Delays Restrain Market Growth?

Interconnection is the main physical restraint. The IEA notes that grid connection queues for supply and data center projects are long and complex. It estimates around 20% of planned data center projects could face delays. Delayed projects postpone the start of contracted deliveries and push revenue recognition into later years. Operators respond with colocated generation and storage, which shifts procurement value toward developers that control sites and interconnection rights.

Segmentation Analysis

2025 (USD Million)
2035 (USD Million)
Power Purchase Agreement 2025: $9,512.0 Million | 2035: $35,200.0 Million
Power Purcha
Physical PPA 2025: $5,336.0 Million | 2035: $21,120.0 Million
Physical PPA
Virtual PPA 2025: $4,176.0 Million | 2035: $14,080.0 Million
Virtual PPA
Utility Green Tariff 2025: $1,392.0 Million | 2035: $6,160.0 Million
Utility Gree
Unbundled Certificates 2025: $696.0 Million | 2035: $2,640.0 Million
Unbundled Ce
Power Purchase Agreement $9,512.0 Million $35,200.0 Million 13.7%
Physical PPA $5,336.0 Million $21,120.0 Million 14.4%
Virtual PPA $4,176.0 Million $14,080.0 Million 12.6%
Utility Green Tariff $1,392.0 Million $6,160.0 Million 15.7%
Unbundled Certificates $696.0 Million $2,640.0 Million 14.0%

Which Procurement Model Leads the Market?

Power Purchase Agreements dominate the procurement landscape, with Physical PPAs representing the largest subsegment at USD 5,336.00 Million in 2025. Physical PPA grows at 14.4% CAGR because colocated and hybrid supply needs direct delivery. Utility Green Tariff is the fastest top-level segment at 15.7%. Virtual PPA grows more slowly at 12.6%, since hourly matching rules reduce the value of purely financial structures.

Regulatory Framework Impacting the Data Center Renewable Energy Procurement Market

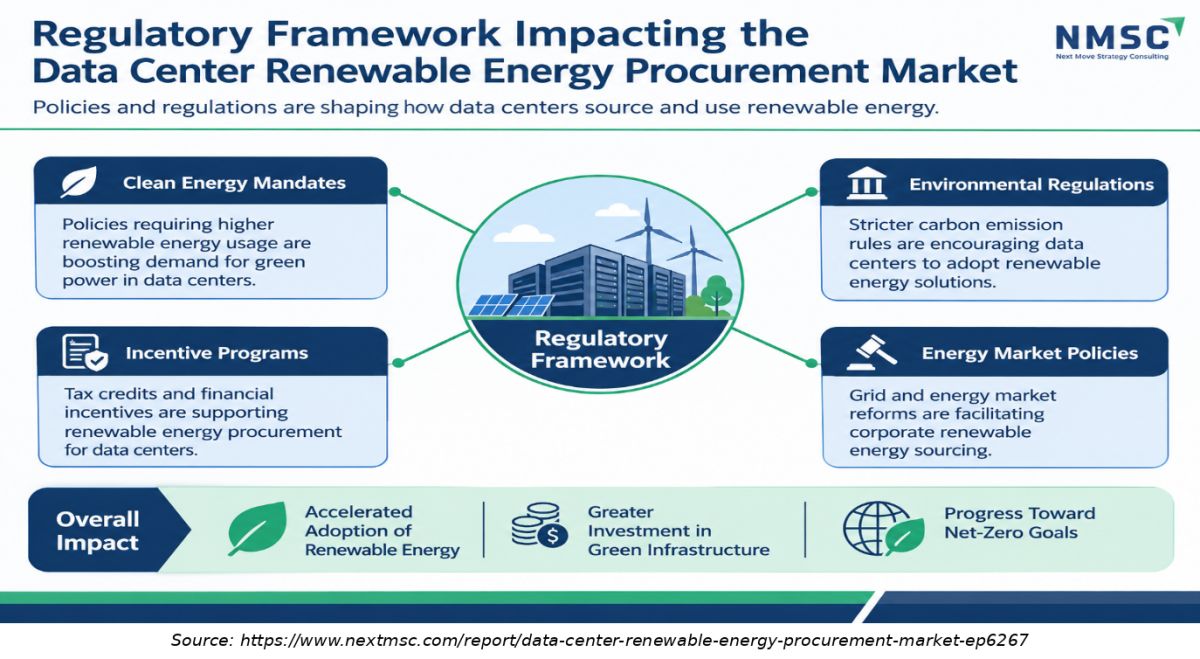
The Data Center Renewable Energy Procurement Market infographic shows that regulation shapes contract design more than price. Carbon accounting rules push buyers toward hourly matched supply, while interconnection rules decide delivery timing. Market access programs such as Malaysia’s corporate green power framework open new geographies. Participants should track Scope 2 revisions, engage early on grid queues and structure contracts that remain compliant if matching rules tighten. Suppliers able to document hourly delivery gain an advantage.

Growth Opportunities

Our findings suggest that three opportunity areas offer the clearest paths to incremental contract value.

Where Can Firm Supply Create Premium Contracts?

Storage backed supply is the largest opportunity. Hybrid Solar and Storage grows at 23% CAGR to USD 8,800.00 Million by 2035. Developers that bundle batteries can charge for hourly delivery, and buyers gain resilience. Realization depends on interconnection access and continued battery cost declines. Long duration storage could widen the opportunity further.

How Large Is the Advisory and Platform Opportunity?

Advisory and Platform Services grow at 21.8% CAGR, reaching USD 2,640.00 Million by 2035. Standardized platforms shorten negotiation cycles. Sunraycer reported that LevelTen’s LEAP process cut PPA execution to under ten weeks in its 2026 Google deal. Smaller buyers and colocation operators benefit most, provided platforms deliver transparent pricing and certificate tracking.

Can Asia-Pacific Become the Next Scale Market?

Asia-Pacific grows at 20.3% CAGR, the fastest of any region. Malaysia’s program based PPA with Google and Japan’s NEC virtual PPA show early structures. Suppliers with local partners and certificate expertise can win first mover contracts. Realization requires clear regulatory frameworks, since market access rules, not demand, currently limit corporate buying across several economies.

Ecosystem Analysis

Regional Outlook

2025 (USD Million)
2035 (USD Million)
North Americ
Asia-Pacific
Europe
Middle East
Latin Americ
Region 2025 (USD Million) 2035 (USD Million) CAGR (%)
North America $10.0 USD Million $40.0 USD Million 9.0%
Asia-Pacific $17.1 USD Million $51.1 USD Million 27.0%
Europe $24.2 USD Million $62.2 USD Million 25.0%
Middle East & Africa $31.3 USD Million $73.3 USD Million 23.0%
Latin America $38.4 USD Million $84.4 USD Million 12.0%

Regional data is locked

Unlock complete regional numbers for this market.

Unlock Full Data

Competitive Landscape

We found that demand is concentrated among a few hyperscalers while supply is split between global utilities and specialist developers.

How Do Suppliers Compete for Data Center Contracts?

Suppliers compete on delivery certainty, price and the ability to offer firm shapes. Engie’s Swenson Ranch project, a USD 900 million asset, supplies 100% of its output to Meta. Pricing is rising for new solar and wind, so suppliers differentiate through interconnection rights and storage. Geographic expansion into Asia-Pacific gives global suppliers an edge over regional peers.

Which Competitive Archetypes Dominate the Market?

Three archetypes dominate. Integrated utilities such as Engie and RWE offer multi country portfolios. Specialist developers such as DESRI, Linea Energy and Sunraycer focus on project origination in the U.S. Asset managers such as Brookfield Renewable provide scale and balance sheet depth. Buyers such as Alphabet are also becoming suppliers through ownership of developers.

How Are Companies Differentiating Through Innovation?

Differentiation centers on contract design rather than technology. NextEra’s Meta agreements combined solar with storage agreements, and platforms such as LevelTen’s LEAP shorten negotiation cycles. Suppliers also offer certificates with hourly tracking. Operators evaluating datacenterpower solutions should compare delivery shapes, interconnection status and certificate quality, not only price per megawatt hour.

What Role Do Acquisitions and Partnerships Play?

Partnerships build volume and acquisitions secure control. Meta’s relationships with NextEra, Engie, RWE and DESRI illustrate repeat contracting. Alphabet’s Intersect acquisition integrates a developer inside a buyer. In India, Inox Clean Energy acquired Vibrant Energy’s 1,337 MW commercial and industrial portfolio. Expect more portfolio acquisitions as suppliers seek scale to win large contracts.

Key Market Players

Our analysis identifies the following eight companies as key participants with publicly reported renewable energy contracts or projects linked to data center electricity demand during 2025–2026.

Brookfield Renewable Partners L.P. NextEra Energy, Inc. DESRI Engie SA TotalEnergies SE RWE AG Linea Energy Sunraycer Renewables

Latest Developments

Based on research conducted by NMSC, we found that agreements, acquisitions and storage paired structures dominated activity between December 2025 and May 2026.

Date Event
Mar 2026 Google signed PPAs for 400 MW of Texas solar from Sunraycer’s Lupinus projects, executed through LevelTen’s LEAP process in under ten weeks.
Dec 2025 Alphabet announced a definitive agreement to acquire Intersect for USD 4.75 billion in cash plus assumed debt.
Dec 2025 TotalEnergies and Google signed a 21-year PPA for 1 TWh of solar power from Malaysia’s Citra Energies plant.

Investment Opportunities

Where Is Capital Concentrating in Data Center Renewable Supply?

Verified announcements show capital moving into storage paired projects and developer ownership. Alphabet’s USD 4.75 billion Intersect deal and Engie’s USD 900 million Swenson project show scale. NMSC interprets this as a shift toward assets that deliver firm clean energy at the data center site. Investors should prioritize developers with interconnection rights and storage capacity.

How Does Infrastructure Investment Shape Contract Capacity?

Capacity depends on grid and storage infrastructure. The IEA estimates that around 20% of planned data center projects face delay risk from grid constraints. Projects that bring their own generation and batteries avoid queues and reach operation sooner. NMSC views transmission and storage readiness as the gating factor for capacity, so infrastructure investors can capture value through colocated energy parks.

What ESG Considerations Matter for Investors?

ESG scrutiny is tightening. Proposed GHG Protocol Scope 2 changes would require hourly tracking, which weakens claims based on annual certificates. Investors should check that contracts add new capacity and match consumption by hour. Where suppliers document delivery, they earn a credibility premium. Contracts that rely on unbundled certificates carry higher reputational risk as standards evolve.

Key Benefits for Stakeholders

What Do Data Center Operators Gain?

Operators building a green datacenter gain price visibility and compliance readiness. Hyperscale Cloud Providers represent USD 7,888.00 Million of 2025 spending. Operators that procure renewable energy through storage-paired contracts can improve hourly supply-demand matching and potentially reduce exposure to electricity price volatility, subject to storage capacity and dispatch conditions. Constraints include limited project supply and interconnection timelines, so early commitment matters.

How Do Renewable Developers and Utilities Benefit?

Developers gain contracted revenue that supports project financing. Hybrid Solar and Storage grows at 23% CAGR, which rewards suppliers that combine generation with batteries. Utilities benefit from increased demand for contracted renewable electricity and opportunities to expand their green tariff offerings. The main risk is buyer concentration, as a small number of hyperscalers account for a substantial share of large renewable energy contracts and may exert significant pricing pressure on suppliers.

Why Does the Market Matter to Policymakers and Regulators?

Regulators balance data center growth against grid stability. The IEA notes that data centers drive more than 20% of electricity demand growth in advanced economies to 2030. Procurement models that add new renewable capacity can ease supply strain. Policymakers can shape outcomes through interconnection reform, certificate standards and clear rules for corporate access to renewable power.

Key Market Segments Evaluated

By Procurement Model

  • Power Purchase Agreement 
    • Physical PPA
    • Virtual PPA
  • Utility Green Tariff
  • Unbundled Certificates

By Energy Source

  • Solar
  • Wind 
    • Onshore Wind
    • Offshore Wind
  • Hydropower
  • Hybrid Solar and Storage
  • Geothermal

By Revenue Stream

  • Renewable Electricity
  • Environmental Attribute Certificates
  • Advisory and Platform Services

By End User

  • Hyperscale Cloud Providers
  • Colocation Providers
  • Enterprise and Government

By Contract Tenor

  • Under 10 Years
  • 10 to 15 Years
  • Above 15 Years

By Region

  • North America 
    • U.S.
    • Canada
    • Mexico
  • Europe 
    • UK
    • Germany
    • France
    • Italy
    • Spain
    • Sweden
    • Denmark
    • Finland
    • Netherlands
    • Rest of Europe
  • Asia-Pacific 
    • China
    • India
    • Japan
    • South Korea
    • Taiwan
    • Indonesia
    • Vietnam
    • Australia
    • Philippines
    • Malaysia
    • Rest of APAC
  • Middle East & Africa 
    • Saudi Arabia
    • UAE
    • Egypt
    • Israel
    • Turkey
    • Nigeria
    • South Africa
    • Rest of MEA
  • Latin America 
    • Brazil
    • Argentina
    • Chile
    • Colombia
    • Rest of LATAM

Conclusion & Recommendations

The Data Center Renewable Energy Procurement Market grows from USD 13,570.00 Million in 2026 to USD 44,000.00 Million by 2035 at 14.0% CAGR, adding USD 30,430.00 Million. Growth rests on IEA demand projections and hyperscaler contracting. The path is not linear, since interconnection delays and incentive changes can shift timing. Our assessment indicates a growth stage market that matures as hourly matching becomes standard.

What Strategic Positioning Recommendations Does NMSC Offer?

Suppliers should build storage paired offers and secure interconnection rights early, before queues lengthen further. Operators should diversify across physical PPAs, green tariffs and platform sourced contracts. Colocation providers grow at 15% CAGR and should formalize renewable clauses for tenants. Advisory firms should invest in hourly tracking tools, since compliance demand is rising.

How Attractive Is the Data Center Renewable Energy Procurement Market for Investment?

Attractiveness is high but selective. North America holds the largest base, while Asia-Pacific grows fastest at 20.3% CAGR. Capital is flowing to developers with firm supply and to platforms that cut contracting time. Investors should weigh concentration risk, since a small group of buyers controls most volume. Contract quality matters more than headline megawatts.

What Are the Key Market Shifts and Risks in the Data Center Renewable Energy Procurement Market?

Three shifts define risk. Hourly matching rules may devalue annual certificates. Grid queues may delay deliveries. Rising development costs and incentive changes may push out smaller buyers. We found that buyer diversity narrowed in the U.S. in 2025 as smaller companies stepped back. Operators and suppliers should stress test contracts against delay and rule change scenarios.

What Are the Primary Growth Pathways Through 2035?

Four pathways stand out through 2035. Hybrid Solar and Storage grows at 23% CAGR. Advisory and Platform Services grow at 21.8% CAGR. Contracts above 15 years grow at 16.8% CAGR. Asia-Pacific grows at 20.3% CAGR. Suppliers that combine these pathways should capture the largest share of incremental value.

Delivered Customizations

We have successfully delivered the following deep-dive customizations:

Client Request Customization Delivered Value Adds
Historical Procurement Activity Analysis
  • Historical analysis of contracted renewable capacity and deal activity across PPA, green tariff, on-site, and certificate-based procurement models, 2015 to present.
  • Shows which procurement models are scaling fastest, helping prioritize contracting channels and timing.
Procurement Opportunity Sizing (TAM / SAM / VAM)
  • Total, serviceable, and obtainable renewable procurement demand from data centers through 2035, split by procurement model and region.
  • Quantifies addressable contracting volume per model, supporting market entry and capacity investment decisions.
Offtaker-Level Contracted Capacity Benchmarking
  • Company-level benchmarking of contracted renewable capacity (MW) and annual procurement volume by hyperscaler and colocation operator, by procurement model.
  • Identifies the most active buyers and their model preferences, supporting customer targeting and partnership strategy.
PPA Structure and Pricing Benchmarking
  • Benchmarking of disclosed PPA and green tariff pricing, tenor, and structure (pay-as-produced, baseload, hourly-matched) by procurement model and region.
  • Supports offer pricing and contract structuring for developers and utilities competing for data center demand.
Hourly Matching and Certificate Quality Assessment
  • Assessment of annual REC-based versus hourly (24/7) matched procurement by model, mapped against GHG Protocol Scope 2 requirements and buyer disclosures.
  • Shows where demand for hourly-matched and time-stamped supply is rising, guiding product design and clean-firm investment.
Interconnection and Delivery Timeline Benchmarking
  • Comparison of grid interconnection, permitting, and delivery timelines for on-site, behind-the-meter, and grid-connected virtual PPA projects serving data centers, using public queue and regulator data.
  • Identifies which procurement models can reach commercial operation fastest, informing project pipeline and siting priorities.

FAQs

Sources & References

1.

International Energy Agency, Energy and AI (executive summary)

iea.org
2.

International Energy Agency, Energy and AI press release

iea.org
3.

IEA Key Questions on Energy and AI, as reported by AE Solar

ae-solar.com/company/news/149
4.

IEA regional data, as reported by TaiyangNews

taiyangnews.info
5.

TotalEnergies press release, Malaysia PPA with Google

totalenergies.com/node/27926
6.

ESG Today, Google and TotalEnergies Malaysia PPA

esgtoday.com
7.

Technews, TotalEnergies and Google PPA

technews.tw
8.

PV Tech, Alphabet to acquire Intersect

pv-tech.org
9.

Storage Newsletter, Alphabet announcement on Intersect

storagenewsletter.com
10.

Energy Storage News, NextEra and Meta agreements

energy-storage.news
11.

PV Tech, Meta and Engie Texas solar PPA

pv-tech.org
12.

ESG Today, Meta and RWE solar PPAs

esgtoday.com
13.

PV Magazine, Microsoft and Brookfield 10.5 GW agreement (2024)

pv-magazine.com
14.

Pulse, Google and Linea Energy Duffy project PPA

pulse.bot
15.

Pulse, Google and Sunraycer PPAs (POWER Magazine report)

pulse.bot
16.

Pulse, Meta and DESRI PPAs

pulse.bot
17.

IDC Nova, NEC virtual PPA in Japan

idcnova.com
18.

ESG Dive, corporate clean energy procurement and GHG Protocol proposal

esgdive.com
19.

Digit, UK AI Energy Council coverage

digit.fyi
20.

PV Tech, IEA launch coverage with Birol quotation

pv-tech.org

About the Author

Mayurima Roy

Mayurima Roy

Mayurima Roy is Research Analyst at Next Move Strategy Consulting, where she has spent 4 years working across the firm's full industry coverage rather than a single fixed vertical. Her work centers on structured research, ongoing trend tracking, competitive assessment, and insight-led content development, translating complex market data into clear, decision-ready narratives that support informed client decision-making across diverse global industries, market sectors, and world regions every day.

About the Reviewer

Supradip Baul

Supradip Baul

Supradip Baul is an accomplished business consultant and strategist with over a decade of rich experience in market intelligence, strategy, technology, and business transformation. His work has included rigorous qualitative and quantitative analysis across multiple industries, helping clients shape investment decisions and long-term roadmaps. Earlier in his career, he was associated with Gartner, where he contributed to industry-leading reports and market share analyses. He has worked with leading global companies and holds an MBA with a dual specialization in Marketing and Finance.

Download Free Sample

Melanie Samko

MELANIE SAMKO

Director of Marketing

TOSOH BIOSCIENCE, INC.

The information provided by NMSC is incredibly valuable, thank you so much for such a excellent work. I really appreciate it. I will make sure to reference all of it, in my summary document.

Semih Kavaklioglu

SEMIH KAVAKLIOGLU

Co-Founder & Sales Manager

Decortie

I work a lot in the marketing industry and I know that research is an essential part of any campaign. I have used Market research reports for my own products and I found them to be very informative and well-researched. The team here produces insightful reports for a good price

Diana Trejo

DIANA TREJO

Assistant Manager

Sumitomo Corporation de Mexico, S.A. de C.V.

Recently, we purchased a report on the Mexico Data Center Market from Next Move Strategy Consulting. The service has been excellent, with support that is always timely and thoroughly professional. The information provided is interesting, highly useful, and delivered with clarity. I would highly recommend NextMSC for anyone seeking insightful and dependable analysis.

Kishu Kanda

KISHU KANDA

Strategy Analyst

Accenture

We purchased the AI Consumer Market Report from this company. Not only did they customize the report to meet our specific requirements, but they also showed great flexibility in accommodating our budget. The report we received fully met our expectations. Additionally, they provided prompt and thorough responses to both our pre-purchase and follow-up questions. We look forward to working with this company again in the future.

Mohit Agarwal

MOHIT AGARWAL

Chief Manager

DryChem India Pvt. Ltd.

Next Move Strategy Consulting is an amazing team of consultants. We required a market study report for our investors on top priority and the team went above and beyond our expectations to deliver the same with ample supporting data within a short time span enabling us to secure the investments and keep our project timeline maintained. Their professionalism, attention to detail, and timely delivery of actionable recommendations have left a lasting impression on our organization.

Custom Market Research Services

We will customize the research for you if the listed report does not fully match your requirements.

Get 30% Free Customization

Select License

This website uses cookies to ensure you get the best experience on our website. Learn more

✖