Digital Therapeutics Market Size, Share & Trends by Regulatory Status (Prescription, Non-Prescription), Clinical Function, Platform, Deployment Model, Revenue Model, Customer Type, Distribution Channel (Direct Sales, Healthcare Provider Network, Health Insurance Network, Employer Benefits Programs, Pharmacy Network, Digital App Stores, and Pharmaceutical Commercial Partnerships), and By End User (Adults, Pediatrics, and Geriatrics) and Region — Global Industry Report and Forecast, 2026–2035
Industry: Healthcare | Publishing Date: July 29, 2026 | Last Updated: September 30, 2026 | No of Pages: N/A | No. of Tables: N/A | No. of Figures: N/A | Format: PDF | Report Code: HC2012
What Is the Digital Therapeutics Market Size?
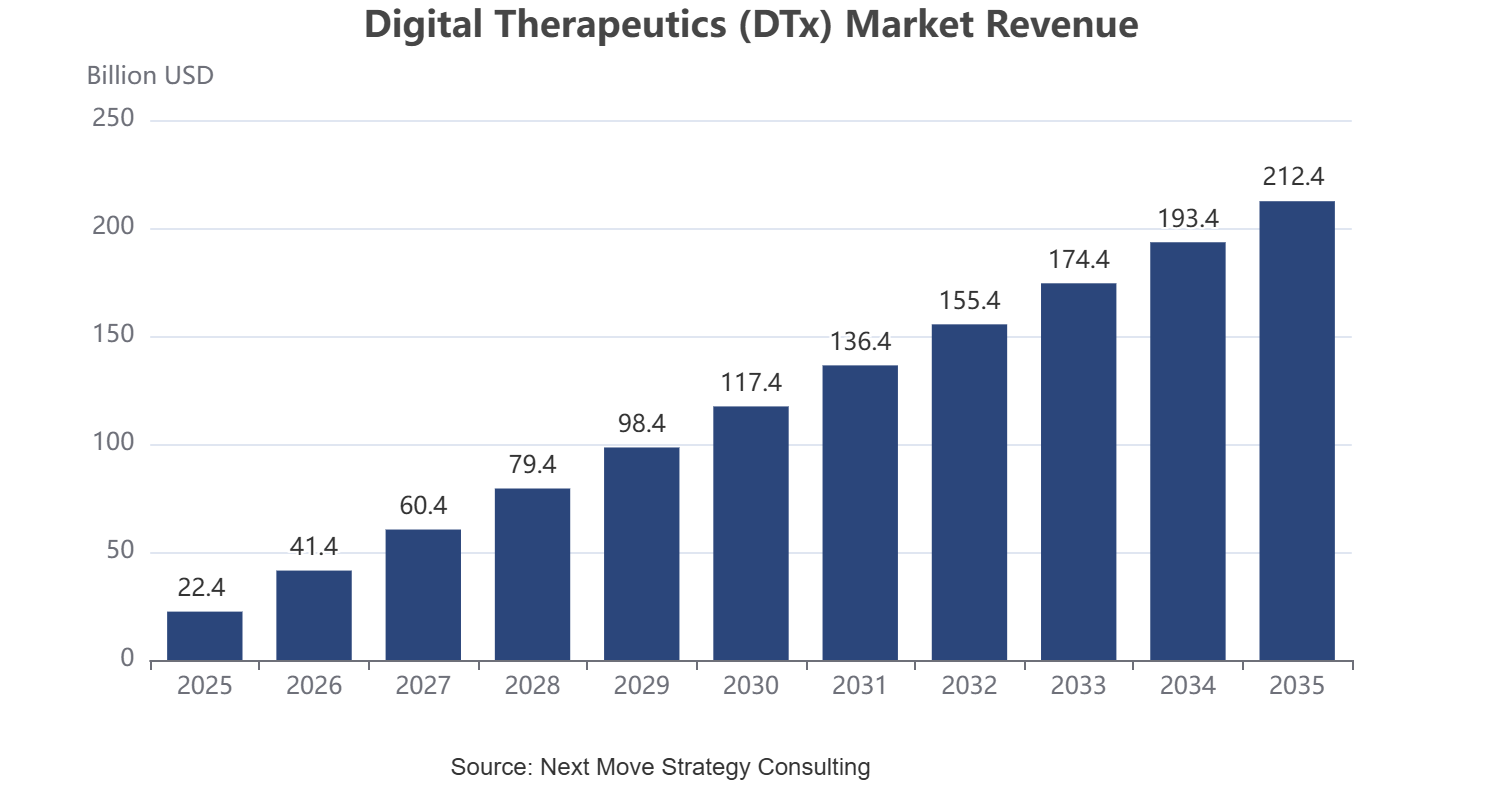
The global Digital Therapeutics Market size was valued at USD 22.4 Billion in 2025 and is estimated at USD 27.9 Billion in 2026, projected to reach USD 212.4 Billion by 2035, expanding at a CAGR of 25.3% from 2026 to 2035, with North America leading at approximately 42.0% share and Non-Prescription Digital Therapeutics dominant at approximately 62.1% share in 2025.
Next Move Strategy Consulting's analysis of the Digital Therapeutics Market highlights the following key takeaways for 2025 and 2035.
|
Key Takeaways |
|
By Regulatory Status : Non-Prescription Digital Therapeutics held the largest share of approximately 62.1% (USD 13.9 Billion) in 2025; Prescription Digital Therapeutics is the fastest-growing sub-segment at 27.1% CAGR from 2026–2035. |
|
By Clinical Function: Disease Management held the largest share of approximately 39.7% (USD 8.9 Billion) in 2025; Remote Therapeutic Monitoring is the fastest-growing sub-segment at 29.7% CAGR from 2026–2035. |
|
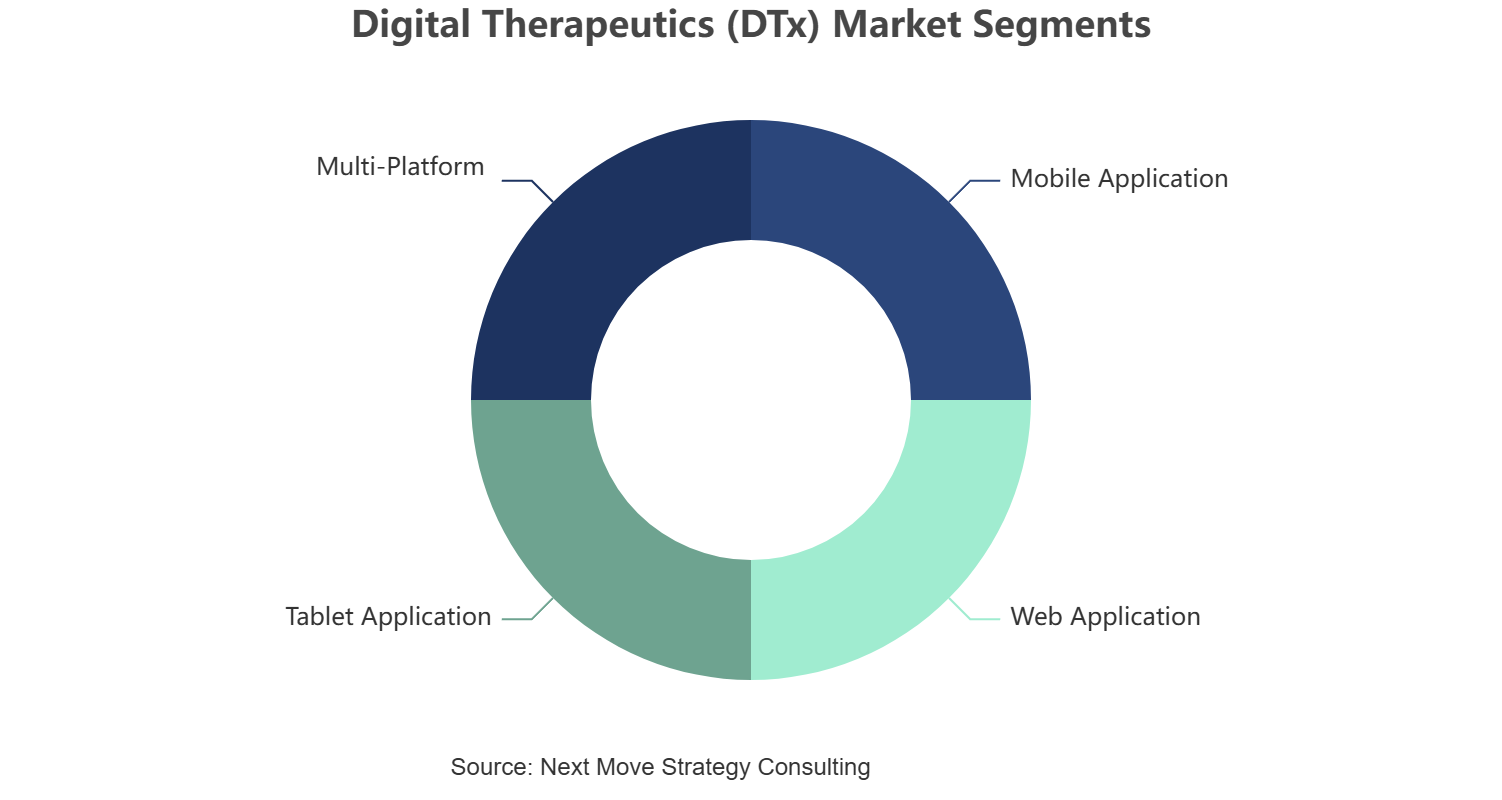
By Platform: Mobile Application held the largest share of approximately 65.2% (USD 14.6 Billion) in 2025; Multi-Platform is the fastest-growing sub-segment at 30.5% CAGR from 2026–2035. |
|
By Deployment Model: Cloud held the largest share of approximately 78.1% (USD 17.5 Billion) in 2025; Hybrid Cloud is the fastest-growing sub-segment at 29.0% CAGR from 2026–2035. |
|
By Revenue Model: Subscription held the largest share of approximately 48.2% (USD 10.8 Billion) in 2025; Value-Based Contract is the fastest-growing sub-segment at 31.4% CAGR from 2026–2035. |
|
By Customer Type: Healthcare Providers held the largest share of approximately 44.2% (USD 9.9 Billion) in 2025; Employers is the fastest-growing sub-segment at 28.3% CAGR from 2026–2035. |
|
By Distribution Channel: Digital App Stores held the largest share of approximately 36.2% (USD 8.1 Billion) in 2025; Pharmaceutical Commercial Partnerships is the fastest-growing sub-segment at 30.1% CAGR from 2026–2035. |
|
By End User: Adults held the largest share of approximately 67.9% (USD 15.2 Billion) in 2025; Geriatrics is the fastest-growing sub-segment at 27.4% CAGR from 2026–2035. |
|
Dominant Region: North America dominated with approximately 42.0% revenue share (USD 9.4 Billion) in 2025. |
|
Fastest-Growing Region: Asia-Pacific is expected to register the highest CAGR of 26.8% during 2026–2035. |
|
Dominant Country: U.S. led with approximately USD 7.6 Billion in 2025. |
|
Fastest-Growing Country: India is the fastest-growing country at approximately 28.2% CAGR from 2026–2035. |
Market Opportunity: The Digital Therapeutics Market is expected to create an absolute dollar opportunity of USD 184.5 Billion between 2026 and 2035, presenting significant investment potential across the payer, provider, employer, and pharmaceutical commercial-partnership value chain.
According to Next Move Strategy Consulting analysis, reimbursement expansion for prescription digital therapeutics in the U.S. and Germany is emerging as a decisive catalyst that is pulling forward adoption timelines across chronic disease categories.
What does the Digital Therapeutics Market Encompass?
The Digital Therapeutics Market covers software-driven interventions that deliver evidence-based therapeutic outcomes for the prevention, management, or treatment of medical conditions, spanning prescription products cleared through regulatory pathways and non-prescription consumer-facing wellness applications. We observed that the market has evolved from standalone symptom trackers into clinically validated, reimbursable interventions integrated with electronic health records and remote monitoring infrastructure.
Regulatory environments in the U.S., Germany, and the UK have introduced dedicated reimbursement and clearance pathways, which our analysis shows is accelerating provider trust and payer coverage. Technology adoption is further shaped by expanding smartphone penetration, AI-enabled personalization engines, and growing employer and payer willingness to fund digital-first behavioral and chronic disease programs, collectively broadening the addressable patient population.
|
Parameters |
Details |
|
Market Size in 2025 |
USD 22.4 Billion |
|
Market Size in 2026 |
USD 27.9 Billion |
|
Revenue Forecast in 2035 |
USD 212.4 Billion |
|
Growth Rate |
CAGR of 25.3% from 2026 to 2035 |
|
Analysis Period |
2025–2035 |
|
Base Year Considered |
2025 |
|
Forecast Period |
2026–2035 |
|
Market Size Estimation |
Revenue (USD Billion) |
|
Companies Profiled |
20 |
|
Countries Covered |
33 |
|
Market Share |
Available for Top 10 Companies |
Key Emerging Trends
Based on research conducted by Next Move Strategy Consulting, we found that the Digital Therapeutics Market is undergoing rapid transformation across four key fronts that are reshaping stakeholder engagement and clinical delivery.
How Is AI Personalization Transforming Treatment Pathways?
AI-driven personalization engines are adapting therapeutic content in real time based on patient behavior and biometric feedback, transforming static programs into adaptive care pathways. We observed that companies such as Sword Health, Inc. are deploying AI-guided motion tracking to individualize musculoskeletal rehabilitation, improving adherence and clinical outcome consistency across diverse patient populations while reducing dependence on in-person supervision.
How Is Remote Therapeutic Monitoring Expanding Provider Adoption?
Remote therapeutic monitoring reimbursement codes are prompting broader provider adoption of connected digital therapeutic platforms. Our findings suggest that health systems are integrating monitoring data streams directly into clinical workflows, exemplified by Omada Health, Inc.'s chronic condition programs, enabling proactive intervention and reducing avoidable escalations in metabolic and cardiovascular disease management.
How Are Pharmaceutical Commercial Partnerships Reshaping Distribution?
Pharmaceutical companies are entering commercial partnerships with digital therapeutics developers to bundle software interventions alongside pharmacologic treatment. We found that this model, illustrated by Click Therapeutics, Inc.'s collaborations, is opening new distribution channels through prescriber networks and strengthening treatment adherence economics for chronic and behavioral health indications.
How Is Employer-Sponsored Coverage Widening Consumer Access?
Employers are increasingly sponsoring digital therapeutic benefits as part of workforce health strategies, widening consumer access beyond clinical settings. Next Move Strategy Consulting's analysis indicates that Hinge Health, Inc.'s enterprise musculoskeletal programs demonstrate how employer channels are becoming a durable, high-volume distribution route independent of traditional payer negotiation cycles.
Regulatory Framework Impacting the Digital Therapeutics Market
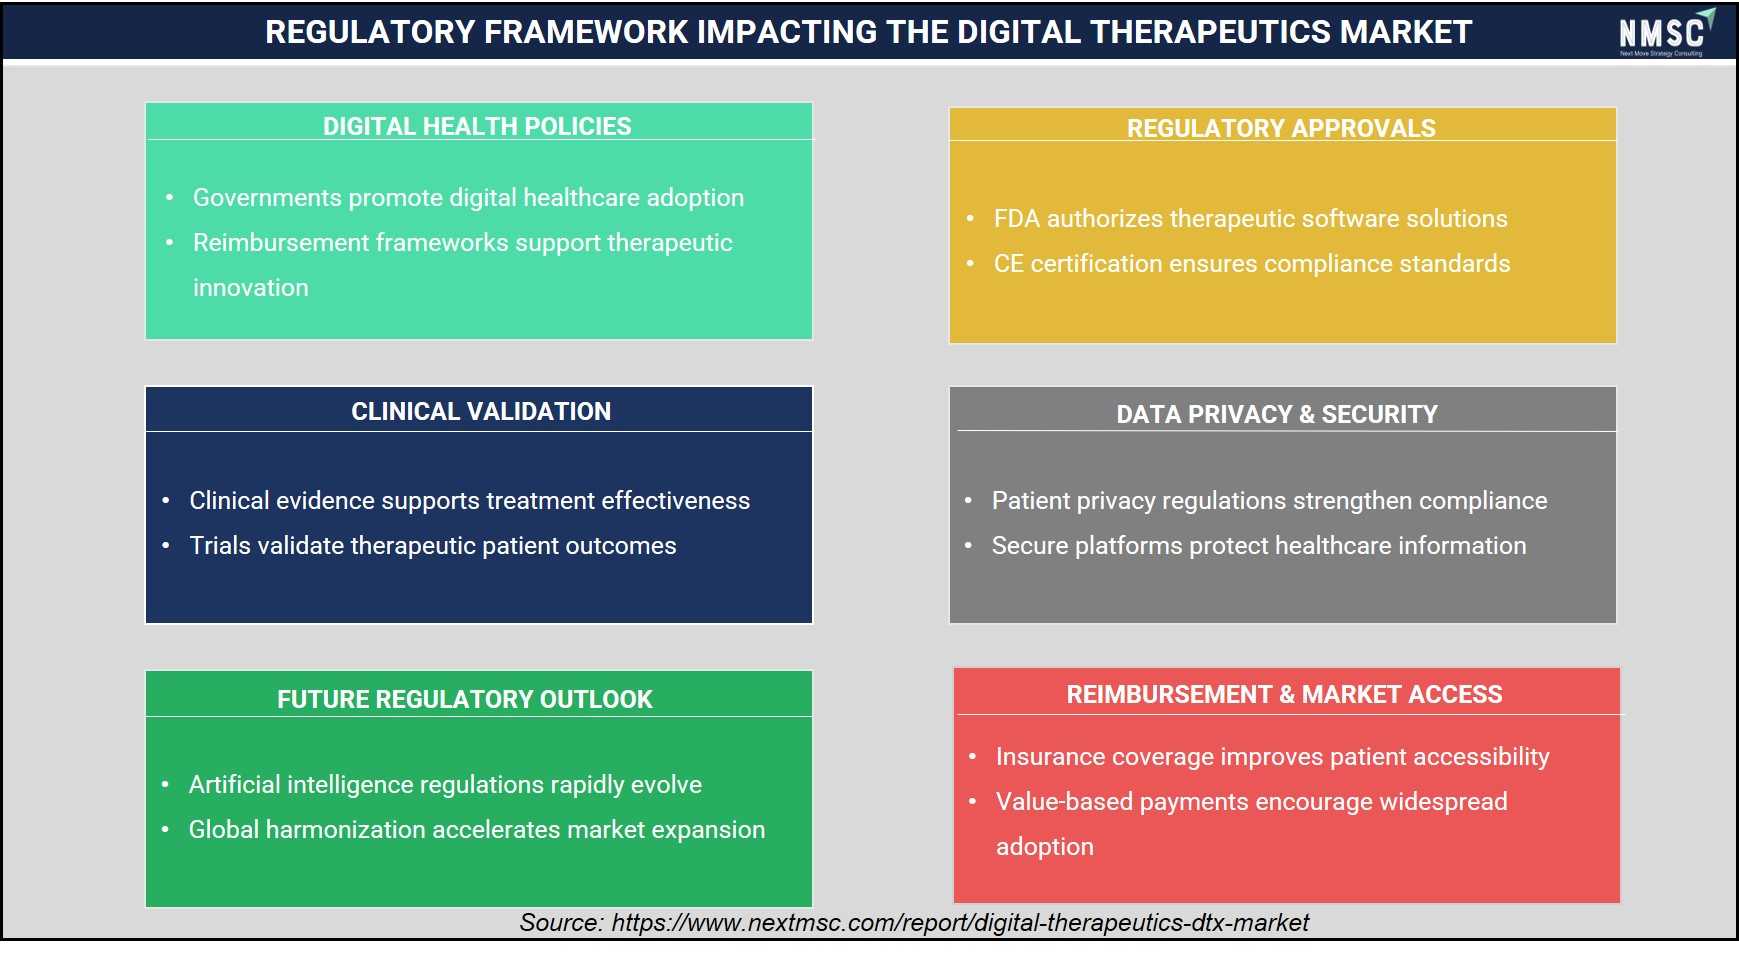
Based on our regulatory assessment, we observed that digital health policies, regulatory approvals, clinical validation, data privacy requirements, reimbursement frameworks, and evolving healthcare regulations collectively influence the digital therapeutics market. Furthermore, our market analysis indicates that supportive government initiatives, robust clinical evidence, secure patient data management, standardized certification processes, value-based reimbursement models, and global regulatory harmonization strengthen patient confidence, accelerate product approvals, improve market accessibility, and support sustainable long-term market growth.
Growth Drivers & Restraints
|
Factors |
Type |
(+/−) % Impact on CAGR |
Geographic Relevance |
Impact Timeline |
|
Reimbursement pathway expansion |
Driver |
+4.2% |
North America, Europe |
2026–2030 |
|
Rising chronic disease prevalence |
Driver |
+3.6% |
Global |
2026–2035 |
|
Smartphone and connectivity penetration |
Driver |
+3.1% |
Asia-Pacific, Latin America |
2026–2032 |
|
Pharmaceutical commercial partnerships |
Driver |
+2.4% |
North America, Europe |
2027–2033 |
|
Employer-sponsored benefit adoption |
Driver |
+2.0% |
North America |
2026–2031 |
|
Clinical validation and regulatory scrutiny |
Restraint |
−2.8% |
Global |
2026–2030 |
|
Data privacy and cybersecurity concerns |
Restraint |
−2.1% |
North America, Europe |
2026–2035 |
|
Fragmented reimbursement frameworks |
Restraint |
−1.7% |
Asia-Pacific, MEA, LATAM |
2026–2032 |
|
Patient engagement and adherence attrition |
Restraint |
−1.3% |
Global |
2026–2035 |
What is the primary growth driver?
Reimbursement pathway expansion stands as the primary growth driver, with the U.S. Centers for Medicare & Medicaid Services having established remote therapeutic monitoring billing codes that formalize payment for connected digital interventions. We observed that this framework, published on cms.gov, is directly lowering adoption friction for providers evaluating prescription digital therapeutic programs.
How is chronic disease burden driving the Digital Therapeutics Market growth?
Rising global chronic disease prevalence is driving sustained demand, with the World Health Organization reporting that noncommunicable diseases account for a majority of global deaths annually. Our assessment indicates that this burden is pushing health systems toward scalable digital interventions for diabetes, cardiovascular disease, and behavioral health that extend clinical capacity without proportional staffing increases.
What is restraining the Digital Therapeutics Market?
Clinical validation requirements and prolonged regulatory review are restraining faster market expansion, as agencies including the U.S. Food and Drug Administration require robust evidence generation before granting clearance. We found that this extends time-to-market for prescription digital therapeutics, delaying revenue realization relative to non-prescription wellness applications with lighter regulatory obligations.
Segmentation Analysis
Segment Sizing: By Regulatory Status
|
Segment |
2025 (USD) |
2035 (USD) |
CAGR% (2026–2035) |
|
Prescription Digital Therapeutics |
USD 8.5 Billion |
USD 74.3 Billion |
27.1% |
|
Non-Prescription Digital Therapeutics |
USD 13.9 Billion |
USD 138.1 Billion |
24.5% |
|
Total |
USD 22.4 Billion |
USD 212.4 Billion |
25.3% |
Which regulatory status segment leads the market?
Non-Prescription Digital Therapeutics leads the market with USD 13.9 Billion in 2025, reaching USD 138.1 Billion by 2035, supported by low-friction app-store distribution and consumer willingness to pay directly. Our analysis shows Prescription Digital Therapeutics is growing fastest at 27.1% CAGR as reimbursement pathways mature, narrowing the revenue gap between the two categories through the forecast period.
Segment Sizing: By Clinical Function
|
Segment |
2025 (USD) |
2035 (USD) |
CAGR% (2026–2035) |
|
Prevention |
USD 2.7 Billion |
USD 21.4 Billion |
23.0% |
|
Disease Management |
USD 8.9 Billion |
USD 79.9 Billion |
24.8% |
|
Cognitive Behavioral Therapy |
USD 4.3 Billion |
USD 42.7 Billion |
25.7% |
|
Rehabilitation |
USD 2.5 Billion |
USD 24.8 Billion |
25.8% |
|
Medication Adherence |
USD 1.6 Billion |
USD 14.6 Billion |
24.6% |
|
Remote Therapeutic Monitoring |
USD 1.4 Billion |
USD 18.2 Billion |
29.7% |
|
Patient Education |
USD 0.6 Billion |
USD 6.6 Billion |
27.0% |
|
Relapse Prevention |
USD 0.4 Billion |
USD 4.2 Billion |
27.6% |
|
Total |
USD 22.4 Billion |
USD 212.4 Billion |
25.3% |
Which clinical function segment is growing fastest?
Disease Management remains the dominant clinical function at USD 8.9 Billion in 2025, given its broad applicability across metabolic and cardiovascular indications. We observed that Remote Therapeutic Monitoring is the fastest-growing function at a 29.7% CAGR, propelled by new reimbursement codes that directly compensate providers for continuous patient data review outside clinical visits.
Segment Sizing: By Platform
|
Segment |
2025 (USD) |
2035 (USD) |
CAGR% (2026–2035) |
|
Mobile Application |
USD 14.6 Billion |
USD 138.0 Billion |
25.2% |
|
Web Application |
USD 3.8 Billion |
USD 28.6 Billion |
22.5% |
|
Tablet Application |
USD 1.9 Billion |
USD 14.5 Billion |
22.7% |
|
Multi-Platform |
USD 2.1 Billion |
USD 31.3 Billion |
30.5% |
|
Total |
USD 22.4 Billion |
USD 212.4 Billion |
25.3% |
Which platform format dominates deployment?
Mobile Application deployment dominates with USD 14.6 Billion in 2025, reflecting patient preference for smartphone-native, always-available therapeutic engagement. Our findings suggest Multi-Platform offerings are expanding fastest at a 30.5% CAGR as developers unify mobile, web, and tablet experiences to support both clinician dashboards and patient-facing interfaces within a single connected ecosystem.
Growth Opportunities
We identified three forward-looking whitespace opportunities that are set to shape competitive positioning through 2035.
How Can Payer-Integrated Value-Based Contracts Unlock Growth?
Value-based contracting tied to measurable clinical outcomes is opening a mechanism for payers to fund digital therapeutics without upfront budget risk, benefiting prescription-focused developers such as Welldoc, Inc. that can demonstrate outcome data tied directly to reimbursement terms.
How Can Emerging-Market Localization Expand the Addressable Base?
Localizing content, language, and regulatory positioning for Asia-Pacific and Latin American markets creates a mechanism to capture underserved patient populations, benefiting mobile-first platform providers positioned to scale through telecom and government digital-health partnerships in these regions.
How Can Pediatric and Rare-Disease Extensions Create New Revenue?
Extending validated behavioral and neurological therapeutic frameworks into pediatric and rare-disease indications creates a mechanism for incremental revenue, benefiting specialized developers such as Cognoa, Inc. that already hold clinical infrastructure adaptable to smaller, high-need patient cohorts.
Regional Outlook
|
Region |
2025 (USD) |
2035 (USD) |
CAGR% (2026–2035) |
Key Driver |
|
North America |
USD 9.4 Billion |
USD 86.0 Billion |
24.7% |
Payer reimbursement and FDA clearances |
|
Europe |
USD 6.0 Billion |
USD 55.2 Billion |
24.8% |
DiGA-style statutory reimbursement pathways |
|
Asia-Pacific |
USD 4.9 Billion |
USD 53.1 Billion |
26.8% |
Smartphone penetration and government digital-health programs |
|
Middle East & Africa |
USD 1.1 Billion |
USD 9.5 Billion |
24.1% |
National digital-health strategies and telehealth expansion |
|
Latin America |
USD 1.0 Billion |
USD 8.6 Billion |
23.9% |
Private insurer pilots and chronic-disease burden |
|
Total |
USD 22.4 Billion |
USD 212.4 Billion |
25.3% |
— |
North America Digital Therapeutics Market Outlook
North America leads the global Digital Therapeutics Market, supported by mature reimbursement frameworks and dense provider adoption of remote monitoring codes. We observed that the region's regulatory clarity from the FDA continues to attract prescription digital therapeutic launches ahead of other geographies, reinforcing its position as the largest revenue base through 2035.
Europe Digital Therapeutics Market Outlook
Europe's market benefits from statutory reimbursement pathways such as Germany's DiGA directory, which our analysis shows is accelerating prescription digital therapeutic uptake across public health systems. Regulatory harmonization efforts across the region are expected to support steady adoption through the forecast period.
Asia-Pacific Digital Therapeutics Market Outlook
Asia-Pacific is the fastest-growing region, driven by expanding smartphone penetration and government-backed digital health initiatives. We found that rising chronic disease burden across China and India is creating substantial addressable demand for scalable, mobile-first therapeutic interventions.
Middle East & Africa Digital Therapeutics Market Outlook
Middle East & Africa is an emerging digital therapeutics region, with national digital-health strategies in the Gulf states supporting early-stage adoption. Our assessment indicates that telehealth infrastructure expansion is a prerequisite enabling broader digital therapeutic rollout across the region.
Latin America Digital Therapeutics Market Outlook
Latin America shows steady growth as private insurers pilot digital therapeutic coverage for chronic disease management. We observed that Brazil's expanding private health insurance base is the primary near-term growth engine for regional adoption.
U.S. Digital Therapeutics Market
Based on our estimates, the U.S. market reached approximately USD 7.6 Billion in 2025 and is projected to reach USD 68.5 Billion by 2035, growing at a CAGR of 24.6% from 2026 to 2035, as the U.S. benefits from CMS remote therapeutic monitoring reimbursement codes and dense payer coverage, driving strong provider-side demand structure and high technology penetration.
Canada Digital Therapeutics Market
The Canada market reached approximately USD 1.1 Billion in 2025 and is projected to reach USD 10.0 Billion by 2035, growing at a CAGR of 24.7% from 2026 to 2035, as Canada shows growing provincial health-system pilots for digital therapeutics, with moderate technology penetration and expanding private insurer coverage supporting steady adoption.
UK Digital Therapeutics Market
As per our estimate, the UK market reached approximately USD 1.6 Billion in 2025 and is projected to reach USD 14.5 Billion by 2035, growing at a CAGR of 24.6% from 2026 to 2035, as the UK's NHS digital health pathways are supporting structured evaluation and rollout of clinically validated digital therapeutic programs across primary care networks.
Germany Digital Therapeutics Market
According to our analysis, the Germany market reached approximately USD 1.4 Billion in 2025 and is projected to reach USD 12.8 Billion by 2035, growing at a CAGR of 24.7% from 2026 to 2035, as Germany's DiGA reimbursement pathway provides the clearest regulatory route to payer coverage in Europe, driving above-average prescription digital therapeutic adoption.
France Digital Therapeutics Market
Based on our estimates, the France market reached approximately USD 1.0 Billion in 2025 and is projected to reach USD 9.0 Billion by 2035, growing at a CAGR of 24.5% from 2026 to 2035, as France's evolving digital health reimbursement framework is gradually widening payer coverage, with moderate competitive intensity among prescription and non-prescription developers.
China Digital Therapeutics Market
The China market reached approximately USD 1.5 Billion in 2025 and is projected to reach USD 15.5 Billion by 2035, growing at a CAGR of 26.3% from 2026 to 2035, as China's demand structure is shaped by large-scale chronic disease prevalence and expanding government digital-health platforms supporting broader technology penetration.
India Digital Therapeutics Market
As per our estimate, the India market reached approximately USD 0.9 Billion in 2025 and is projected to reach USD 11.0 Billion by 2035, growing at a CAGR of 28.2% from 2026 to 2035, as India shows the fastest regional growth trajectory, driven by rapidly expanding smartphone-based healthcare access and rising private insurer interest in digital chronic disease management.
Japan Digital Therapeutics Market
According to our analysis, the Japan market reached approximately USD 1.0 Billion in 2025 and is projected to reach USD 9.5 Billion by 2035, growing at a CAGR of 25.2% from 2026 to 2035, as Japan's aging population and structured regulatory pathway for medical software are supporting steady adoption of rehabilitation and chronic disease digital therapeutics.
South Korea Digital Therapeutics Market
Based on our estimates, the South Korea market reached approximately USD 0.5 Billion in 2025 and is projected to reach USD 5.0 Billion by 2035, growing at a CAGR of 25.5% from 2026 to 2035, as South Korea's advanced digital infrastructure and government digital-health pilot programs are supporting above-average technology penetration for prescription digital therapeutics.
Australia Digital Therapeutics Market
The Australia market reached approximately USD 0.4 Billion in 2025 and is projected to reach USD 4.2 Billion by 2035, growing at a CAGR of 25.9% from 2026 to 2035, as Australia's healthcare system is showing growing private insurer and government pilot support for digital therapeutic coverage across behavioral and metabolic indications.
UAE Digital Therapeutics Market
As per our estimate, the UAE market reached approximately USD 0.3 Billion in 2025 and is projected to reach USD 2.9 Billion by 2035, growing at a CAGR of 23.5% from 2026 to 2035, as the UAE's national digital-health strategy and telehealth infrastructure investment are supporting early but accelerating adoption of digital therapeutic platforms.
Saudi Arabia Digital Therapeutics Market
According to our analysis, the Saudi Arabia market reached approximately USD 0.3 Billion in 2025 and is projected to reach USD 2.5 Billion by 2035, growing at a CAGR of 23.6% from 2026 to 2035, as Saudi Arabia's Vision 2030 digital-health initiatives are supporting government-backed pilot programs for chronic disease digital therapeutic management.
South Africa Digital Therapeutics Market
Based on our estimates, the South Africa market reached approximately USD 0.1 Billion in 2025 and is projected to reach USD 1.3 Billion by 2035, growing at a CAGR of 24.0% from 2026 to 2035, as South Africa shows emerging adoption concentrated in private healthcare networks, with technology penetration constrained by broader connectivity infrastructure gaps.
Brazil Digital Therapeutics Market
The Brazil market reached approximately USD 0.5 Billion in 2025 and is projected to reach USD 4.3 Billion by 2035, growing at a CAGR of 23.9% from 2026 to 2035, as Brazil's expanding private health insurance base is the primary demand driver, with growing competitive intensity among regional and international digital therapeutic developers.
Argentina Digital Therapeutics Market
As per our estimate, the Argentina market reached approximately USD 0.1 Billion in 2025 and is projected to reach USD 1.3 Billion by 2035, growing at a CAGR of 24.1% from 2026 to 2035, as Argentina shows early-stage adoption concentrated in urban private healthcare networks, with regulatory frameworks still developing relative to regional peers.
Porter’s Five Forces Analysis of the Digital Therapeutics Market
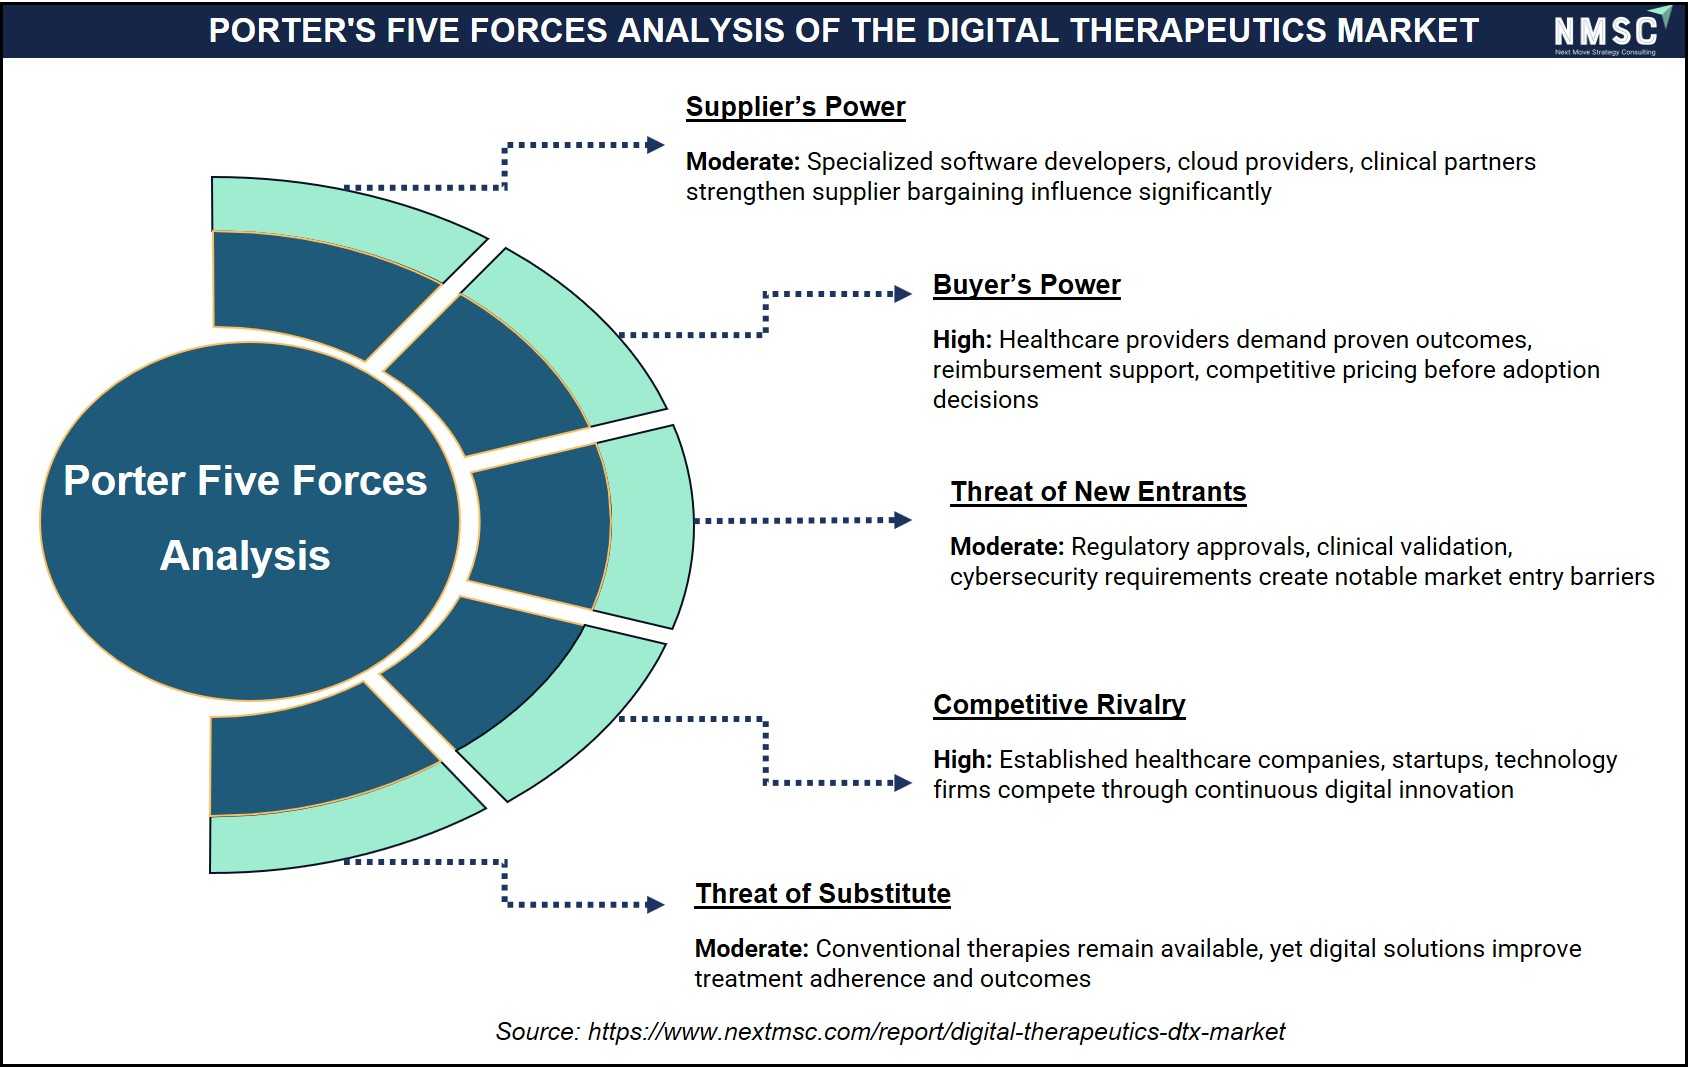
Based on our competitive assessment, we identified that supplier bargaining power, buyer bargaining power, competitive rivalry, the threat of substitutes, and the threat of new entrants collectively shape the digital therapeutics market. Moreover, our industry evaluation highlights that technology innovation, healthcare provider adoption, regulatory compliance requirements, reimbursement policies, clinical validation standards, and increasing digital health investments influence competitive intensity, strengthen market differentiation, encourage continuous innovation, and support sustainable market expansion.
Competitive Landscape
We observed that the Digital Therapeutics Market retains a moderately fragmented structure, with clinical validation and reimbursement relationships serving as the primary axes of differentiation among competitors.
|
Dimension |
Assessment |
|
Market Structure |
Moderately fragmented with therapeutic-area specialists competing alongside diversified digital health platforms |
|
Innovation Focus |
AI-driven personalization, remote monitoring integration, and clinical evidence generation |
|
M&A Activity |
Selective acquisitions targeting therapeutic-area expansion and payer channel access |
How do companies compete in the Digital Therapeutics Market?
Companies compete primarily on clinical evidence strength, reimbursement coverage breadth, and provider integration depth rather than price alone. Our analysis shows that developers with published outcome studies and payer contracts, such as Omada Health, Inc., command stronger enterprise and health-system relationships than newer entrants lacking comparable validation.
Which competitive archetypes dominate the industry?
Two archetypes dominate: clinically validated prescription specialists targeting narrow indications with regulatory clearance, and consumer-scale wellness platforms prioritizing engagement and distribution breadth. We found that Teladoc Health, Inc. represents an integrated telehealth-plus-therapeutics model bridging both archetypes through combined virtual care delivery.
What innovation and differentiation strategies are companies pursuing?
Companies are differentiating through proprietary AI algorithms, wearable sensor integration, and multi-condition platform expansion. Next Move Strategy Consulting's analysis indicates that MindMaze SA is investing in neurotechnology-enabled rehabilitation, while Sidekick Health ehf. is pursuing modular condition libraries to serve multiple therapeutic areas from shared infrastructure.
What M&A activity is shaping the competitive landscape?
M&A activity is concentrated on acquiring therapeutic-area expertise and payer network access rather than horizontal scale alone. We observed selective consolidation among mid-sized developers seeking clinical validation shortcuts and established players such as DarioHealth Corp. expanding chronic condition portfolios through targeted acquisitions of complementary monitoring technologies.
Key Market Players
We identified the following twenty companies as the leading participants shaping the competitive trajectory of the Digital Therapeutics Market.
-
Teladoc Health, Inc.
-
Sword Health, Inc.
-
DarioHealth Corp.
-
Click Therapeutics, Inc.
-
Big Health Ltd.
-
Sidekick Health ehf.
-
Kaia Health Software GmbH
-
Welldoc, Inc.
-
Orexo AB
-
Mahana Therapeutics, Inc.
-
MindMaze SA
-
CureApp, Inc.
-
GAIA AG
-
Cognoa, Inc.
-
MedRhythms, Inc.
-
BehaVR, Inc.
-
JOGO Health Inc.
-
Liva Healthcare A/S
Latest Developments
Our assessment indicates that recent developments across the Digital Therapeutics Market reflect intensifying reimbursement, partnership, and clinical validation activity.
|
Date |
Event |
|
July 2026 |
Teladoc Health announced the introduction of Teladoc One, a fundamentally new model of virtual care designed to replace fragmented point solutions with a single, predictive, and adaptive experience. Powered by its Pulse intelligence engine, the platform unifies clinical history, claims, pharmacy, and device data to help multidisciplinary care teams coordinate comprehensive care across virtual settings. |
|
June 2026 |
Sword Health announced a partnership with Portugal's National Health Service (NHS) to make its AI-powered musculoskeletal (MSK) digital therapy solution available to more than 10 million people, expanding access to home-based digital therapeutics and reducing pressure on the public healthcare system. |
|
June 2026 |
Hinge Health expanded HingeSelect to include orthopedic surgery, creating an integrated digital care pathway that combines AI-powered digital therapy with specialist evaluation, prehabilitation, surgery, and post-operative rehabilitation for musculoskeletal conditions. |
Expert Insights
 "Digital therapeutics are revolutionizing healthcare by offering treatments that are more accessible and unbiased, catering to a wide range of patients. The efficient use of digital platforms for recruitment and engagement is a testament to this evolution."
— Joel Morse, CEO & Co-founder, Curavit
Statement made during an interview with Clinical Trial Vanguard discussing the growing role of digital therapeutics in expanding patient access and transforming clinical research.
Market Interpretation
The statement highlights the growing role of digital therapeutics in improving healthcare accessibility and scalability through evidence-based software interventions. By leveraging digital platforms for patient recruitment, engagement, and treatment delivery, digital therapeutics are enabling more inclusive clinical research and expanding access to personalized care. As healthcare systems increasingly adopt digital-first treatment models, advancements in digital therapeutics are expected to accelerate market growth by improving patient outcomes, reducing barriers to care, and supporting the integration of software-based therapies into routine clinical practice.
Investment Opportunities
How Are Capital Inflows Shaping the Market?
Venture and growth capital continue flowing toward developers with demonstrated clinical outcomes and payer contracts. We observed that funding is increasingly conditioned on published evidence rather than user-growth metrics alone, favoring prescription-focused developers over early-stage consumer wellness entrants.
Where Is Infrastructure Investment Concentrated?
Infrastructure investment is concentrated in interoperability tooling that connects digital therapeutic platforms with electronic health record systems and remote monitoring devices. Our analysis shows this integration layer is becoming a prerequisite for enterprise health-system contracts rather than an optional enhancement.
What ESG Considerations Are Relevant to Investors?
Environmental, Social, and Governance considerations center on equitable access, given that smartphone-dependent delivery can exclude lower-connectivity populations. Our assessment indicates that investors are increasingly evaluating developers' data governance practices and health-equity commitments alongside standard financial and clinical due diligence criteria.
Key Benefits for Stakeholders
How Does This Report Benefit Healthcare Industry Leaders?
Healthcare industry leaders gain segmented revenue forecasts and regional adoption analysis that support prioritization of therapeutic-area investment and health-system partnership strategy across the 2026–2035 forecast window.
How Does This Report Benefit Investors and Financial Analysts?
Investors and financial analysts gain company-level competitive positioning and growth-driver quantification that inform capital allocation decisions across prescription and non-prescription digital therapeutic segments with differentiated growth trajectories.
How Does This Report Benefit Technology Vendors and Product Teams?
Technology vendors and product teams gain platform and clinical-function segmentation data that clarify where mobile, multi-platform, and remote monitoring investment is most likely to generate durable competitive advantage through 2035.
Key Market Segments
By Therapeutic Area and Regulatory Status
-
Prescription Digital Therapeutics
-
Mental Health
-
Depression
-
Anxiety
-
Post-Traumatic Stress Disorder
-
Attention Deficit Hyperactivity Disorder
-
Bipolar Disorder
-
Schizophrenia
-
Other Mental Health
-
-
Substance Use Disorders
-
Opioid Use Disorder
-
Alcohol Use Disorder
-
Smoking Cessation
-
Other Substance Use Disorders
-
-
Metabolic Disorders
-
Type 2 Diabetes
-
Prediabetes
-
Obesity
-
Other Metabolic Disorders
-
-
Cardiovascular Disorders
-
Hypertension
-
Heart Failure
-
Other Cardiovascular Disorders
-
-
Respiratory Disorders
-
Asthma
-
Chronic Obstructive Pulmonary Disease
-
Other Respiratory Disorders
-
-
Neurological Disorders
-
Migraine
-
Parkinson's Disease
-
Multiple Sclerosis
-
Stroke Rehabilitation
-
Other Neurological Disorders
-
-
Musculoskeletal Disorders
-
Chronic Low Back Pain
-
Knee Osteoarthritis
-
Other Musculoskeletal Disorders
-
-
Gastrointestinal Disorders
-
Irritable Bowel Syndrome
-
Inflammatory Bowel Disease
-
Other Gastrointestinal Disorders
-
-
Sleep Disorders
-
Insomnia
-
Nightmare Disorder
-
Other Sleep Disorders
-
-
Oncology Support
-
Symptom Management
-
Treatment Adherence
-
-
Women's Health
-
Menopause
-
Pelvic Health
-
Other Women's Health
-
-
Pediatric Disorders
-
Autism Spectrum Disorder
-
Other Pediatric Disorders
-
-
Other Therapeutic Areas
-
Dermatology
-
Urology
-
Rare Diseases
-
Other Prescription Therapeutic Areas
-
-
-
Non-Prescription Digital Therapeutics
-
Mental Health
-
Depression
-
Anxiety
-
Stress Disorders
-
Other Mental Health
-
-
Metabolic Disorders
-
Diabetes Prevention
-
Diabetes Self-Management
-
Obesity
-
Other Metabolic Disorders
-
-
Cardiovascular Disorders
-
Hypertension
-
Cardiometabolic Risk Reduction
-
Other Cardiovascular Disorders
-
-
Respiratory Disorders
-
Asthma
-
Chronic Obstructive Pulmonary Disease
-
Other Respiratory Disorders
-
-
Neurological Disorders
-
Cognitive Training
-
Neurorehabilitation
-
Other Neurological Disorders
-
-
Musculoskeletal Disorders
-
Back Pain
-
Osteoarthritis
-
Physical Rehabilitation
-
Other Musculoskeletal Disorders
-
-
Gastrointestinal Disorders
-
Irritable Bowel Syndrome
-
Other Gastrointestinal Disorders
-
-
Sleep Disorders
-
Insomnia
-
Other Sleep Disorders
-
-
Women's Health
-
Fertility
-
Pregnancy
-
Pelvic Health
-
Other Women's Health
-
-
Preventive Care
-
Lifestyle Modification
-
Cardiometabolic Risk Reduction
-
Other Preventive Care
-
-
Other Therapeutic Areas
-
Dermatology
-
Urology
-
Rare Diseases
-
Other Non-Prescription Therapeutic Areas
-
-
By Clinical Function
-
Prevention
-
Disease Management
-
Cognitive Behavioral Therapy
-
Rehabilitation
-
Medication Adherence
-
Remote Therapeutic Monitoring
-
Patient Education
-
Relapse Prevention
By Platform
-
Mobile Application
-
Web Application
-
Tablet Application
-
Multi-Platform
By Deployment Model
-
Cloud
-
Public Cloud
-
Private Cloud
-
Hybrid Cloud
-
-
On-Premise
By Revenue Model
-
Subscription
-
Enterprise License
-
Per Patient Episode
-
Value-Based Contract
-
Pharmaceutical Commercial Partnerships
By Customer Type
-
Healthcare Providers
-
Hospitals
-
Clinics
-
Physician Groups
-
Rehabilitation Centers
-
-
Healthcare Payers
-
Public Payers
-
Private Payers
-
-
Employers
-
Large Enterprises
-
Small and Medium Enterprises
-
-
Pharmaceutical Companies
-
Government Organizations
-
Individual Consumers
By Distribution Channel
-
Direct Sales
-
Healthcare Provider Network
-
Health Insurance Network
-
Employer Benefits Programs
-
Pharmacy Network
-
Digital App Stores
-
Pharmaceutical Commercial Partnerships
By End User
-
Adults
-
Pediatrics
-
Geriatrics
By Region
-
North America: U.S., Canada, Mexico
-
Europe: UK, Germany, France, Italy, Spain, Sweden, Denmark, Finland, Netherlands, Rest of Europe
-
Asia-Pacific: China, India, Japan, South Korea, Taiwan, Indonesia, Vietnam, Australia, Philippines, Malaysia
-
Middle East & Africa: Saudi Arabia, UAE, Egypt, Israel, Turkey, Nigeria, South Africa, Rest of MEA
-
Latin America: Brazil, Argentina, Chile, Colombia, Rest of LATAM
Conclusion & Recommendations
What Is the Long-Term Outlook for the Digital Therapeutics Market?
The long-term outlook remains strongly positive, with the market projected to grow from USD 27.9 Billion in 2026 to USD 212.4 Billion by 2035. We observed that reimbursement maturity and AI-driven personalization are expected to sustain double-digit growth well beyond the current forecast horizon.
What Strategic Positioning Do We Recommend?
We recommend that developers prioritize clinical evidence generation and payer relationship building ahead of pure user-acquisition strategies. Our assessment indicates that companies positioning around reimbursable, outcome-validated programs will capture disproportionate value as prescription pathways mature globally.
How Attractive Is the Market for Investment?
Investment attractiveness is high, supported by a 25.3% CAGR and expanding reimbursement infrastructure across North America and Europe. Our findings suggest that Asia-Pacific presents the strongest incremental opportunity given its 26.8% regional CAGR and underpenetrated chronic disease population.
What Market Shifts and Key Risks Should Stakeholders Monitor?
Stakeholders should monitor regulatory tightening around clinical validation requirements and data privacy enforcement, which our analysis shows could extend time-to-market for new entrants. Consolidation risk among mid-sized developers lacking differentiated clinical evidence also warrants ongoing monitoring.
What Are the Primary Growth Pathways Through 2035?
Primary growth pathways include payer-integrated value-based contracting, emerging-market localization, and pediatric or rare-disease indication expansion. We found that companies combining these pathways with strong clinical evidence are best positioned to sustain leadership through the 2035 forecast horizon.
About the Author
 Saista Faiyaz
— Saista Faiyaz is Research Associate at Next Move Strategy Consulting, where she has covered consumer markets and healthcare technologies for 3 years. Her work includes primary interview review, secondary-source validation, market sizing, and structured analysis of company and industry data. She supports research by comparing evidence across sources, organizing findings into market narratives, and documenting assumptions used in analysis. Her scope includes cross-market benchmarking, and reports.
Saista Faiyaz
— Saista Faiyaz is Research Associate at Next Move Strategy Consulting, where she has covered consumer markets and healthcare technologies for 3 years. Her work includes primary interview review, secondary-source validation, market sizing, and structured analysis of company and industry data. She supports research by comparing evidence across sources, organizing findings into market narratives, and documenting assumptions used in analysis. Her scope includes cross-market benchmarking, and reports.
About the Reviewer
 Supradip Baul
— Supradip Baul is an accomplished business consultant and strategist with over a decade of rich experience in market intelligence, strategy, technology, and business transformation. His work has included rigorous qualitative and quantitative analysis across multiple industries, helping clients shape investment decisions and long-term roadmaps. Earlier in his career, he was associated with Gartner, where he contributed to industry-leading reports and market share analyses. He has worked with leading global companies and holds an MBA with a dual specialization in Marketing and Finance.
Supradip Baul
— Supradip Baul is an accomplished business consultant and strategist with over a decade of rich experience in market intelligence, strategy, technology, and business transformation. His work has included rigorous qualitative and quantitative analysis across multiple industries, helping clients shape investment decisions and long-term roadmaps. Earlier in his career, he was associated with Gartner, where he contributed to industry-leading reports and market share analyses. He has worked with leading global companies and holds an MBA with a dual specialization in Marketing and Finance.
At Next Move Strategy Consulting, we understand that insightful market research is the cornerstone of successful business decisions. That's why we employ a robust and multifaceted approach, combining various methodologies to deliver the most accurate and actionable data for our clients.

Research Landscape
We navigate the world of research with two primary approaches:
Qualitative Approach
Our qualitative research methodologies involve immersive techniques such as in-depth interviews, focus groups, and observational studies. By engaging directly with individuals and stakeholders, we uncover valuable insights that quantitative data alone may overlook.

Quantitative Research
In tandem with qualitative methodologies, NMSC leverages the power of Quantitative Research to provide a robust foundation of numerical insights. Through systematic data collection and analysis, we quantify patterns, preferences, and market trends, offering a comprehensive view of the business landscape.
Our quantitative research approach employs diverse tools, including surveys, experiments, and statistical modelling. These methodologies enable us to gather data from a large and representative sample, ensuring the statistical significance of our findings. By employing structured questionnaires and standardized data collection methods, we guarantee the reliability and validity of the information we present to our clients.
Quantitative research is particularly effective in measuring the prevalence of trends, assessing market size, and gauging the impact of various factors on consumer behavior. The numerical precision attained through this approach equips our clients with actionable insights, facilitating data-driven decision-making and strategy formulation.


Our Specialized Toolbox for Industry-Specific Market Research
We deploy a specialized arsenal of techniques tailored to meet your unique requirements. Here's a glimpse into our comprehensive toolbox:

Information Procurement
The stage entails acquiring market data or relevant information through various sources and methodologies.


Market Research Approach
We utilize both top-down and bottom-up approaches in market research analysis to achieve a comprehensive understanding of the market dynamics, leveraging the broad perspective of industry trends and macroeconomic factors alongside detailed insights from specific segments and individual companies.

Porters Five Forces Analysis
We conduct Porter's Five Forces analysis to evaluate the competitive landscape of an industry, providing us with insights into factors that affect profitability and strategic positioning.

SWOT Analysis

Forecasting
We utilize a forecasting model to predict future consumption by considering parameters like population, economics, regulations, market competition, drivers, constraints, technology, and pricing. We also employ statistical techniques such as multilinear regression, exponential smoothing, moving average, ARIMA, and Monte Carlo simulations for accurate predictions. In econometric forecasting, we analyzed short-term and long-term event impacts, attributing values based on regulatory frameworks, economic factors, and market events.





 Speak to Our Analyst