FinOps Market Size, Share, Trends and Growth Analysis, By Offering (Cloud Provider Native Tools, Third-Party FinOps Software, and FinOps Services), By Cloud Deployment (SaaS, Self-Hosted, and Hybrid), By Spend Scope (IaaS and PaaS, Kubernetes, AI and GPU, SaaS, Data Platforms, Marketplace and Licensing, and Other Usage-Based Spend), By Buyer Persona, By Sales Channel, By Customer Size, By End-User Industry, and Region – Global Industry Report and Forecast, 2026–2035
Industry: ICT & Media | Publishing Date: July 16, 2026 | Last Updated: September 10, 2026 | No of Pages: N/A | No. of Tables: N/A | No. of Figures: N/A | Format: PDF | Report Code: IC4706
What Is the FinOps Market Size?
The global FinOps market size was valued at USD 15.1 billion in 2025 and is estimated at USD 16.8 billion in 2026, forecast to reach USD 43.0 billion by 2035, expanding at an 11.0% CAGR between 2026 and 2035. North America leads with approximately 44% share, while SaaS-delivered platforms dominate cloud deployment with approximately 68% share.
We observed that growth is broad-based across every segmentation axis, with AI and GPU spend analytics and platform engineering buyer engagement driving the sharpest structural shifts through 2035.
|
Key Takeaways |
|
By Cloud Provider Native Tools: AWS Cloud Financial Management held the largest share of approximately 36% (USD 5.44 billion) in 2025; Google Cloud Cost Management is the fastest-growing sub-segment at 13.8% CAGR from 2026–2035. |
|
By Third-Party FinOps Software: Cost Visibility and Allocation held the largest share of approximately 41% (USD 6.19 billion) in 2025; AI and GPU Spend Analytics is the fastest-growing sub-segment at 18.5% CAGR from 2026–2035. |
|
By FinOps Services: Managed FinOps Operations held the largest share of approximately 37% (USD 5.59 billion) in 2025; Training and Certification is the fastest-growing sub-segment at 14.2% CAGR from 2026–2035. |
|
By Cloud Deployment: SaaS held the largest share of approximately 68% (USD 10.27 billion) in 2025; Hybrid is the fastest-growing sub-segment at 13.3% CAGR from 2026–2035. |
|
By Spend Scope: IaaS and PaaS held the largest share of approximately 34% (USD 5.13 billion) in 2025; AI and GPU is the fastest-growing sub-segment at 17.0% CAGR from 2026–2035. |
|
By Buyer Persona: Engineering held the largest share of approximately 31% (USD 4.68 billion) in 2025; Platform Engineering is the fastest-growing sub-segment at 13.3% CAGR from 2026–2035. |
|
By Sales Channel: Direct Sales held the largest share of approximately 46% (USD 6.95 billion) in 2025; Cloud Marketplace is the fastest-growing sub-segment at 15.8% CAGR from 2026–2035. |
|
By Customer Size: Large Enterprise held the largest share of approximately 58% (USD 8.76 billion) in 2025; Mid-Market is the fastest-growing sub-segment at 12.6% CAGR from 2026–2035. |
|
By End-User Industry: Software and Internet held the largest share of approximately 34% (USD 5.13 billion) in 2025; Banking and Finance is the fastest-growing sub-segment at 12.9% CAGR from 2026–2035. |
|
Dominant Region: North America dominated with approximately 44% revenue share (USD 6.64 billion) in 2025. |
|
Fastest-Growing Region: Asia-Pacific is expected to register the highest CAGR of 14.3% during 2026–2035. |
|
Dominant Country: U.S. led with approximately USD 5.51 billion in 2025. |
|
Fastest-Growing Country: India is the fastest-growing country at approximately 16.9% CAGR from 2026–2035. |
Market Opportunity: The FinOps market is expected to create an absolute dollar opportunity of USD 26.2 billion between 2026 and 2035, presenting significant investment potential across AI cost governance, Kubernetes optimization, and SaaS spend management platforms.
According to Next Move Strategy Consulting analysis, enterprises are increasingly consolidating point-solution FinOps tools into unified platforms that span cloud, Kubernetes, SaaS, and AI spend, a shift that favors vendors with broad allocation and automation coverage over single-scope specialists as technology budgets face intensifying executive scrutiny through 2035.
What Does the FinOps Market Encompass?
The market encompasses software platforms, native cloud provider tools, and advisory and managed services that bring financial accountability to variable, consumption-based technology spending. Our assessment indicates that the scope spans cost visibility and allocation, optimization automation, Kubernetes cost management, shift-left cost controls, AI and GPU spend analytics, and SaaS spend management, supplied to finance, engineering, platform engineering, and procurement stakeholders across public cloud, private cloud, data center, and SaaS environments.
The category has evolved from a narrow cloud cost-reporting function into a technology-wide financial discipline. We observed that the FinOps Foundation formally updated its mission in 2026 from advancing the people who manage the value of cloud to advancing the people who manage the value of technology, reflecting how practices now cover SaaS, software licensing, private cloud, and data center spend alongside public cloud. Next Move Strategy Consulting's analysis indicates that this scope expansion, combined with the emergence of AI and token-cost governance as a distinct discipline, is redefining vendor selection criteria across the market.
Regulatory and standards frameworks shape data portability and cost-reporting consistency across the industry. The FinOps Open Cost and Usage Specification, maintained under the Linux Foundation, provides a vendor-neutral schema for normalizing billing data across cloud, SaaS, and AI providers, while the newly announced Tokenomics Foundation is building open standards specifically for AI and token-based cost management. Our findings suggest that technology adoption is shifting toward agentic automation, with vendors embedding autonomous detection, investigation, and remediation workflows directly into FinOps platforms rather than limiting tools to dashboards and recommendations.
|
Field |
Details |
|
Market Size in 2025 |
USD 15.1 Billion |
|
Market Size in 2026 |
USD 16.8 Billion |
|
Revenue Forecast in 2035 |
USD 43.0 Billion |
|
Growth Rate |
CAGR of 11.0% from 2026 to 2035 |
|
Analysis Period |
2025–2035 |
|
Base Year Considered |
2025 |
|
Forecast Period |
2026–2035 |
|
Market Size Estimation |
Revenue (USD Billion) |
|
Companies Profiled |
20 |
|
Countries Covered |
33 |
|
Market Share |
Available for Top 10 Companies |
Key Emerging Trends
Based on research conducted by Next Move Strategy Consulting, we found that four structural trends are reshaping tooling, buyer engagement, and stakeholder collaboration across the industry.
How Is AI and GPU Spend Reshaping FinOps Priorities?
AI cost management has moved from a niche concern to the top forward-looking priority for FinOps practitioners within a two-year span. We observed that the share of practitioners actively managing AI spend rose from 31% in 2024 to 63% in 2025 and reached 98% in 2026, according to FinOps Foundation survey data. Vendors including CloudZero and Harness launched dedicated AI and token-level cost attribution capabilities in late 2025 and mid-2026, connecting AI spend to unit-level business outcomes such as cost per resolved ticket or completed workflow.
Why Is Agentic Automation Becoming Central to Cost Optimization?
Autonomous, agent-driven optimization is replacing static, recommendation-only tooling across Kubernetes and multi-cloud environments. Our findings suggest that platforms are shifting from periodic rightsizing recommendations toward continuous, closed-loop automation that detects waste, investigates root cause, and remediates without manual intervention. CAST AI's January 2026 OMNI Compute launch, which automatically discovers and allocates compute capacity across cloud providers, exemplifies this shift toward autonomous infrastructure economics.
How Is FOCUS Standardization Enabling Multi-Domain Cost Visibility?
The FinOps Open Cost and Usage Specification is emerging as the common data layer that lets organizations normalize billing data across cloud, SaaS, and AI providers within a single reporting model. We observed that FOCUS adoption is accelerating as more providers and platforms support the specification, giving practitioners the consistent data foundation needed to apply FinOps discipline consistently as spend scope expands beyond public cloud into licensing, data platforms, and AI services.
Why Is FinOps Governance Shifting from Finance to Engineering Leadership?
FinOps practices are increasingly anchored within CTO and CIO organizations rather than finance functions, reflecting the discipline's evolution into a technology-architecture concern. We found that 78% of FinOps practices now report into the CTO or CIO organization, up 18 percentage points from 2023 levels, while practitioners with VP or C-suite sponsorship show measurably greater influence over technology selection decisions than those with director-level sponsorship alone.
Pain Point Analysis of the Finops Market
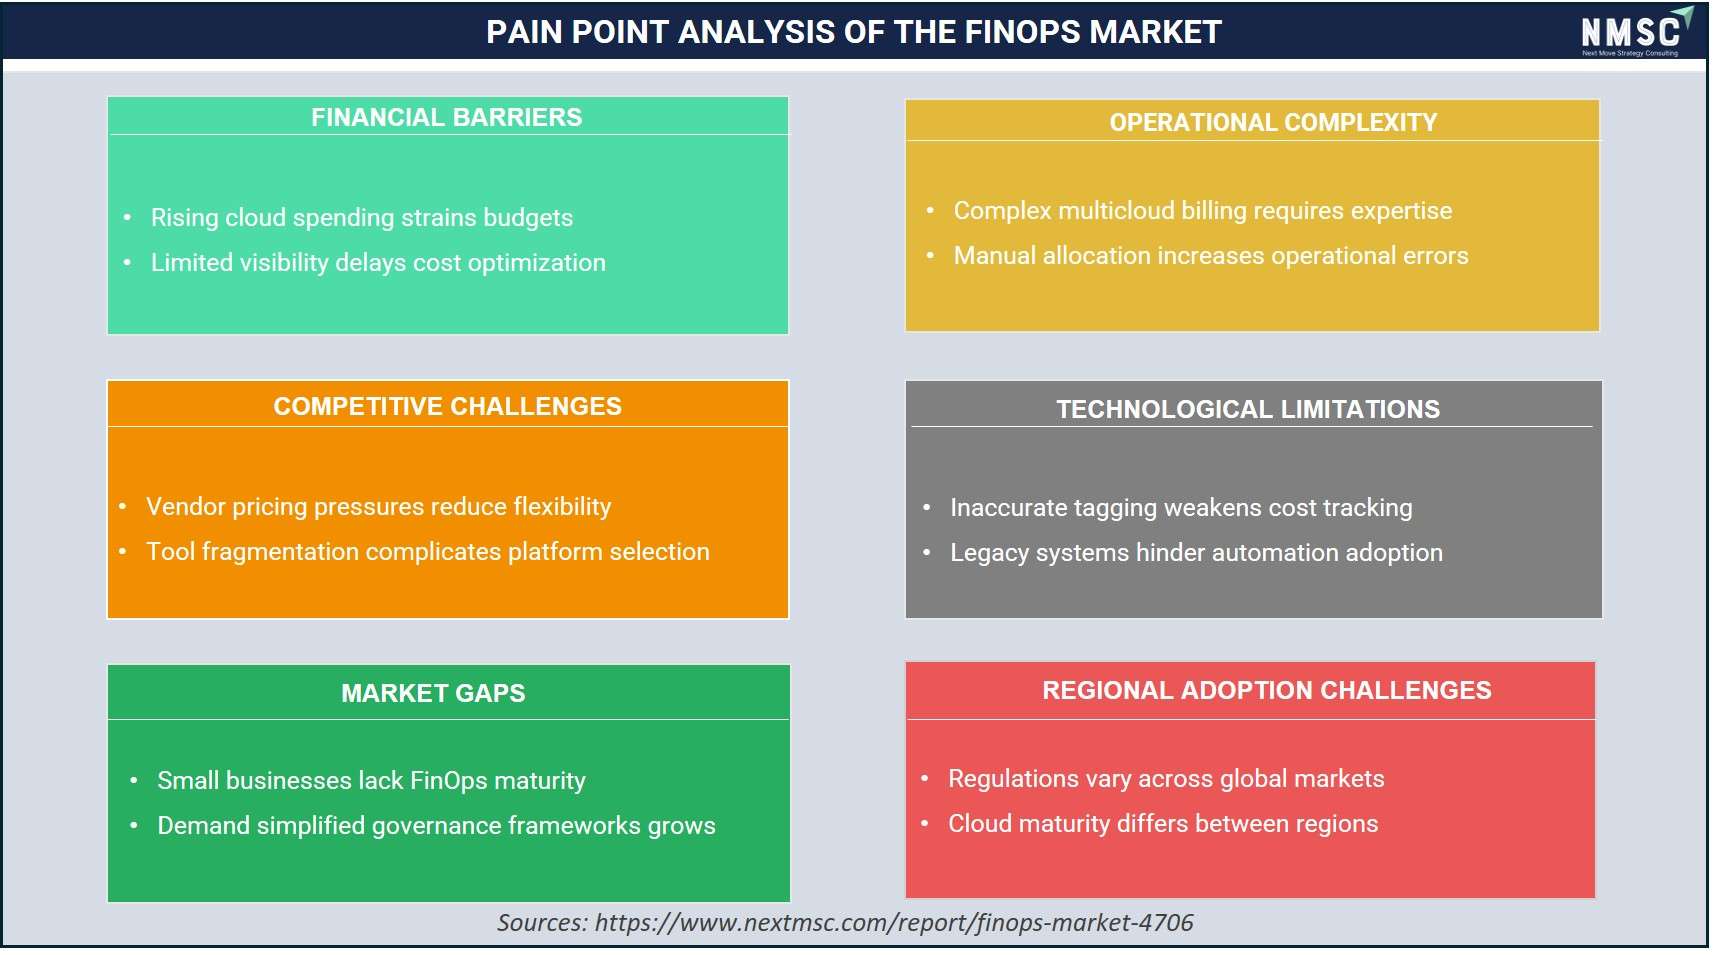
The Pain Point Analysis of the market highlights key challenges affecting enterprise cloud cost management. Rising cloud spending, limited cost visibility, and complex multicloud environments hinder effective financial governance. Organizations also face fragmented tool ecosystems, inaccurate resource tagging, and legacy infrastructure constraints. Additionally, varying regional regulations and differing levels of cloud maturity create adoption challenges, increasing the demand for automated, standardized, and intelligent FinOps solutions.
Growth Drivers and Restraints
Growth Catalyst and Risk Assessment Matrix
|
Factors |
Type |
(+/-) % Impact on CAGR |
Geographic Relevance |
Impact Timeline |
|
Surging AI and GPU workload spend requiring dedicated cost governance |
Driver |
+2.6% |
Global |
2026–2035 |
|
Expansion of FinOps scope into SaaS, licensing, and data center spend |
Driver |
+2.0% |
Global |
2026–2035 |
|
Adoption of FOCUS and other cost-data standardization frameworks |
Driver |
+1.3% |
North America, Europe |
2026–2032 |
|
Rising executive and board-level scrutiny of technology ROI |
Driver |
+1.5% |
Global |
2026–2035 |
|
Growth of Kubernetes and multi-cloud infrastructure footprints |
Driver |
+1.1% |
North America, Asia-Pacific |
2026–2035 |
|
Vendor consolidation into unified, agentic FinOps platforms |
Driver |
+0.9% |
Global |
2027–2035 |
|
Shortage of skilled FinOps and cloud-cost practitioners |
Restraint |
-1.0% |
Global |
2026–2032 |
|
Fragmented tagging and metadata quality limiting allocation accuracy |
Restraint |
-0.8% |
Global |
2026–2030 |
|
Budget scrutiny on tooling spend amid broader IT cost discipline |
Restraint |
-0.5% |
North America, Europe |
2026–2029 |
What Is the Primary Growth Driver of the FinOps Market?
Surging AI and GPU workload spend that requires dedicated cost governance is the primary driver of the market. FinOps Foundation survey data representing more than USD 83 billion in annual cloud spend shows that 98% of practitioners now manage some form of AI cost, up from 31% two years earlier. We observed that this behavioral shift, combined with token-level billing complexity that traditional cloud cost tools were not built to handle, continues to anchor new platform adoption and expansion spend across enterprises of every size.
How Is Technology Spend Scope Expansion Driving FinOps Market Growth?
The broadening of FinOps scope beyond public cloud into SaaS, software licensing, private cloud, and data center spend is accelerating platform adoption and upsell. FinOps Foundation data indicates that 90% of practitioners now manage SaaS spend, alongside 64% managing licensing and 57% managing private cloud. Our assessment indicates that this scope expansion, formalized through the Foundation's 2026 mission update and Framework revision, is compressing adoption timelines for platforms capable of unifying cost governance across multiple technology categories rather than cloud alone.
What Is Restraining FinOps Market Expansion?
A persistent shortage of skilled FinOps and cloud-cost practitioners restrains the pace at which organizations can operationalize governance across an expanding technology estate. Independent analysis of Kubernetes workloads found average CPU utilization of just 8% and GPU utilization of only 5% across production clusters prior to optimization, underscoring how far practical adoption still lags available tooling. We found that smaller organizations face particular exposure, as limited in-house FinOps expertise slows the transition from visibility to automated optimization compared with large enterprises that can staff dedicated centralized teams.
Segmentation Analysis
Segment Sizing: By Spend Scope
|
Segment |
2025 (USD) |
2035 (USD) |
CAGR% (2026–2035) |
|
IaaS and PaaS |
USD 5.13 Billion |
USD 10.32 Billion |
7.2% |
|
Kubernetes |
USD 1.66 Billion |
USD 5.16 Billion |
12.0% |
|
AI and GPU |
USD 2.42 Billion |
USD 11.61 Billion |
17.0% |
|
SaaS |
USD 2.87 Billion |
USD 7.74 Billion |
10.4% |
|
Data Platforms |
USD 1.51 Billion |
USD 4.30 Billion |
11.0% |
|
Marketplace and Licensing |
USD 1.06 Billion |
USD 2.58 Billion |
9.3% |
|
Other Usage-Based Spend |
USD 0.45 Billion |
USD 1.29 Billion |
11.1% |
|
Total |
USD 15.1 Billion |
USD 43.0 Billion |
11.0% |
Which Spend Scope Segment Dominates the FinOps Market?
IaaS and PaaS spend under FinOps management led the market with USD 5.13 billion in 2025, reflecting the maturity of public cloud infrastructure cost governance relative to newer spend categories. We observed that AI and GPU is the fastest-growing spend scope, expanding at a 17.0% CAGR from 2026 to 2035, as enterprises rush to bring token-level and accelerator-driven costs under the same allocation and forecasting discipline previously applied only to compute and storage.
Segment Sizing: By Buyer Persona
|
Segment |
2025 (USD) |
2035 (USD) |
CAGR% (2026–2035) |
|
Finance |
USD 4.38 Billion |
USD 10.32 Billion |
8.9% |
|
Engineering |
USD 4.68 Billion |
USD 12.90 Billion |
10.7% |
|
Platform Engineering |
USD 2.72 Billion |
USD 9.46 Billion |
13.3% |
|
Procurement |
USD 1.36 Billion |
USD 3.87 Billion |
11.0% |
|
Managed Service Provider |
USD 1.21 Billion |
USD 4.30 Billion |
13.5% |
|
Executive |
USD 0.75 Billion |
USD 2.15 Billion |
11.1% |
|
Total |
USD 15.1 Billion |
USD 43.0 Billion |
11.0% |
Which Buyer Persona Leads FinOps Market Demand?
Engineering remained the leading buyer persona within the market, valued at USD 4.68 billion in 2025 as platform and infrastructure teams increasingly own tool selection for cost visibility embedded in existing workflows. Our findings suggest that Platform Engineering is the fastest-growing persona, registering a 13.3% CAGR from 2026 to 2035, as organizations formalize internal platform teams responsible for Kubernetes, GPU, and multi-cloud cost governance at scale.
Segment Sizing: By Cloud Deployment
|
Segment |
2025 (USD) |
2035 (USD) |
CAGR% (2026–2035) |
|
SaaS |
USD 10.27 Billion |
USD 30.10 Billion |
11.4% |
|
Self-Hosted |
USD 2.11 Billion |
USD 3.44 Billion |
5.0% |
|
Hybrid |
USD 2.72 Billion |
USD 9.46 Billion |
13.3% |
|
Total |
USD 15.1 Billion |
USD 43.0 Billion |
11.0% |
Which Cloud Deployment Model Is Most Widely Adopted in FinOps?
SaaS-delivered FinOps platforms remained dominant, reaching USD 10.27 billion in 2025 due to faster time-to-value and lower implementation overhead compared with self-hosted alternatives. Based on research conducted by Next Move Strategy Consulting, we found that Hybrid deployment is the fastest-growing model at a 13.3% CAGR from 2026 to 2035, reflecting large enterprises' need to combine SaaS visibility with self-hosted control for sensitive billing and security data.
Growth Opportunities
Our analysis shows that three forward-looking opportunities stand out for stakeholders positioning within the FinOps market over the 2026–2035 forecast period.
How Can AI Token-Cost Governance Unlock Value for Platform Vendors?
Dedicated AI and token-cost governance presents a whitespace opportunity as enterprises seek to connect AI spend to measurable business outcomes rather than raw token consumption. Vendors that ship native model-provider integrations and unit-economics reporting stand to capture recurring platform revenue as engineering and finance teams jointly fund AI initiatives from optimization savings, particularly among software, internet, and banking end users scaling production AI deployments.
Where Do Kubernetes and GPU Automation Create New Demand?
Persistently low GPU and Kubernetes utilization creates an underpenetrated opportunity for autonomous optimization platforms serving platform engineering and MSP buyers. Vendors that deliver validated, continuous rightsizing and commitment automation for AI-equipped clusters can secure long-term platform contracts with enterprises running large-scale training and inference workloads, benefiting from recurring savings-share and subscription revenue tied to compute-intensive infrastructure growth.
How Can SaaS and Licensing Spend Consolidation Benefit Procurement Teams?
Procurement and IT asset management teams seeking unified technology spend governance create an opportunity for vendors offering combined FinOps and SaaS management capabilities. Early movers that integrate license optimization, shadow IT discovery, and renewal analytics into core FinOps platforms can differentiate with mid-market and large enterprise customers pursuing single-pane-of-glass technology spend visibility across cloud, SaaS, and AI simultaneously.
Strategic Framework of the Finops Market
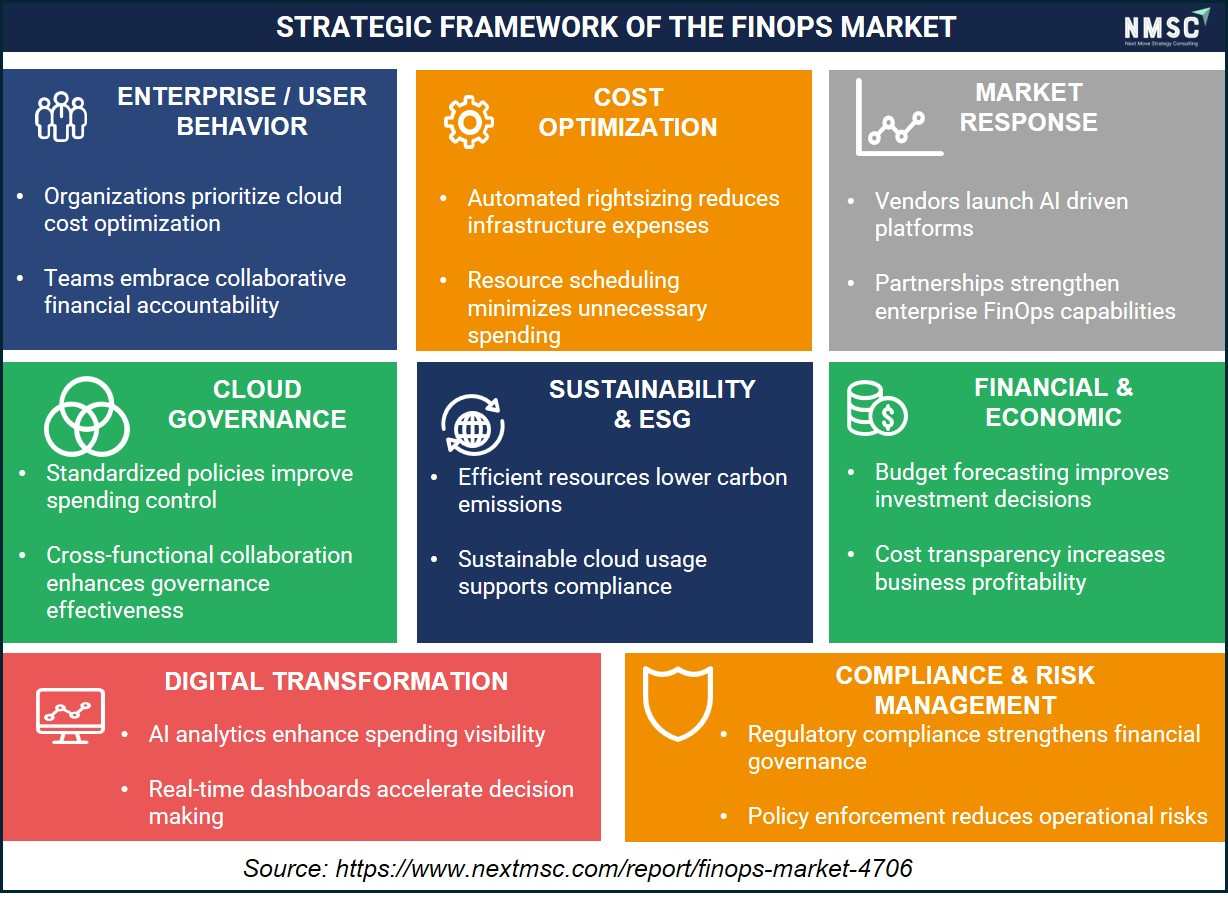
The Strategic Framework of the FinOps Market emphasizes improving cloud financial governance through cost optimization, AI-driven analytics, and collaborative accountability across finance and engineering teams. Organizations are increasingly adopting automated optimization, standardized governance policies, and real-time spending visibility to maximize cloud efficiency. Growing focus on sustainability, regulatory compliance, and strategic partnerships is further enabling enterprises to strengthen financial control, reduce operational risks, and support long-term cloud investment decisions.
Regional Outlook
Geographic Performance Snapshot
|
Region |
2025 (USD) |
2035 (USD) |
CAGR% (2026–2035) |
Key Driver |
|
North America |
USD 6.64 Billion |
USD 16.34 Billion |
9.4% |
Mature cloud hyperscaler base and early enterprise FinOps practice adoption |
|
Europe |
USD 3.93 Billion |
USD 10.32 Billion |
10.1% |
EU data and cloud governance rules and multi-cloud sovereignty requirements |
|
Asia-Pacific |
USD 3.17 Billion |
USD 12.04 Billion |
14.3% |
Rapid cloud and AI infrastructure buildout across China, India, and Japan |
|
Middle East & Africa |
USD 0.76 Billion |
USD 2.58 Billion |
13.0% |
National cloud-first digital transformation programs and hyperscaler region launches |
|
Latin America |
USD 0.60 Billion |
USD 1.72 Billion |
11.1% |
Expanding cloud-native adoption among mid-market and digital-native enterprises |
|
Total |
USD 15.1 Billion |
USD 43.0 Billion |
11.0% |
-- |
North America FinOps Market Outlook
North America leads the FinOps market with the most mature enterprise cloud footprint and the earliest formalized FinOps practices globally. We observed that the region's practitioner base, concentrated within the FinOps Foundation's Fortune 100 membership, sustains demand for advanced AI cost governance and multi-cloud commitment automation. Technology adoption remains concentrated among large enterprises with centralized FinOps teams, while strategic outlook favors vendors that can demonstrate measurable ROI on AI and Kubernetes spend to increasingly cost-scrutinizing boards.
Europe FinOps Market Outlook
Europe's FinOps market benefits from strong multi-cloud and hybrid adoption driven by data residency and cloud sovereignty considerations across the region's largest economies. Our assessment indicates that regulatory emphasis on transparent technology governance is reinforcing demand for auditable cost allocation and chargeback capabilities among financial services and public sector buyers. Strategic outlook favors vendors offering strong European data-hosting options alongside FOCUS-aligned reporting for multinational enterprises operating across multiple EU jurisdictions.
Asia-Pacific FinOps Market Outlook
Asia-Pacific is the fastest-growing region in the FinOps market, propelled by rapid cloud and AI infrastructure expansion across China, India, Japan, and South Korea. We found that rising hyperscaler capacity investment and growing domestic AI workload deployment are driving first-time FinOps tool adoption among enterprises previously reliant on native cloud console reporting. Technology adoption is accelerating fastest among software and internet companies, with strategic outlook favoring vendors that support regional cloud providers alongside AWS, Azure, and Google Cloud.
Middle East & Africa FinOps Market Outlook
The Middle East and Africa FinOps market is expanding on the back of national cloud-first digital transformation programs and new hyperscaler region launches across the Gulf states. Our findings suggest that government-led technology modernization initiatives are creating first-generation demand for cost governance tooling among public sector and banking end users. Regulatory influence remains moderate, with strategic outlook favoring vendors partnering with regional systems integrators to support Managed FinOps Operations for organizations building internal practices from a low maturity base.
Latin America FinOps Market Outlook
Latin America's FinOps market is growing alongside expanding cloud-native adoption among mid-market and digital-native enterprises across Brazil and Argentina. We observed that rising e-commerce and fintech cloud consumption is driving early-stage demand for cost visibility and showback capabilities among finance and engineering buyers. Technology adoption remains concentrated in SaaS-delivered tools given limited in-region self-hosted infrastructure, with strategic outlook favoring vendors offering flexible, usage-based pricing suited to the region's mid-market customer base.
United States FinOps Market Outlook
Based on our estimates, the United States FinOps market was valued at approximately USD 5.51 billion in 2025 and is projected to reach USD 13.07 billion by 2035, expanding at a 9.0% CAGR. Demand structure is concentrated among large enterprises with centralized FinOps teams, and adoption level is the highest globally given deep hyperscaler penetration. Competitive intensity is elevated, with the U.S. hosting a majority of the market's leading platform vendors and the FinOps Foundation's core practitioner base.
Canada FinOps Market Outlook
The market in Canada was valued at approximately USD 0.80 billion in 2025 and is projected to reach USD 2.12 billion by 2035, expanding at a 10.3% CAGR. Demand structure mirrors the broader North American pattern, with adoption concentrated among technology and financial services enterprises. Regulatory influence remains limited relative to Europe, and strategic outlook favors vendors extending U.S. enterprise relationships into Canadian subsidiaries and public sector cloud programs.
United Kingdom FinOps Market Outlook
As per our estimate, the United Kingdom FinOps market was valued at approximately USD 1.06 billion in 2025 and is projected to reach USD 2.58 billion by 2035, expanding at a 9.3% CAGR. Demand structure is led by financial services and public sector buyers with mature cloud governance requirements. Technology penetration remains strong across London-based financial institutions, and strategic outlook favors vendors with established local data-hosting and compliance support.
Germany FinOps Market Outlook
According to our analysis, the German FinOps market was valued at approximately USD 0.90 billion in 2025 and is projected to reach USD 2.27 billion by 2035, expanding at a 9.6% CAGR. Demand structure is concentrated among manufacturing and industrial enterprises pursuing hybrid cloud strategies. Regulatory influence from German and EU data protection requirements shapes vendor selection, and strategic outlook favors platforms supporting strong on-premises and self-hosted deployment options.
France FinOps Market Outlook
Based on our estimates, the French FinOps market was valued at approximately USD 0.63 billion in 2025 and is projected to reach USD 1.65 billion by 2035, expanding at a 10.1% CAGR. Demand structure spans public sector and telecom buyers navigating national cloud sovereignty initiatives. Technology adoption is growing steadily among mid-market enterprises, and strategic outlook favors vendors partnering with regional cloud and systems integration providers.
China FinOps Market Outlook
The market in China was valued at approximately USD 1.08 billion in 2025 and is projected to reach USD 3.61 billion by 2035, expanding at a 12.9% CAGR. Demand structure is dominated by large domestic internet and technology enterprises operating at hyperscale. Competitive intensity features strong domestic cloud provider native tooling, and strategic outlook favors vendors capable of integrating with both international and domestic cloud platforms.
India FinOps Market Outlook
As per our estimate, the Indian FinOps market was valued at approximately USD 0.51 billion in 2025 and is projected to reach USD 2.41 billion by 2035, the fastest-growing country in this report at a 16.9% CAGR. Demand structure is led by software and internet enterprises and a fast-growing base of global capability centers. Technology adoption is accelerating rapidly as multinational enterprises expand India-based engineering teams with direct FinOps ownership.
Japan FinOps Market Outlook
According to our analysis, the Japanese FinOps market was valued at approximately USD 0.60 billion in 2025 and is projected to reach USD 1.81 billion by 2035, expanding at an 11.6% CAGR. Demand structure is concentrated among large manufacturing, financial services, and telecom enterprises with established IT governance functions. Regulatory influence remains moderate, and strategic outlook favors vendors offering strong Japanese-language support and integration with domestic systems integrators.
South Korea FinOps Market Outlook
Based on our estimates, the South Korean FinOps market was valued at approximately USD 0.32 billion in 2025 and is projected to reach USD 1.20 billion by 2035, expanding at a 14.3% CAGR. Demand structure is led by technology conglomerates and financial services enterprises scaling AI infrastructure investment. Competitive intensity is rising as domestic cloud consumption accelerates, and strategic outlook favors vendors supporting both hyperscaler and domestic cloud cost governance.
Australia FinOps Market Outlook
The market in Australia was valued at approximately USD 0.29 billion in 2025 and is projected to reach USD 0.96 billion by 2035, expanding at a 12.9% CAGR. Demand structure spans financial services, retail, and public sector enterprises with mature cloud adoption. Technology penetration is high relative to other Asia-Pacific markets, and strategic outlook favors vendors with established local presence and data residency compliance.
United Arab Emirates FinOps Market Outlook
As per our estimate, the UAE FinOps market was valued at approximately USD 0.21 billion in 2025 and is projected to reach USD 0.70 billion by 2035, expanding at a 12.6% CAGR. Demand structure is concentrated among financial services and public sector entities driving national cloud-first initiatives. Competitive intensity is rising as global vendors establish regional data-hosting partnerships, and strategic outlook favors platforms supporting Arabic-language interfaces and regional compliance requirements.
Saudi Arabia FinOps Market Outlook
According to our analysis, the Saudi Arabian FinOps market was valued at approximately USD 0.18 billion in 2025 and is projected to reach USD 0.65 billion by 2035, expanding at a 13.5% CAGR. Demand structure is driven by Vision 2030-linked digital transformation programs across government and banking sectors. Technology adoption is accelerating as hyperscaler regions expand locally, and strategic outlook favors vendors partnering with domestic systems integrators for public sector deployments.
South Africa FinOps Market Outlook
Based on our estimates, the South African FinOps market was valued at approximately USD 0.11 billion in 2025 and is projected to reach USD 0.34 billion by 2035, expanding at a 12.2% CAGR. Demand structure is led by financial services and telecom enterprises serving as the region's cloud adoption leaders. Regulatory influence remains developing, and strategic outlook favors vendors extending Europe-based delivery teams to support South African enterprise customers.
Brazil FinOps Market Outlook
The market in Brazil was valued at approximately USD 0.28 billion in 2025 and is projected to reach USD 0.76 billion by 2035, expanding at a 10.6% CAGR. Demand structure is concentrated among fintech and e-commerce enterprises scaling cloud-native infrastructure. Technology penetration continues to rise as domestic hyperscaler capacity expands, and strategic outlook favors vendors offering Portuguese-language support and flexible SaaS pricing suited to mid-market buyers.
Argentina FinOps Market Outlook
As per our estimate, the Argentine FinOps market was valued at approximately USD 0.12 billion in 2025 and is projected to reach USD 0.36 billion by 2035, expanding at an 11.6% CAGR. Demand structure spans technology and financial services enterprises adopting cloud infrastructure amid a growing digital economy. Competitive intensity remains modest relative to Brazil, and strategic outlook favors vendors entering through regional partnerships and multi-country Latin American sales motions.
Competitive Landscape
We observed that the FinOps market features a fragmented but consolidating competitive landscape, with hyperscaler-native tools, independent software vendors, and diversified IT financial management platforms competing alongside a growing base of point-solution specialists.
|
Key Takeaways |
|
Market Structure: Fragmented; the top companies profiled in this report collectively account for a significant share of global FinOps market revenue, while numerous point-solution vendors serve specific spend scopes such as Kubernetes or commitment management. |
|
Innovation Focus: Agentic and autonomous optimization, AI and token-cost attribution, and FOCUS-aligned data normalization dominate current innovation pipelines across leading vendors. |
|
M&A Activity: Active platform consolidation, exemplified by Flexera's January 2026 acquisition of ProsperOps and Chaos Genius and DoiT International's acquisition of SELECT, as vendors broaden coverage across commitment optimization, data cloud spend, and AI cost governance. |
How Do Companies Compete in the FinOps Market?
Companies compete primarily on breadth of spend-scope coverage, automation depth, and AI cost attribution capability across the industry. Diversified vendors such as IBM Cloudability, ServiceNow, and Flexera leverage broad enterprise IT financial management portfolios to serve large, multi-cloud organizations, while engineering-focused specialists such as CloudZero, Finout, and CAST AI compete on unit economics, developer-friendly integration, and Kubernetes-native automation for cloud-first and AI-native enterprises.
Which Competitive Archetypes Dominate the FinOps Market?
Two archetypes dominate the market: diversified enterprise IT financial management platforms offering integrated FinOps, IT asset management, and SaaS governance, and specialized cloud-native vendors focused on automation, unit economics, or a single spend scope such as Kubernetes or commitments. Broadcom, IBM, and Flexera exemplify the diversified archetype through broad technology spend intelligence portfolios, while CAST AI, ProsperOps, and Infracost exemplify the specialized archetype serving specific automation or shift-left use cases.
How Are Companies Differentiating Through Innovation in FinOps?
Innovation and differentiation strategy increasingly center on agentic automation and AI spend governance. CloudZero's December 2025 agentic FinOps capabilities and Harness's May 2026 AI Cost Management launch both extend natural-language, autonomous cost analysis directly into core platforms. Our analysis shows that vendors unable to demonstrate credible AI and token-level cost attribution risk exclusion from enterprise shortlists as AI infrastructure spend becomes a board-level scrutiny item.
What M&A and Expansion Activity Is Shaping the FinOps Market?
Mergers, acquisitions, and platform expansion continue to consolidate capabilities within the industry. Flexera's January 2026 acquisition of ProsperOps and Chaos Genius broadened its rate-optimization and data-cloud cost coverage, while DoiT International's January 2026 acquisition of SELECT extended its platform into Snowflake spend optimization. Our findings suggest that this M&A activity reflects growing customer demand for unified platforms over fragmented point solutions across cloud, Kubernetes, data platforms, and AI spend.
Key Market Players
Our assessment indicates that the following 20 companies are actively shaping product innovation, platform consolidation, and AI cost governance strategy within the global FinOps market.
-
International Business Machines Corporation
-
Broadcom Inc.
-
Harness Inc.
-
Finout Ltd.
-
CloudZero, Inc.
-
CAST AI Group UAB
-
Vantage SH, Inc.
-
nOps, Inc.
-
CloudBolt Software, Inc.
-
Densify Inc.
-
ProsperOps, Inc. (acquired by Flexera Software LLC, January 2026; profiled independently given its distinct product positioning)
-
Yotascale, Inc.
-
Infracost Inc.
-
Zesty Tech Ltd.
-
DoiT International Ltd.
-
ServiceNow, Inc.
-
Anodot Ltd.
-
Zylo, Inc.
Latest Developments
We found that recent product launches and M&A activity within the FinOps market are concentrated on AI and token-cost governance and agentic automation, reflecting the industry's broader shift beyond traditional cloud cost reporting.
|
Date |
Event |
|
January 2026 |
CAST AI introduced OMNI Compute, a unified compute control plane automatically discovering and allocating capacity across cloud providers, alongside a strategic investment valuing the company above USD 1 billion. |
|
December 2025 |
CloudZero released agentic FinOps AI capabilities, including a conversational assistant that lets any user query cloud and AI spend in natural language and receive context-rich optimization insights. |
Expert Insights
 “Every engineering decision is a buying decision, and when engineers have complete visibility into their cloud costs, they can make smart buying decisions. Better visibility leads to better engineering engagement, which in turn fuels better business outcomes.”
— Phil Pergola, CEO, CloudZero
Statement made during CloudZero's announcement of its 2024 State of Cloud Cost Report, discussing the growing importance of engineering ownership, cloud cost visibility, and collaborative FinOps practices in optimizing cloud spending.
Market Interpretation
The statement highlights the growing evolution of the FinOps market toward engineering-led cloud financial management, where software engineering teams increasingly share responsibility for cloud spending alongside finance and operations. As enterprises expand their cloud-native and multi-cloud environments, organizations are adopting FinOps platforms that provide real-time cost visibility, granular usage insights, and actionable optimization recommendations directly within engineering workflows. This trend is accelerating demand for advanced cloud cost management, financial accountability, and cross-functional FinOps solutions that improve operational efficiency while maximizing the business value of cloud investments.
Investment Opportunities
What Capital Inflows Are Targeting the FinOps Market?
Capital inflows into the FinOps market are increasingly directed toward AI cost governance and agentic automation capabilities. Strategic acquirers continue to fund platform consolidation, as seen in Flexera's acquisition of ProsperOps and Chaos Genius and CAST AI's strategic investment valuing the company above USD 1 billion. We observed that investors favor vendors demonstrating measurable savings outcomes and AI spend attribution, viewing these capabilities as a proxy for durable enterprise contract retention.
How Is Infrastructure Investment Supporting FinOps Platform Scaling?
Infrastructure investment is expanding platform capacity to support real-time, high-frequency billing data ingestion across cloud, Kubernetes, SaaS, and AI providers. Our findings suggest that vendors are investing in eBPF-based runtime attribution and AI gateway telemetry to close allocation gaps that traditional tag-based cost models cannot address, supporting the granularity required for accurate unit-economics reporting across shared GPU and multi-tenant infrastructure.
What ESG Considerations Are Shaping FinOps Investment Decisions?
Environmental, social, and governance considerations are gaining relevance across the industry as carbon-aware optimization capabilities and sustainability reporting features become differentiating criteria. We found that enterprises increasingly request carbon-aware scheduling and sustainability reporting alongside cost optimization, treating efficient infrastructure utilization as a governance indicator that aligns cost discipline with emissions reduction commitments across cloud and AI workloads.
Key Benefits for Stakeholders
How Does This Report Benefit Enterprise and Industry Leaders?
Enterprise and industry leaders gain access to validated segmentation, competitive benchmarking, and regional demand forecasts that support platform selection and budget-planning decisions across the FinOps industry. Our analysis shows that detailed spend-scope, buyer-persona, and deployment-model breakdowns help technology and finance leaders align vendor selection with organizational maturity while identifying underserved spend categories, such as AI and GPU governance, for near-term investment.
How Does This Report Benefit Investors and Financial Analysts?
Investors and financial analysts benefit from consistent, single-point market size and CAGR estimates that support valuation and capital-allocation decisions across the FinOps market's vendor landscape. We observed that the report's regional and segment-level growth differentials help identify which platform categories, including AI and GPU spend analytics and Kubernetes cost management, are best positioned to capture above-market growth through 2035.
How Does This Report Benefit Technology Vendors and Product Teams?
Technology vendors and product teams gain insight into emerging buyer requirements, including agentic automation, AI token-cost attribution, and FOCUS-aligned data normalization, that are reshaping the industry. Our findings suggest that this analysis helps product teams prioritize development roadmaps around AI cost governance and platform engineering personas that are increasingly decisive in enterprise procurement processes.
Key Market Segments
By Cloud Provider Native Tools
-
AWS Cloud Financial Management
-
Cost Explorer and Budgets
-
Compute Optimizer
-
Trusted Advisor
-
-
Microsoft Azure Cost Management
-
Cost Analysis and Budgets
-
Azure Advisor
-
FinOps on Azure
-
-
Google Cloud Cost Management
-
Cost Management Dashboard
-
FinOps Hub
-
Recommenders
-
-
Oracle Cloud FinOps
-
FinOps Hub
-
Cost Governance
-
Cloud Advisor
-
By Third-Party FinOps Software
-
Cost Visibility and Allocation
-
Multi-Cloud Billing Analytics
-
Showback and Chargeback
-
Unit Economics
-
Anomaly Detection
-
Custom Reporting and Dashboards
-
Sustainability Reporting
-
-
Optimization Automation
-
Commitment Management
-
Dynamic Rightsizing
-
Idle Resource Scheduling
-
Spot Instance Orchestration
-
Carbon-Aware Optimization
-
-
Kubernetes Cost Management
-
Cluster Cost Allocation
-
Pod-Level Insights
-
Kubernetes Autoscaler
-
-
Shift-Left Cost Controls
-
Infrastructure as Code Cost Estimates
-
Policy as Code Enforcement
-
Continuous Integration and Continuous Delivery Cost Guardrails
-
-
AI and GPU Spend Analytics
-
SaaS Spend Management
-
License Optimization
-
Shadow IT Discovery
-
Renewal Analytics
-
By FinOps Services
-
Advisory and Strategic Consulting
-
Implementation and Integration
-
Managed FinOps Operations
-
Training and Certification
By Cloud Deployment
-
SaaS
-
Self-Hosted
-
Hybrid
By Spend Scope
-
IaaS and PaaS
-
Kubernetes
-
AI and GPU
-
SaaS
-
Data Platforms
-
Marketplace and Licensing
-
Other Usage-Based Spend
By Buyer Persona
-
Finance
-
Engineering
-
Platform Engineering
-
Procurement
-
Managed Service Provider
-
Executive
By Sales Channel
-
Direct Sales
-
Partner and Reseller
-
Cloud Marketplace
-
Open Source and Community
By Customer Size
-
Large Enterprise
-
Mid-Market
-
Small and Medium Business
By End-User Industry
-
Software and Internet
-
Banking and Finance
-
Retail
-
Manufacturing
-
Healthcare
-
Public Sector
-
Telecom
-
Others
By Region
-
North America: U.S., Canada, Mexico
-
Europe: UK, Germany, France, Italy, Spain, Sweden, Denmark, Finland, Netherlands, Rest of Europe
-
Asia-Pacific: China, India, Japan, South Korea, Taiwan, Indonesia, Vietnam, Australia, Philippines, Malaysia, Rest of APAC
-
Middle East & Africa: Saudi Arabia, UAE, Egypt, Israel, Turkey, Nigeria, South Africa, Rest of MEA
-
Latin America: Brazil, Argentina, Chile, Colombia, Rest of LATAM
Conclusion & Recommendations
What Is the Long-Term Outlook for the FinOps Market?
The long-term outlook for the FinOps market is strongly positive, with the industry forecast to nearly triple from USD 16.8 billion in 2026 to USD 43.0 billion by 2035. Our assessment indicates that this growth will be driven by the durable expansion of FinOps scope beyond public cloud into SaaS, licensing, and AI spend, formalized through the FinOps Foundation's 2026 mission update. Vendors that scale platform coverage across this broader technology estate are best positioned to capture the market's long-term trajectory.
What Strategic Positioning Should Vendors Pursue?
Vendors should pursue strategic positioning around agentic automation and AI cost governance rather than visibility and reporting alone. Next Move Strategy Consulting's analysis indicates that platforms combining native AI provider integrations, FOCUS-aligned data models, and autonomous remediation capabilities will differentiate most clearly as enterprises consolidate point solutions into unified FinOps platforms. Strategic partnerships with hyperscalers and systems integrators will further strengthen enterprise distribution reach.
How Attractive Is the FinOps Market for New Investment?
The FinOps industry presents an attractive investment case, supported by a USD 26.2 billion absolute dollar opportunity between 2026 and 2035 and above-average growth in Asia-Pacific and AI and GPU spend categories. We found that investment attractiveness is highest for vendors combining measurable savings automation with AI cost attribution, positioning them to serve both cost-sensitive mid-market and complex large enterprise segments simultaneously.
What Market Shifts and Key Risks Should Stakeholders Monitor?
Stakeholders should monitor the persistent FinOps talent shortage, fragmented tagging and metadata quality, and competitive pressure from hyperscaler-native tools as key risks to the FinOps market. Our analysis shows that third-party vendors unable to demonstrate clear differentiation from increasingly capable native cloud provider tools risk losing share, particularly among smaller organizations without dedicated FinOps budgets.
What Are the Key Growth Pathways for the FinOps Market?
Key growth pathways include expanding AI and GPU spend analytics, deepening Kubernetes and platform engineering automation, and broadening SaaS and licensing spend consolidation. Next Move Strategy Consulting's analysis indicates that vendors pursuing these pathways while maintaining pricing transparency in core cost-visibility categories will be best positioned to capture the FinOps market's projected growth through 2035.


About the Author

About the Reviewer

At Next Move Strategy Consulting, we understand that insightful market research is the cornerstone of successful business decisions. That's why we employ a robust and multifaceted approach, combining various methodologies to deliver the most accurate and actionable data for our clients.

Research Landscape
We navigate the world of research with two primary approaches:
Qualitative Approach
Our qualitative research methodologies involve immersive techniques such as in-depth interviews, focus groups, and observational studies. By engaging directly with individuals and stakeholders, we uncover valuable insights that quantitative data alone may overlook.

Quantitative Research
In tandem with qualitative methodologies, NMSC leverages the power of Quantitative Research to provide a robust foundation of numerical insights. Through systematic data collection and analysis, we quantify patterns, preferences, and market trends, offering a comprehensive view of the business landscape.
Our quantitative research approach employs diverse tools, including surveys, experiments, and statistical modelling. These methodologies enable us to gather data from a large and representative sample, ensuring the statistical significance of our findings. By employing structured questionnaires and standardized data collection methods, we guarantee the reliability and validity of the information we present to our clients.
Quantitative research is particularly effective in measuring the prevalence of trends, assessing market size, and gauging the impact of various factors on consumer behavior. The numerical precision attained through this approach equips our clients with actionable insights, facilitating data-driven decision-making and strategy formulation.


Our Specialized Toolbox for Industry-Specific Market Research
We deploy a specialized arsenal of techniques tailored to meet your unique requirements. Here's a glimpse into our comprehensive toolbox:

Information Procurement
The stage entails acquiring market data or relevant information through various sources and methodologies.


Market Research Approach
We utilize both top-down and bottom-up approaches in market research analysis to achieve a comprehensive understanding of the market dynamics, leveraging the broad perspective of industry trends and macroeconomic factors alongside detailed insights from specific segments and individual companies.

Porters Five Forces Analysis
We conduct Porter's Five Forces analysis to evaluate the competitive landscape of an industry, providing us with insights into factors that affect profitability and strategic positioning.

SWOT Analysis

Forecasting
We utilize a forecasting model to predict future consumption by considering parameters like population, economics, regulations, market competition, drivers, constraints, technology, and pricing. We also employ statistical techniques such as multilinear regression, exponential smoothing, moving average, ARIMA, and Monte Carlo simulations for accurate predictions. In econometric forecasting, we analyzed short-term and long-term event impacts, attributing values based on regulatory frameworks, economic factors, and market events.





 Speak to Our Analyst