Norway Intralogistics Market by Component (Hardware (AS/RS (Unit-Load, Mini-Load, VLMs, Carousel), Industrial Robots, Mobile Robots (AGV, and AMR), Conveyor Systems, Sortation Systems, Software (WMS, TMS, Yard Management, and Others) and Services), and by End User (Retail and E-commerce, Automotive, Food and Beverage, Pharmaceuticals, Aviation, Logistics, Semiconductor & Electronics, Consumer Goods, Others) –Opportunity Analysis and Industry Forecast, 2025–2030
Industry: Construction & Manufacturing | Lastest Edition: June 18, 2026 | No of Pages: 74 | No. of Tables: 122 | No. of Figures: 67 | Format: PDF | Report Code : CM1052
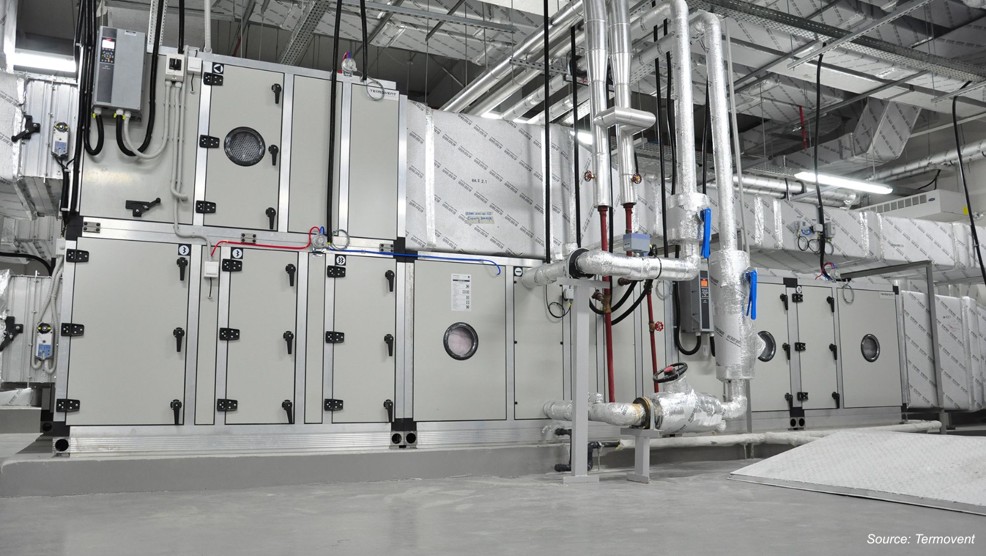
Norway Intralogistics Market Overview
Norway Intralogistics Market size was valued at USD 342.13 million in 2024 and is projected to grow to USD 384.70 million by 2025. Additionally, the market is expected to continue its growth trajectory, reaching USD 603.24 million by 2030, with a CAGR of 9.4% from 2025 to 2030. Also, in terms of volume, the market size was 6.64 thousand units in 2024, and is projected to reach 7.67 thousand units by 2025. Additionally, the industry is expected to continue its growth trajectory, reaching 13.30 thousand units by 2030, with a CAGR of 11.6% from 2025 to 2030.
The market is experiencing significant growth, fuelled by the surge in e-commerce driven by high online shopping adoption, especially in the automotive sector with the rise of electric vehicle (EV) demand. Norway’s population engaged in online shopping, and the automotive sector saw a rise in EV registrations, making automation a key component in meeting these demands. Automated storage and retrieval systems, warehouse management software, and robotics play a vital role in optimizing supply chains, reducing labour dependency, and improving delivery efficiency. However, high upfront costs for automation technologies remain a challenge, particularly for small and medium-sized enterprises. The integration of artificial intelligence into intralogistics is opening new opportunities, enhancing operational efficiency and scalability, and driving future Norway intralogistics market expansion.
High E-Commerce Adoption Boosting Intralogistics Growth
The rapid growth of e-commerce in Norway, driven by high online shopping adoption, is a primary driver of the intralogistics market, necessitating advanced warehousing and order fulfilment solutions. According to the European E-commerce Report 2024, published by Ecommerce Europe and Euro Commerce, 83% of Norway’s population were e-shoppers in 2023, one of the highest rates in Europe, contributing to an e-commerce turnover of USD 13.8 billion (approximately 145 billion NOK), with a year-over-year growth of 6.8%. Intralogistics solutions, such as automated storage and retrieval systems (ASRS), conveyor systems, and warehouse management software (WMS), are critical for optimizing inventory management, accelerating order processing, and meeting consumer demand for rapid delivery. This e-commerce surge drives the adoption of scalable intralogistics systems, significantly fuelling Norway intralogistics market growth by enhancing supply chain efficiency.
Automotive Sector Growth and EV Adoption Driving Intralogistics Expansion
Norway’s growing automotive sector, particularly its leadership in electric vehicle (EV) adoption, coupled with advanced automation, is a key driver of the intralogistics market. According to the International Federation of Robotics (IFR) World Robotics 2024 report, Norway’s robot density in 2023 was 192 robots per 10,000 employees in manufacturing, with increasing applications in automotive logistics. The International Organization of Motor Vehicle Manufacturers (OICA) reported that Norway’s passenger car sales in 2023 totalled 174,329 units, a 4.5% increase from 2022, with EVs accounting for 82% of new car registrations (142,943 units), the highest share globally. The automotive sector growth, driven by EV demand and supported by automation to address labour shortages, propels intralogistics market development in Norway.
High Upfront Costs Limiting Intralogistics Market
A major challenge in the intralogistics sector is the high upfront investment required for automation technologies such as conveyors, warehouse management software, mobile robots, and cranes. These systems involve significant initial costs, which is a barrier for small and medium-sized enterprises. In addition to the acquisition costs, ongoing expenses for maintenance, software updates, and workforce training further raise the total cost of ownership. This financial burden restricts adoption, especially for businesses with limited budgets, slowing the sector's growth and its ability to optimize supply chains.
Integration of Artificial Intelligence Features Significant Opportunities for the Market
The integration of artificial intelligence (AI) into intralogistics is rapidly becoming a major catalyst for market development, fundamentally reshaping warehouse operations and significantly enhancing efficiency. AI-powered industrial robots are now capable of autonomously navigating complex environments to perform core tasks such as picking, packing, and sorting, reducing reliance on manual labour. A prime example is Nimble Robotics, which raised USD 106 million in Series C funding in October 2024, led by FedEx, reaching a valuation of USD 1 billion. The company’s deployment of fully autonomous warehouses, utilizing general-purpose AI robots that adapt to real-time operational changes, showcases the transformative power of AI. As this technology advances, improving scalability, flexibility, and cost-efficiency, it is set to be a key driver in the future growth of the intralogistics market.
Competitive Landscape
The key players operating in the Norway intralogistics industry include AutoStore Systems, Jungheinrich AG, SSI Schäfer, Roket Fram AS, Honeywell International Inc., Vanderlande Industries B.V., Schmersal, Inc., Elements Logic, Siemens AG, Bowe Intralogistics, KNAPP, Swisslog, STILL GmbH, MasterMover, and Locus Robotics, and others.
Norway Intralogistics Market Key Segments
By Component
-
Hardware
-
Automated Storage and Retrieval Systems (AS/RS)
-
Unit-Load AS/RS
-
Mini-Load AS/RS
-
Vertical Lift Modules (VLMs)
-
Carousel AS/RS
-
-
Conveyor Systems
-
Pallet Jacks & Stackers
-
Shuttle Systems
-
Industrial Robots
-
Sortation Systems
-
Mobile Robots
-
Automated Guided Vehicle (AGV)
-
Autonomous Mobile Robot (AMR)
-
-
-
Software
-
Warehouse Management System (WMS)
-
Transportation Management System (TMS)
-
Yard Management Software
-
Inventory Management Software
-
Labor Management Software
-
Other Software
-
-
Service
By Automation Level
-
Manual
-
Semi-Automated
-
Fully Automated
By End-User
-
Retail and E-commerce
-
Automotive
-
Food and Beverage
-
Pharmaceuticals
-
Aviation
-
Logistics
-
Semiconductor & Electronics
-
Consumer Goods
-
Other End Users
Key Players
-
AutoStore Systems
-
Jungheinrich AG
-
SSI Schafer
-
Roket Fram AS
-
Vanderlande Industries B.V.
-
Schmersal, Inc.
-
Elements Logic
-
Siemens AG
-
Bowe Intralogistics
-
KNAPP
-
Swisslog
-
STILL GmbH
-
MasterMover
-
Locus Robotics
Report Scope and Segmentation
|
Parameters |
Details |
|
Market Size in 2025 |
USD 384.70 Million |
|
Market Volume in 2024 |
7.67 thousand Units |
|
Revenue Forecast in 2030 |
USD 603.24 Million |
|
Volume Forecast in 2030 |
13.30 thousand Units |
|
Value Growth Rate |
CAGR of 9.4% from 2025 to 2030 |
|
Volume Growth Rate |
CAGR of 11.6% from 2025 to 2030 |
|
Analysis Period |
2024–2030 |
|
Base Year Considered |
2024 |
|
Forecast Period |
2025–2030 |
|
Market Size Estimation |
Million (USD) |
|
Market Volume Estimation |
Thousand Units |
|
Growth Factors |
|
|
Companies Profiled |
15 |
|
Market Share |
Available for 10 companies |
|
Customization Scope |
Free customization (equivalent up to 80 working hours of analysts) after purchase. Addition or alteration to country, regional, and segment scope. |
|
Pricing and Purchase Options |
Avail customized purchase options to meet your exact research needs. |
")

About the Author
 Ridip Gogoi is a research associate recognized for his strong analytical thinking and meticulous attention to detail. He specializes in transforming complex datasets into meaningful insights that support informed business decisions and strategic planning. With a proactive mindset and strong commitment to accuracy, he contributes effectively to market analysis, data validation, and insight generation. Ridip is driven by continuous learning and consistently works to enhance research quality, analytical depth, and reporting clarity across projects.
About the Reviewer
 Supradip Baul is an accomplished business consultant and strategist with over a decade of rich experience in market intelligence, strategy, technology, and business transformation. His work has included rigorous qualitative and quantitative analysis across multiple industries, helping clients shape investment decisions and long-term roadmaps. Earlier in his career, he was associated with Gartner, where he contributed to industry-leading reports and market share analyses. He has worked with leading global companies and holds an MBA with a dual specialization in Marketing and Finance.
At Next Move Strategy Consulting, we understand that insightful market research is the cornerstone of successful business decisions. That's why we employ a robust and multifaceted approach, combining various methodologies to deliver the most accurate and actionable data for our clients.

Research Landscape
We navigate the world of research with two primary approaches:
Qualitative Approach
Our qualitative research methodologies involve immersive techniques such as in-depth interviews, focus groups, and observational studies. By engaging directly with individuals and stakeholders, we uncover valuable insights that quantitative data alone may overlook.

Quantitative Research
In tandem with qualitative methodologies, NMSC leverages the power of Quantitative Research to provide a robust foundation of numerical insights. Through systematic data collection and analysis, we quantify patterns, preferences, and market trends, offering a comprehensive view of the business landscape.
Our quantitative research approach employs diverse tools, including surveys, experiments, and statistical modelling. These methodologies enable us to gather data from a large and representative sample, ensuring the statistical significance of our findings. By employing structured questionnaires and standardized data collection methods, we guarantee the reliability and validity of the information we present to our clients.
Quantitative research is particularly effective in measuring the prevalence of trends, assessing market size, and gauging the impact of various factors on consumer behavior. The numerical precision attained through this approach equips our clients with actionable insights, facilitating data-driven decision-making and strategy formulation.


Our Specialized Toolbox for Industry-Specific Market Research
We deploy a specialized arsenal of techniques tailored to meet your unique requirements. Here's a glimpse into our comprehensive toolbox:

Information Procurement
The stage entails acquiring market data or relevant information through various sources and methodologies.


Market Research Approach
We utilize both top-down and bottom-up approaches in market research analysis to achieve a comprehensive understanding of the market dynamics, leveraging the broad perspective of industry trends and macroeconomic factors alongside detailed insights from specific segments and individual companies.

Porters Five Forces Analysis
We conduct Porter's Five Forces analysis to evaluate the competitive landscape of an industry, providing us with insights into factors that affect profitability and strategic positioning.

SWOT Analysis

Forecasting
We utilize a forecasting model to predict future consumption by considering parameters like population, economics, regulations, market competition, drivers, constraints, technology, and pricing. We also employ statistical techniques such as multilinear regression, exponential smoothing, moving average, ARIMA, and Monte Carlo simulations for accurate predictions. In econometric forecasting, we analyzed short-term and long-term event impacts, attributing values based on regulatory frameworks, economic factors, and market events.


 Speak to Our Analyst