Oil & Gas EPC Market Global Industry Analysis and Forecast (2026–2035)

Oil & Gas EPC Market size was USD 2,095.24 Billion in 2025, projected to reach USD 2,939.28 Billion by 2035, growing at a CAGR of 3.38% from 2026 to 2035. Key drivers include sustained GCC national energy investment programs, North American LNG export capacity expansion, and downstream petrochemical integration across Asia-Pacific, with Middle East & Africa leading the market.
Download Free Sample PDF
Base Year (2025)
$2,095.24 Billion
Forecast (2035)
$2,939.28 Billion
CAGR (2026-2035)
3.4%
Top Region
Middle East & Africa

What Is the Oil & Gas EPC Market Size?

The global Oil & Gas EPC Market reached USD 2,095.24 Billion in 2025 and is estimated at USD 2,179.65 Billion in 2026, forecast to reach USD 2,939.28 Billion by 2035 at a CAGR of 3.38% from 2026 to 2035. Middle East & Africa leads with approximately 38% revenue share, while Upstream projects dominate the project sector segment at approximately 38% share in 2025.

We observed that upstream greenfield investment in the GCC and LNG capacity build-out in North America and Asia-Pacific are driving sustained EPC award volumes, even as energy transition priorities redirect some capital in European markets. National oil companies remain the dominant buyer category, accounting for the largest single portion of EPC project value committed across all geographies.

Oil & Gas EPC Market Global Industry Analysis and Forecast (2026–2035) Revenue Forecast

Values in USD Billion

2025 $2,095.24 Billion
2025
2026 $2,166.06 Billion
2026
2027 $2,239.27 Billion
2027
2028 $2,314.96 Billion
2028
2029 $2,393.20 Billion
2029
2030 $2,474.10 Billion
2030
2031 $2,557.72 Billion
2031
2032 $2,644.17 Billion
2032
2033 $2,733.54 Billion
2033
2034 $2,825.94 Billion
2034
2035 $2,939.28 Billion
2035

Key Takeaways

By Project Sector: Upstream held the largest share, expanding from USD 796.19 Billion in 2025 to USD 1,083.72 Billion by 2035; Common Facilities is the fastest-growing sub-segment at 4.24% CAGR from 2026–2035.

By Project Environment: Onshore led with USD 1,152.38 Billion in 2025 to USD 1,557.82 Billion by 2035; Offshore is the fastest-growing sub-segment at 4.07% CAGR from 2026–2035.

By Project Lifecycle: Greenfield held the largest share, expanding from USD 942.86 Billion in 2025 to USD 1,263.89 Billion by 2035; Brownfield Revamp is the fastest-growing at 4.55% CAGR from 2026–2035.

By Contract Commercial Model: Lump Sum led at USD 711.38 Billion in 2025 to USD 882.58 Billion by 2035; Cost Reimbursable is the fastest-growing at 4.10% CAGR from 2026–2035.

By Buyer Type: National Oil Company held the largest share at USD 733.33 Billion in 2025 to USD 999.35 Billion by 2035; Midstream Operator is the fastest-growing at 4.25% CAGR from 2026–2035.

Dominant Region: Middle East & Africa dominated with approximately 38% revenue share in 2025.

Fastest-Growing Region: Asia-Pacific is expected to register the highest CAGR of 3.96% during 2026–2035.

Dominant Country: Saudi Arabia led the market with approximately USD 238.86 Billion in 2025.

Fastest-Growing Country: India is the fastest-growing country, supported by refinery expansion programs and LNG receiving terminal construction.

The market presents an absolute investment opportunity of approximately USD 759.63 Billion between 2026 and 2035, calculated as the difference between the 2035 forecast of USD 2,939.28 Billion and the 2026 base of USD 2,179.65 Billion, positioning integrated EPC contractors with multi-sector capability as high-conviction beneficiaries of sustained global hydrocarbon infrastructure investment.

According to NMSC analysis, the segment's growth momentum stems from the convergence of national oil company upstream expansion commitments with large-scale LNG liquefaction and regasification terminal construction programs, which collectively sustain EPC award backlogs at historically elevated levels while increasing average contract size and execution complexity across the industry.

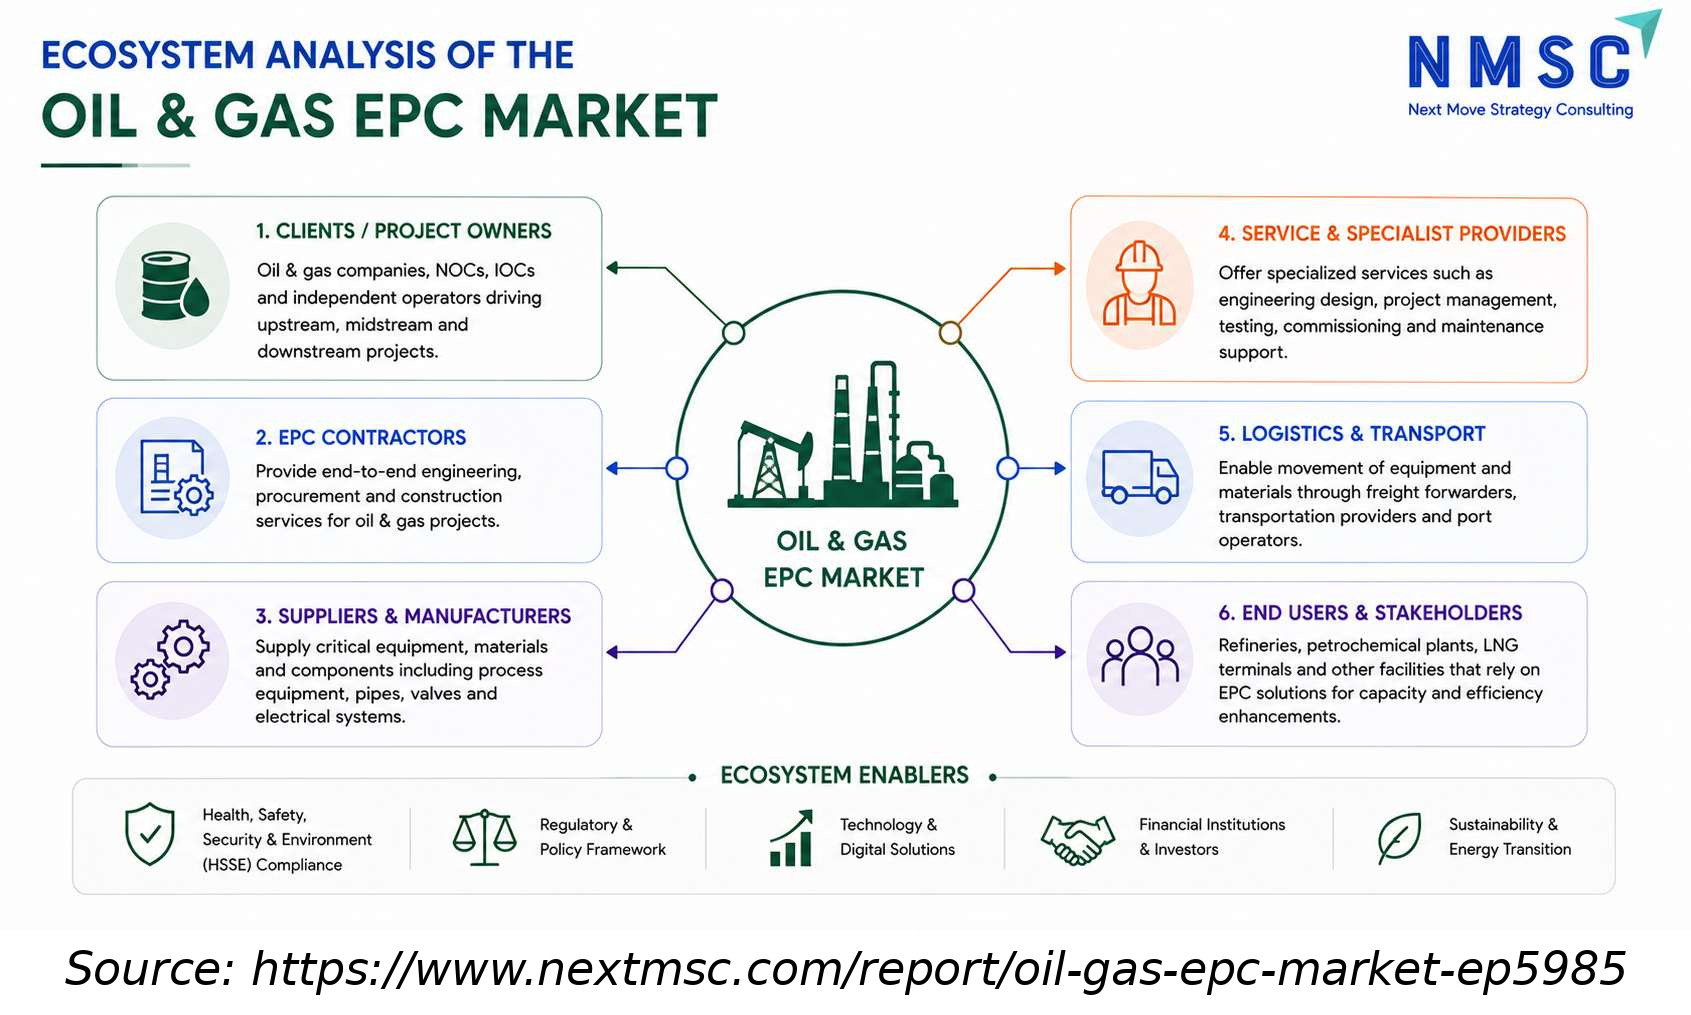
Ecosystem Analysis of the Oil & Gas EPC Industry

The above infographic provides a detailed ecosystem analysis of the Oil & Gas EPC market, mapping out six key segments from project owners to end users. It illustrates how EPC contractors, suppliers, and specialist service providers interact within a connected network to deliver complex infrastructure for refineries and petrochemical plants. The analysis further highlights crucial ecosystem enablers, such as HSSE compliance, regulatory frameworks, and financial investment, that support project execution. Ultimately, it demonstrates how this interconnected chain drives capacity, efficiency, and the transition toward sustainable energy solutions.

What Does the Oil & Gas EPC Market Encompass?

The Oil & Gas EPC Market covers integrated engineering design, procurement, and construction services delivered across upstream production facilities, midstream gathering, processing, pipeline, and LNG infrastructure, downstream refining and petrochemical plants, and common facility utilities and site development projects. Contractors operate under lump sum, cost reimbursable, unit rate, and hybrid commercial models, serving national oil companies, international oil companies, independent producers, midstream operators, refining and petrochemical operators, and public energy infrastructure entities across onshore, offshore, and integrated marine environments.

The market has evolved structurally from fragmented single-discipline contracting toward integrated project delivery, where a single EPC contractor assumes full accountability from engineering completion through construction commissioning and handover. Regulatory frameworks, including U.S. BSEE offshore safety requirements, GCC investment codes, and environmental compliance standards, increasingly shape contractor qualification and project structuring, while technology adoption spanning modular fabrication, digital-twin engineering, and advanced project controls is reshaping delivery efficiency and risk allocation across both greenfield and brownfield project categories.

Market Drivers & Dynamics

Interactive Dataset
GCC national energy program investments (Vision 2030, UAE Energy Strategy 2050) driver +0.90% Middle East & Africa 2026–2035
North American LNG export capacity expansion and terminal construction driver +0.65% North America, Asia-Pacific 2026–2032
Downstream petrochemical integration and refinery upgrade demand driver +0.55% Asia-Pacific, Middle East 2026–2033
Modular fabrication adoption and digital EPC delivery platform deployment driver +0.40% Global 2026–2031
Growing brownfield revamp and decommissioning pipeline in mature basins driver +0.35% North America, Europe 2026–2035
Oil price volatility and IOC capital expenditure deferral cycles restraint −0.60% Global 2026–2030
Skilled labor scarcity and materials cost inflation in offshore markets restraint −0.45% North America, Europe 2026–2031
Energy transition capital redirection away from upstream greenfield EPC restraint −0.35% Europe, North America 2026–2035
Regulatory and permitting delays in frontier geographies restraint −0.30% Asia-Pacific, Latin America 2026–2033
Source: Next Move Strategy Consulting

Growth Drivers

What Is the Primary Growth Driver in the Oil & Gas EPC Market?

The primary growth driver in the Oil & Gas EPC Market is sustained capital investment through GCC national energy programs, which are executing the largest pipeline of upstream expansion, refinery integration, and LNG capacity projects globally. Saudi Aramco's announced capital expenditure guidance and Abu Dhabi National Oil Company's (ADNOC) integrated growth strategy channel hundreds of billions of dollars into EPC-intensive programs through 2030. The U.S. Energy Information Administration reported global upstream oil and gas capital expenditure exceeding USD 500 Billion in 2024, with the GCC region accounting for a disproportionate and growing share of greenfield commitment.

How Is LNG Capacity Expansion Driving Oil & Gas EPC Market Growth?

Our analysis shows that LNG capacity expansion is driving the Oil & Gas EPC Market across North America and Asia-Pacific, where liquefaction terminal buildouts in the United States and regasification terminal additions across India, China, and South Korea are generating large, multi-year contract awards. The U.S. Department of Energy approved a substantial pipeline of LNG export project licenses, several of which reached final investment decision in 2024–2025. This build-out sustains recurring EPC scope for large contractors across FEED, detailed engineering, procurement, and construction phases, benefiting compressed natural gas and LNG infrastructure specialists with established terminal execution track records.
Growth Inhibitors

What Is Restraining the Oil & Gas EPC Market?

We found that oil price volatility constitutes the primary market restraint, as sustained benchmark price weakness triggers capital expenditure deferral among international oil companies and reduces near-term EPC award volume materially. Historical investment cycles demonstrate that upstream greenfield EPC awards contract when prices sustain levels below operator breakeven thresholds for extended periods. This cyclicality is most pronounced in deepwater and remote Arctic project categories, where all-in development costs create sensitivity to price assumptions, effectively setting a threshold below which project cancellations outpace new awards in contractor backlogs globally.

Segmentation Analysis

2025 (USD Billion)
2035 (USD Billion)
Upstream 2025: $796.19 Billion | 2035: $1,083.72 Billion
Upstream
Midstream 2025: $586.67 Billion | 2035: $823.48 Billion
Midstream
Downstream 2025: $523.81 Billion | 2035: $746.39 Billion
Downstream
Common Facilities 2025: $188.57 Billion | 2035: $285.69 Billion
Common Facil
Upstream $796.19 Billion $1,083.72 Billion 3.13%
Midstream $586.67 Billion $823.48 Billion 3.44%
Downstream $523.81 Billion $746.39 Billion 3.61%
Common Facilities $188.57 Billion $285.69 Billion 4.24%

Which Project Sector Segment Dominates the Oil & Gas EPC Market?

Upstream projects lead the Oil & Gas EPC Market at USD 796.19 Billion in 2025, expanding to USD 1,083.72 Billion by 2035, reflecting the continued centrality of production facility construction, wellhead infrastructure, and subsea system installations to overall project value. Common Facilities is the fastest-growing project sector segment at a 4.24% CAGR from 2026 to 2035, driven by increasing utilities, power and steam system, and flare elimination scope embedded within large-scale greenfield and brownfield programs as operators apply stricter environmental compliance requirements across new project approvals.

2025 (USD Billion)
2035 (USD Billion)
Onshore
Plain and De
Remote and A
Offshore
Shallow Wate
Segment Item 2025 (USD Billion) 2035 (USD Billion) CAGR
Onshore $10.0 USD Billion $40.0 USD Billion 25.0%
Plain and Desert $17.1 USD Billion $51.1 USD Billion 11.0%
Remote and Arctic $24.2 USD Billion $62.2 USD Billion 25.0%
Offshore $31.3 USD Billion $73.3 USD Billion 11.0%
Shallow Water $38.4 USD Billion $84.4 USD Billion 16.0%

Segment-wise data is locked

Unlock complete segment-wise numbers for By Project Environment.

Unlock Full Data

Which Project Environment Leads and Which Grows Fastest?

Onshore projects dominate the project environment segment at USD 1,152.38 Billion in 2025, reflecting the volume-weighted contribution of onshore upstream field facilities, pipeline infrastructure, and refinery and petrochemical plant construction across Middle East, Asia-Pacific, and North American markets. Offshore is the fastest-growing project environment at a 4.07% CAGR from 2026 to 2035, driven by deepwater development programs in West Africa, Brazil, and Southeast Asia, combined with North Sea decommissioning and production life-extension EPC scope as mature fields require investment to sustain output.

2025 (USD Billion)
2035 (USD Billion)
Greenfield
Brownfield E
Brownfield R
Decommission
Segment Item 2025 (USD Billion) 2035 (USD Billion) CAGR
Greenfield $10.0 USD Billion $40.0 USD Billion 27.0%
Brownfield Expansion $17.1 USD Billion $51.1 USD Billion 9.0%
Brownfield Revamp $24.2 USD Billion $62.2 USD Billion 19.0%
Decommissioning $31.3 USD Billion $73.3 USD Billion 17.0%

Segment-wise data is locked

Unlock complete segment-wise numbers for By Project Lifecycle.

Unlock Full Data
2025 (USD Billion)
2035 (USD Billion)
Lump Sum
Cost Reimbur
Unit Rate
Hybrid
Segment Item 2025 (USD Billion) 2035 (USD Billion) CAGR
Lump Sum $10.0 USD Billion $40.0 USD Billion 14.0%
Cost Reimbursable $17.1 USD Billion $51.1 USD Billion 24.0%
Unit Rate $24.2 USD Billion $62.2 USD Billion 22.0%
Hybrid $31.3 USD Billion $73.3 USD Billion 12.0%

Segment-wise data is locked

Unlock complete segment-wise numbers for By Contract Commercial Model.

Unlock Full Data

Which Contract Model Dominates and Which Is Fastest-Growing?

Lump Sum contracts lead at USD 711.38 Billion in 2025, reflecting their continued preference for well-defined scope greenfield projects where operators seek full price certainty, and contractors accept schedule and cost risk. Cost Reimbursable is the fastest-growing contract model at a 4.10% CAGR from 2026 to 2035, driven by operator preference for this structure on complex offshore deepwater projects, frontier developments with uncertain scope definitions, and brownfield revamp programs where full scope definition is impractical before construction mobilization.

2025 (USD Billion)
2035 (USD Billion)
National Oil
Internationa
Independent
Midstream Op
Refining and
Segment Item 2025 (USD Billion) 2035 (USD Billion) CAGR
National Oil Company $10.0 USD Billion $40.0 USD Billion 24.0%
International Oil Company $17.1 USD Billion $51.1 USD Billion 22.0%
Independent Oil and Gas Company $24.2 USD Billion $62.2 USD Billion 20.0%
Midstream Operator $31.3 USD Billion $73.3 USD Billion 22.0%
Refining and Petrochemical Operator $38.4 USD Billion $84.4 USD Billion 13.0%

Segment-wise data is locked

Unlock complete segment-wise numbers for By Buyer Type.

Unlock Full Data

Growth Opportunities

Our analysis shows that three whitespace opportunities stand out for EPC contractors and investors positioning ahead of 2035 demand within the Oil & Gas EPC Market.

Can Brownfield Revamp Programs Unlock Recurring EPC Revenue Streams?

The aging infrastructure base across North American and European refining and petrochemical complexes is generating a recurring brownfield revamp and upgrade pipeline that operates with different demand dynamics than volatile greenfield award cycles. Operators seeking to extend facility life and comply with tightening emissions regulations are commissioning EPC-scope revamp packages that benefit the Brownfield Revamp project lifecycle segment. Contractors with established brownfield engineering, turnaround management, and site integration capabilities are positioned to capture a disproportionate share of this predictable, recurring opportunity through 2035.

Does Deepwater Expansion in Africa and Latin America Create New EPC Market Entry Points?

African deepwater blocks operated by IOCs and national oil companies are progressing toward field development planning stages, generating upcoming FEED and EPC award opportunities for offshore subsea and floating production facility contractors. Brazil's pre-salt expansion and West Africa's deepwater programs benefit the Offshore project environment and Upstream project sector segments, where subsea production system and floating production unit EPC packages represent high-value, long-duration contracts. Contractors with established deepwater execution capability and verified track records in thermal enhanced oil recovery and conventional offshore project delivery are best positioned for this geographic opportunity expansion.

How Does the GCC Downstream Integration Wave Create Incremental EPC Demand?

The Gulf Cooperation Council's strategic push to integrate downstream petrochemical manufacturing with existing refining infrastructure is generating a wave of integrated complex EPC projects across Saudi Arabia, UAE, and Kuwait. These programs target value chain extension from crude refining through specialty chemical production, creating scope that combines refinery conversion unit EPC with petrochemical plant construction in single-contract packages. This downstream integration wave benefits the Downstream project sector and National Oil Company buyer type segments, with total addressable EPC scope running into hundreds of billions of dollars across the GCC through 2035.

Regional Outlook

2025 (USD Billion)
2035 (USD Billion)
Middle East
North Americ
Asia-Pacific
Europe
Latin Americ
Region 2025 (USD Billion) 2035 (USD Billion) CAGR (%)
Middle East & Africa $10.0 USD Billion $40.0 USD Billion 9.0%
North America $17.1 USD Billion $51.1 USD Billion 27.0%
Asia-Pacific $24.2 USD Billion $62.2 USD Billion 25.0%
Europe $31.3 USD Billion $73.3 USD Billion 23.0%
Latin America $38.4 USD Billion $84.4 USD Billion 12.0%

Regional data is locked

Unlock complete regional numbers for this market.

Unlock Full Data

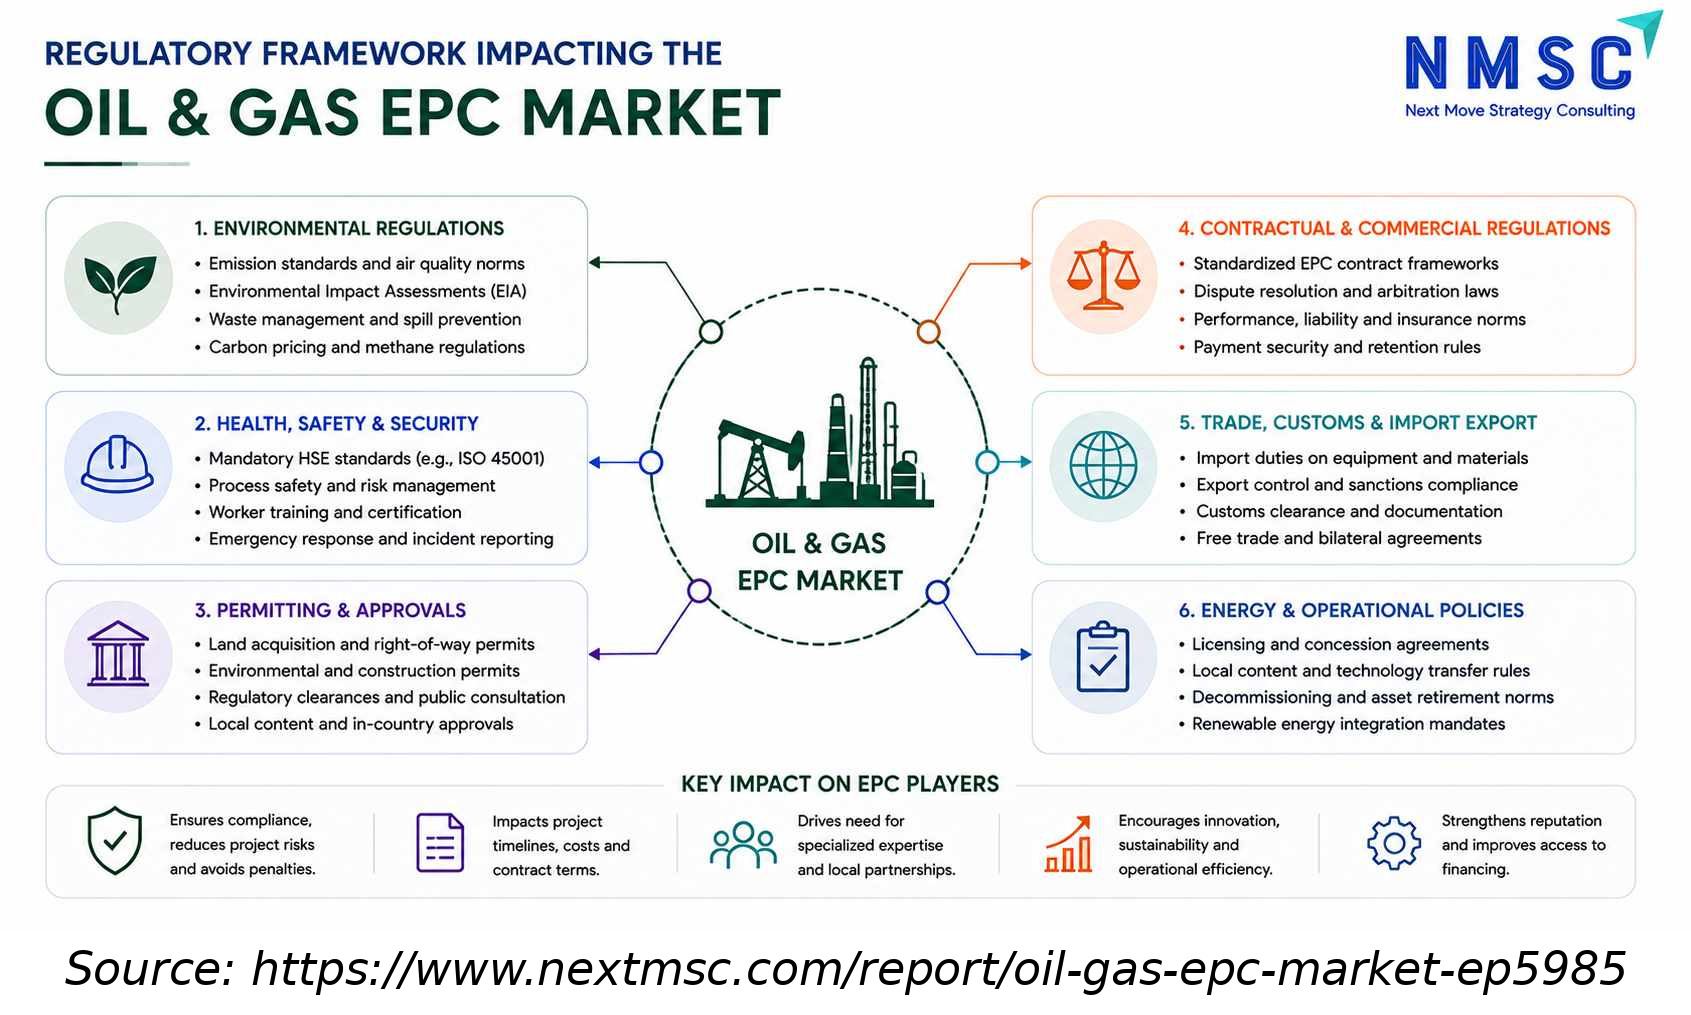
Regulatory Framework Impacting the Oil & Gas EPC Industry

The above infographic outlines the regulatory framework impacting the Oil & Gas EPC market, identifying six key areas of governance, from environmental rules to commercial regulations. It details how these mandates, including strict HSE standards and permitting requirements, significantly influence project timelines and costs. The analysis further highlights the overall impact on EPC players, noting that compliance drives the need for specialized expertise and encourages innovation. Ultimately, it concludes that navigating this complex regulatory landscape is essential for ensuring safety, strengthening reputation, and improving access to financing.

Competitive Landscape

Our assessment indicates that the competitive landscape spans diversified global EPC primes, specialized offshore and subsea contractors, process-technology-led engineering firms, and regional execution specialists, each competing on project execution track record, sector-specific technical capability, and depth of national and international oil company relationships. Key Takeaways

Dimension Description
Dimension Assessment
Market Structure Moderately concentrated; top 10 contractors hold the majority of award value, led by diversified EPC primes with multi-sector capability across upstream, LNG, and downstream categories
Innovation Focus Modular fabrication scale-up, digital-twin-based project delivery, AI-assisted engineering, and integrated FEED-to-EPC contract models reducing scope handover gaps
M&A Activity Selective capability acquisitions and regional joint ventures for local content compliance; organic portfolio positioning preferred over large-scale contractor consolidation

How Do Companies Compete in the Oil & Gas EPC Market Industry?

Companies in the Oil & Gas EPC Market compete primarily on project execution track record across key sector categories, technical differentiation in process engineering and construction methodology, and depth of customer relationships with national and international oil companies. Our findings suggest that integrated FEED-to-EPC capability is a structural competitive advantage, as operators increasingly prefer contractors who can convert engineering studies into binding construction contracts without scope handover gaps. Geographic coverage, local content compliance capability, and demonstrated ability to manage large construction workforces in remote and offshore environments separate leading contractors from mid-tier competitors.

Which Competitive Archetypes Dominate the Oil & Gas EPC Market?

Diversified global EPC primes such as Technip Energies, Bechtel Corporation, and Saipem dominate through multi-sector delivery capability spanning upstream offshore, LNG terminal, and downstream petrochemical project categories. Specialized offshore and subsea contractors, including Subsea7 and TechnipFMC, differentiate on deepwater and subsea system execution depth. Asian-based contractors including Samsung E&A, Hyundai Engineering & Construction, JGC Corporation, and Chiyoda Corporation compete on LNG plant execution expertise and cost-competitive engineering capability. Regional champions such as NMDC Energy PJSC maintain strong positioning through established national oil company relationships and gas turbine and utility systems integration experience across GCC programs.

What Innovation and Differentiation Strategies Are Companies Pursuing?

We observed that leading EPC contractors are investing in integrated digital project delivery platforms that connect engineering design data to procurement and construction management in unified environments, reducing rework, improving schedule adherence, and enabling real-time performance tracking. Modular fabrication capability is also a key differentiator, with contractors establishing owned or contracted module fabrication yards in cost-competitive locations including Southeast Asia and the Middle East to accelerate schedules while reducing site labor concentration risk on complex remote projects.

What M&A and Partnership Activity Is Shaping the Oil & Gas EPC Market?

Recent competitive activity reflects selective partnerships and capability acquisitions rather than large-scale consolidation, as established EPC contractors expand service breadth into emerging technology integration and regional market entry through structured agreements. Our assessment indicates that joint venture structures between global EPC primes and regional contractors are the dominant vehicle for new geographic market entry, particularly in markets with strong local content compliance requirements across the Middle East, Africa, and Asia-Pacific, where qualification mandates require demonstrated local execution presence.

Key Market Players

Based on research conducted by NMSC, the following companies represent the validated set of leading participants across oil and gas EPC project delivery, spanning upstream, midstream, downstream, and common facilities categories globally.

Saipem S.p.A. McDermott International, Ltd. China Petroleum Engineering & Construction Corporation Sinopec Engineering (Group) Co., Ltd. Technip Energies N.V. MAIRE S.p.A. Técnicas Reunidas, S.A. NMDC Energy PJSC JGC Corporation SAMSUNG E&A Co., Ltd. Subsea7 S.A. Aker Solutions ASA Larsen & Toubro Limited Worley Limited TechnipFMC plc KBR, Inc. Bechtel Corporation Chiyoda Corporation Hyundai Engineering & Construction Co., Ltd. John Wood Group PLC

Latest Developments

We found that recent corporate activity in the Oil & Gas EPC Market reflects sustained contract award momentum in the Middle East and LNG-linked project categories, alongside strategic capability investments to address digital delivery and local content compliance requirements.

Date Event
August 2026 McDermott and its Qingdao McDermott Wuchuan consortium secured a more than USD 1 billion EPCI contract for Package 4 of ADNOC’s Umm Shaif Integrated Gas Cap and Surface Pressure Boosting Project.
February 2026 Technip Energies-led JV was awarded a major EPCC contract for QatarEnergy’s North Field West onshore LNG facilities. The contract covers two 8-MTPA LNG trains and is valued at approximately over USD 1.14 billion for Technip Energies, making it a major LNG EPC award.
January 2026 McDermott awarded EPCI contract for ADNOC’s Nasr-115 Expansion Project and the contract covers engineering, procurement, construction and installation (EPCI) for offshore oil-field expansion.

Investment Opportunities

Where Are Capital Inflows Concentrating in the Oil & Gas EPC Market?

Capital inflows in the Oil & Gas EPC Market are concentrating in Middle East upstream and downstream integration megaprojects, where Saudi Aramco's expansion programs and ADNOC's integrated energy investment framework sustain multi-year EPC award pipelines with high contract value and long execution durations. Contractor equity investment is simultaneously targeting digital delivery infrastructure and modular fabrication capacity. Investors tracking EPC contractor equities monitor backlog-to-revenue ratios and contract award announcement velocity as leading indicators of forward revenue visibility in this capital-intensive sector.

How Is Infrastructure Investment Shaping Long-Term Capacity?

Infrastructure investment within the Oil & Gas EPC Market is shifting toward modular fabrication capacity and digital engineering platforms, enabling contractors to scale project delivery without proportional increases in permanent headcount. This reflects lessons from megaproject cost overruns where large site labor concentrations in remote offshore or Arctic environments generated logistical and productivity risks. Companies building owned or contracted fabrication yard capacity in cost-competitive locations including Southeast Asia and the Middle East are positioning for superior long-term project economics relative to peers relying on conventional stick-built site construction methodologies.

What ESG Considerations Are Influencing Investment Decisions?

Environmental, Social, and Governance considerations in the Oil & Gas EPC Market center on emissions reduction integration, local employment and skills development compliance, and responsible project execution in ecologically sensitive environments. Investors evaluate EPC contractors on scope 1 and scope 2 emissions reduction commitments in construction operations and on green hydrogen and low-carbon facility EPC capability as a forward-looking differentiator. Contractors embedding sustainability reporting into project execution frameworks and demonstrating indigenous employment and supplier development programs are gaining preference in institutional investor mandates even within the broader fossil fuel infrastructure context.

Key Benefits for Stakeholders

How Does This Report Benefit Industry Leaders?

Industry leaders gain segment-level revenue forecasts and CAGR benchmarks across project sector, project environment, project lifecycle, contract model, and buyer type axes, enabling capital allocation and bidding strategy decisions grounded in the same 2025–2035 figures used consistently throughout this analysis. Our findings on regional growth differentials and competitive archetype dynamics further support market-entry planning and major account relationship prioritization decisions for EPC contractors, engineering services firms, and supply chain companies seeking to align capacity investment with demand growth.

How Does This Report Benefit Investors and Financial Analysts?

Investors and financial analysts gain a reconciled market-sizing model, competitive landscape assessment, and named-company development tracking that supports valuation and capital allocation decisions across publicly listed EPC contractors, engineering services firms, and integrated energy companies. The report's Growth Catalyst & Risk Assessment Matrix quantifies driver and restraint impact on CAGR, aiding scenario analysis and stress testing for portfolio positions with direct or indirect exposure to oil and gas capital expenditure cycles and EPC sector award momentum.

How Does This Report Benefit Technology Vendors and Product Teams?

Technology vendors and product teams gain visibility into which Oil & Gas EPC Market segments, Offshore project environments, cost-reimbursable contract models, and Brownfield Revamp lifecycle categories are absorbing the fastest contract award growth, informing where to prioritize engineering software, project controls platform, and construction management technology go-to-market investment. Regional demand patterns further support geographic expansion planning for digital delivery and modular fabrication technology suppliers targeting EPC contractor procurement and project management infrastructure spending through 2035.

Key Market Segments Evaluated

By Project Sector

  • Upstream
  • Production Facilities
  • Wellhead Facilities
  • Surface and Topsides Facilities
  • Subsea Production Systems
  • Field Processing
  • Oil Processing
  • Field Gas Conditioning
  • Produced Water Treatment
  • Field Gathering
  • Gathering Flowlines
  • Gathering Manifolds
  • Booster Compression
  • Midstream
  • Gathering and Processing
  • Trunk Gathering
  • Gas Processing Plants
  • NGL Recovery and Fractionation
  • Pipeline Transport
  • Crude and NGL Pipelines
  • Natural Gas Pipelines
  • Product Pipelines
  • Pump and Compressor Stations
  • LNG
  • Liquefaction
  • Regasification
  • LNG Storage and Loading
  • Storage and Terminals
  • Crude and Product Storage
  • Export Terminals
  • Import Terminals
  • Downstream
  • Refining
  • Primary Processing
  • Conversion
  • Treating and Blending
  • Petrochemicals
  • Olefins and Aromatics
  • Derivatives and Polymers
  • Integrated Downstream
  • Refining and Petrochemicals
  • Gas-to-Liquids and Gas-to-Chemicals
  • Common Facilities
  • Utilities and Offsites
  • Power and Steam
  • Water and Wastewater
  • Flare and Relief Systems
  • Sulfur Systems
  • Site Infrastructure
  • Site Development
  • Pipe Racks and Interconnections
  • Marine and Access Infrastructure

By Project Environment

  • Onshore
  • Plain and Desert
  • Remote and Arctic
  • Offshore
  • Shallow Water
  • Deepwater
  • Integrated Land and Marine
  • Shore Crossing Pipelines
  • Nearshore Marine Terminals

By Project Lifecycle

  • Greenfield
  • Brownfield Expansion
  • Brownfield Revamp
  • Decommissioning

By Contract Commercial Model

  • Lump Sum
  • Cost Reimbursable
  • Unit Rate
  • Hybrid

By Buyer Type

  • National Oil Company
  • International Oil Company
  • Independent Oil and Gas Company
  • Midstream Operator
  • Refining and Petrochemical Operator
  • Public Energy Infrastructure Entity

By Region

  • North America 
    • U.S.
    • Canada
    • Mexico
  • Europe 
    • UK
    • Germany
    • France
    • Italy
    • Spain
    • Sweden
    • Denmark
    • Finland
    • Netherlands
    • Rest of Europe
  • Asia-Pacific 
    • China
    • India
    • Japan
    • South Korea
    • Taiwan
    • Indonesia
    • Vietnam
    • Australia
    • Philippines
    • Malaysia
    • Rest of APAC
  • Middle East & Africa 
    • Saudi Arabia
    • UAE
    • Egypt
    • Israel
    • Turkey
    • Nigeria
    • South Africa
    • Rest of MEA
  • Latin America 
    • Brazil
    • Argentina
    • Chile
    • Colombia
    • Rest of LATAM

Conclusion & Recommendations

The long-term outlook for the Oil & Gas EPC Market remains structurally positive, with the market expanding from USD 2,179.65 Billion in 2026 to USD 2,939.28 Billion by 2035 at a CAGR of 3.38%, driven by GCC national energy program commitments, LNG capacity build-out in North America and Asia-Pacific, and downstream integration programs across the GCC and Asia. We observed that this growth trajectory is underpinned by long-term operator capital expenditure commitments and multi-year contract backlogs rather than speculative demand, supporting sustained investment in project delivery capability and supply chain capacity expansion.

What Strategic Positioning Do We Recommend?

Our assessment indicates that EPC contractors should prioritize integrated digital delivery capability and modular fabrication investment to capture the fastest-growing project categories, including Offshore environments, cost-reimbursable contracts, and Brownfield Revamp lifecycle programs. Companies without established digital ecosystem capability should pursue platform partnerships and targeted acquisitions rather than organic development alone, given the market's clear shift toward data-integrated engineering and construction delivery. Building and maintaining GCC national oil company relationships is the single highest-return market access priority, given MEA's dominant 38% revenue share and the pipeline of award activity through 2035.

How Attractive Is the Oil & Gas EPC Market for Investment?

Investment attractiveness is high in Asia-Pacific and the Middle East & Africa given CAGR profiles of 3.96% and 3.97%, respectively, with the absolute revenue base of MEA at USD 796.19 Billion in 2025 providing the largest volume of contract award opportunity globally. India offers the strongest growth trajectory at 4.95% CAGR, supported by government-backed refinery expansion and LNG infrastructure mandates. North America provides reliable recurring EPC demand from LNG terminal construction and shale midstream investment, offering lower-cycle risk relative to frontier market entry opportunities in Africa and Latin America.

What Are the Key Market Shifts and Risks?

Key risks include oil price volatility triggering IOC capital expenditure deferral, which remains the primary cyclical threat to award velocity across upstream and complex offshore project categories. Energy transition capital redirection in Europe and North America presents a structural headwind for conventional upstream greenfield EPC demand in those regions through 2035. Our analysis shows that contractors unable to demonstrate competitive modular and digital delivery capability risk losing share to more technology-equipped peers on large award competitions, as operators increasingly use delivery methodology as a selection criterion alongside price and track record.

What Are the Primary Growth Pathways Through 2035?

Primary growth pathways include expanded GCC downstream integration project execution, deepwater development program participation across Africa and Latin America, and recurring brownfield revamp revenue capture in North American and European mature asset markets. We observed that companies combining all three pathways, GCC upstream and downstream, deepwater offshore, and brownfield revamp, are best positioned to capture a disproportionate share of the USD 759.63 Billion absolute market opportunity created between 2026 and 2035, while maintaining resilience against regional demand cycle variability through geographic and project-type diversification.

FAQs

About the Author

Mayurima Roy

Mayurima Roy

Mayurima Roy is Research Analyst at Next Move Strategy Consulting, where she has spent 4 years working across the firm's full industry coverage rather than a single fixed vertical. Her work centers on structured research, ongoing trend tracking, competitive assessment, and insight-led content development, translating complex market data into clear, decision-ready narratives that support informed client decision-making across diverse global industries, market sectors, and world regions every day.

About the Reviewer

Supradip Baul

Supradip Baul

Supradip Baul is an accomplished business consultant and strategist with over a decade of rich experience in market intelligence, strategy, technology, and business transformation. His work has included rigorous qualitative and quantitative analysis across multiple industries, helping clients shape investment decisions and long-term roadmaps. Earlier in his career, he was associated with Gartner, where he contributed to industry-leading reports and market share analyses. He has worked with leading global companies and holds an MBA with a dual specialization in Marketing and Finance.

Download Free Sample

Diana Trejo

DIANA TREJO

Assistant Manager

Sumitomo Corporation de Mexico, S.A. de C.V.

Recently, we purchased a report on the Mexico Data Center Market from Next Move Strategy Consulting. The service has been excellent, with support that is always timely and thoroughly professional. The information provided is interesting, highly useful, and delivered with clarity. I would highly recommend NextMSC for anyone seeking insightful and dependable analysis.

Gustaf Hummel Burstrom

GUSTAF HUMMEL BURSTROM

Founder

Revline Tools AB

Joseph and the team at Next Move Strategy Consulting have been excellent to work with, in supplying us with relevant market data and forecasts for our specific category. We had some special requirements and they were able to do a custom package to suit our needs. We would definitely recommend them to any other company needing market data and forecasts

Pratyush Kumar Das

PRATYUSH KUMAR DAS

Assistant Manager

Polycab India Limited

We would like to express our appreciation for the data and insights provided by nextmsc. We are very pleased with the quality and depth of the information, which has proven to be highly valuable and beneficial for our business decision-making.

Kevin Coker

KEVIN COKER

Founder, CEO and Board Diector

Proxima Clinical Research

I have been using Next MSC reports for product positioning in a new geography for a long time. They have by far the best reports I have found and the price is reasonable too!

Amos Chang

AMOS CHANG

Strategy Consultant

Kardex Group

I have bought the intralogistics market reports from NMSC two times so far. Joseph and his team are always very helpful and flexible in responding to any customization requirements on the report. Their expertise in market reports really helps us steer the day-to-day business. I will definitely recommend and come back myself whenever there is a need.

Custom Market Research Services

We will customize the research for you if the listed report does not fully match your requirements.

Get 30% Free Customization

Select License

This website uses cookies to ensure you get the best experience on our website. Learn more

✖